I. INTRODUCTION
Anelastic recovery of materials has several origins such as reversible dislocation motion,Reference Rajagopalan, Han and Saif1 twinning,Reference Jones and Munro2 stress-induced phase transitions, etc.Reference Goo, Duerig, Melton and Sinclair3 The anelastic recovery by dislocation motion is essentially a thermal-activated process through their interaction with defects, the speed of which is dependent on both the environmental temperature and the holding time.Reference Rajagopalan, Han and Saif1 Anelastic recovery from twinning is due to the movement of twin boundaryReference Jones and Munro2; twinning in the deformed state is not stable, and a reversal driving force in unloading may cause it to disappear or shrink as a result of movements of the twinning boundaries.Reference Jones and Munro2
Until now, the anelastic recovery of magnesium and its alloys was considered to be the result of detwinning when an external stress is removed or reduced, and the detailed mechanism investigated through microstructure observation is difficult to be carried out due to the short duration of this process. Caceres et al. showed that the hysteresis loops of pure magnesium in cyclic deformations are related to  twin, which grows when materials are stressed and partially reverts when unloaded.Reference Caceres, Sumitomo and Veidt4 The behavior and mechanisms of magnesium in loading and unloading processes are different from those of materials that do not exhibit anelastic recovery. For example, the response characteristics and energy absorption behavior of magnesium are strongly affected by cyclic movements of twinning boundaries when it is used as a damping structure. Therefore, a precise understanding in the dynamic behavior and mechanisms of anelastic recovery of magnesium is of great scientific interest for both engineers and researchers.
Anelastic recovery was traditionally investigated by analyzing hysteresis loops. The anelastic recovery strain ε r, the strain difference before and after the anelastic recovery process, was determined from the hysteresis loops via the nominal Young’s modulus G.Reference Caceres, Sumitomo and Veidt4 However, the unloading of magnesium involves both elastic and anelastic processes, which occur simultaneously when the unloading rate is lower than the anelastic recovery rate. In this situation, it is therefore difficult to analyze anelastic recovery behavior independently.Reference Caceres, Sumitomo and Veidt4, Reference Mann, Sumitomo, Caceres and Griffiths5
In the present research, the anelastic recovery is investigated by unloading the sample extremely quickly, so that the anelastic recovery lags behind the elastic recovery and is analyzed independently. In previous research, the interface motions of martensite or twinning have shown to be an important source of acoustic emission (AE).Reference Duerig and Zadno6, Reference Miller and Mclntire7 Therefore, in the current study, AE measurement is used to monitor the dynamic activity of detwinning process during anelastic recovery process for the first time.
II. EXPERIMENTAL PROCEDURES
We used commercial polycrystalline magnesium with a mean grain size of approximately 35 μm (Osaka Fuji Corporation, Amagasaki, Japan).Reference Li and Enoki8 It was manufactured by hot extrusion to the cylindrical specimens with a size of ϕ15 × 15 mm. The other samples with four different mean grain sizes of 35, 100, 400, and 700 μm were produced by recrystallizing the extruded material at various conditions. All materials used in this research were confirmed to have a texture similar to that of S. KleinerReference Li and Enoki9 with a ring fiber texture in which the basal planes are parallel to the extrusion direction with a spread of about 15°.Reference Barnett, Keshavarz, Beer and Atwell10
Compressive tests were performed at different strain levels using repeated cycles from lower strain levels to higher levels along the direction of extrusion. In this cyclic process, the deformation rate was 1.67 × 10⁻⁴ s−1, and an extremely high unloading velocity of approximately 1 ms−1 was used. After unloading, the specimens were held for recovery for 60 min, and AE signals were used to observe the dynamic detwinning behavior in the anelastic recovery process.
Strain rate effects were investigated at strain rates of 1.67 × 10⁻⁵, 1.67 × 10⁻⁴, and 1.67 × 10⁻³ s−1 to strain levels of about 5–6%, in which the samples had an average grain size of 35 μm.
Strain-controlled cyclic compression−quick unloading–recovery processes were carried out at strain of 0.75% for samples with grain size of 100 μm to investigate detwinning behavior as a function of cycle number.
AE system used in the anelastic recovery process was a μDISP (PAC, Princeton, NJ) with a threshold of 40 dB and a 100 kHz high-pass filter, from which the noise of backgrounds could be got rid of completely based on our preliminary research.Reference Li and Enoki8 The AE sensor (M304A, Fuji Ceramics, Tokyo, Japan) was kept in close contact with the sample bottom using a polymer flocculant inside the upper compression jig.Reference Li and Enoki8 A continuous wave memory AE system was used to observe the frequency distribution, the short-time Fourier transform (STFT), and the frequency distribution as a function of time or strain of the AE signals in recovery processes.Reference Li and Enoki8
III. RESULTS
A. Anelastic recovery behavior
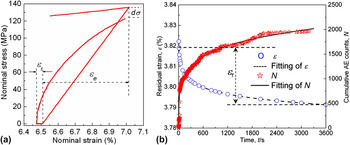
Figure 1(a) shows a typical compression–quick unloading–recovery cycle at nominal strain of approximately 7% for the sample with mean grain size of 35 μm. In each cycle, the stress was quickly unloaded and followed by a recovery for about 60 min. As expected, this gave rise to a broad hysteresis loop with clear separation of elastic recovery and anelastic recovery. After recovery, a decrease in stress was observed. This stress decrease is thought to be the result of anelastic recovery, in which the internal stress was relaxed.
(a) The details of the typical hysteresis loops after quick unloading; (b) residual strain, ε, and cumulative acoustic emission (AE) count, N, after quickly unloading of pure magnesium (35 mm) as well as the fitting results (at strain of 4.26%). −RT/α = A = −0.00468; B = RT/α ln(2τ) = 3.83%, in which elastic recovery strain, ε e, and anelastic recovery strain, ε r, are indicated in the figures correspondingly.

Typical residual strain in the anelastic recovery process, after compressing to a strain level of 4.26%, was recorded as a function of time, as shown in Fig. 1(b). Anelastic recovery took place, and with time the residual strain gradually decreased. The recovery curve in Fig. 1(b) can be accurately described byReference Gil and Guilemany11, Reference Li and Enoki12

where ε is the residual strain at time t, R is the universal gas constant, t is the recovery time, τ is the theoretical relaxation time from the current strain level to zero, T is the absolute temperature, and α is a constant. The curve in Fig. 1(b) corresponds well to Eq. (1) when A = − RT/α = −4.68×10⁻³ and B = (RT/α) (ln(2τ)) =3.83 is selected. Excellent agreement between data fitting results and the experimental data was observed, as illustrated in Fig. 1(b). The corresponding cumulative AE counts, N, in the anelastic recovery process are also plotted in Fig. 1(b). The plot shows that the AE count rate was highest in the initial stage of the recovery process and greatly decreased with time.
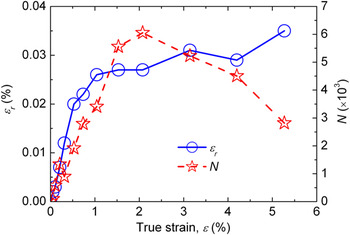
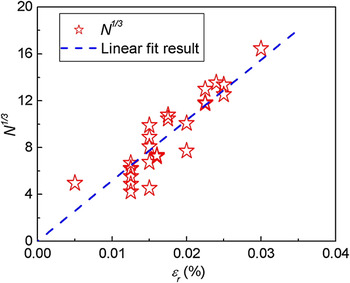
The strain dependence of both ε r and N in each recovery cycle is shown in Fig. 2 (strain lower than 5.5%). The value of ε r increased rapidly with strain. N in each recovery cycle increased significantly with strain in the beginning; however, at strains higher than about 1.5%, N decreased gradually, suggesting that the anelastic recovery process is due to at least two possible processes: detwinning process and reversible motion of dislocation, where no AE signal was detected for the dislocation motion as mentioned above. The direct relationship between N and ε r before strain 1.0%, of three samples (grain size 35 μm), is plotted in Fig. 3. A nonlinear fit to the experimental data was applied and a cubic relation was found between these two parameters at low strain level, implying the close relationship between the detwinning and anelastic recovery process.Reference Li and Enoki12

True strain dependence of N and ε r of pure magnesium, recovery time, 60 min (35 mm).

Relation between ε r and N (strain lower than 1.0%, three samples with grain size of 35 μm).

where k denotes the slope of the linear curve. Thus, the relation between the recovery time t and N can be obtained by assuming that the recovery time dependence of k is a constant in any given recovery process and by substituting Eq. (2) in Eq. (1)

where ε 0 denotes the initial strain immediately after elastic recovery or the starting point of anelastic recovery at which AE signal emission from anelastic recovery begins, and ε is the residual strain at time t. The fitting result was plotted in the same figure and showed good agreement with the experimental data at a strain of 4.26% [Fig. 1(b)]. The AE behavior in Fig. 1(b) is to some extent analogous to the residual strain recovery behavior, as recovery begins at a high rate and then slows down rapidly with time.
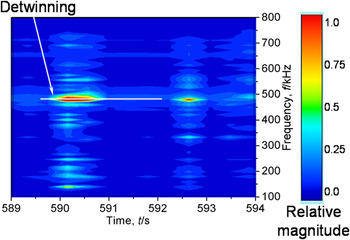
The different changes in N and ε r as a function of strain in Fig. 2 demonstrated that the mechanisms of anelastic recovery and AE event formation were different, although they have a strong relationship as expressed by Eq. (2) at lower strain level. AE signals in the anelastic recovery process are thought to be closely related to detwinning, which gave rise to relative strong elastic energy than the recovery through thermal dislocation motion. In this study, anelastic recovery is thought to consist of at least two components, detwinning and the reversal motion of dislocations, which is a diffusion-controlled thermally activated process,Reference Rajagopalan, Han and Saif1 and no elastic wave or AE signal is emitted. In addition, only one frequency peak, at about 490 kHz, was observed in the anelastic recovery process (Fig. 4). Li and EnokiReference Li and Enoki8 suggested that the frequency of AE signals related to twinning would be 2.5–3 times higher than that for slip (approximately 200 kHz), implying that AE signals in the anelastic recovery process are ascribed to detwinning, since detwinning is a reversal motion of twinning boundaries and that the AE signals from these two processes should have same frequency peak; this is in good agreement with the above-mentioned supposition for formation mechanism of AE in recovery. The relation between time and frequency distribution of AE signals in the anelastic recovery process at a strain level of about 4.26% is shown in Fig. 4 in terms of STFT. The x-axis, y-axis, and color represent time, frequency, and the relative magnitude of the AE frequency, respectively. Only one frequency peak of about 490 kHz is clearly observed in the recovery process (Fig. 4), indicating that AE signals emitted in the current recovery process are possibly due to one mechanism—detwinning.Reference Duerig and Zadno6
Short-time Fourier transform of AE signals in anelastic recovery process for the sample at strain level of 4.26% (grain size 35 μm).

B. Factors related to anelastic recovery
1. Grain size and strain rate
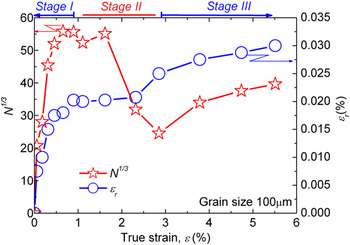
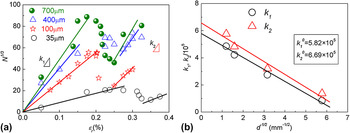
The strain dependences of ε r and N, after recovery in each cycle, behave similarly for all samples with various grain sizes, and a representative result is plotted in Fig. 5 (grain size 100 μm). Three anelastic recovery stages were observed: N increased greatly with increasing strain level in the initial deformation stage, then decreased gradually at higher strain levels, and increased again in the final stage. The relationship between ε r and N for all the samples is plotted in Fig. 6(a); three stages can be classified: at low strain level, N 1/3 increased almost linearly with ε r, then a decrease in N 1/3 with increasing ε r was observed, and finally another linear relation with higher slope appeared at higher strain levels. The range of strain for this evolution is closely dependent on the grain size of sample. If the slope k for the linear relations in stages I and III is plotted against d −1/2, as shown in Fig. 6(b), a relationReference Callister13 between grain size d and k which is a near Hall–Petch relation is observed.

Strain dependences of N 1/3 and ε r of sample with grain size of about 100 μm.

(a) Anelastic recovery strain dependence of cumulative AE counts N 1/3 of pure magnesium with different grain size, and (b) relation between k and grain size.

where D is the slope and d is the sample grain size.
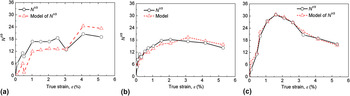
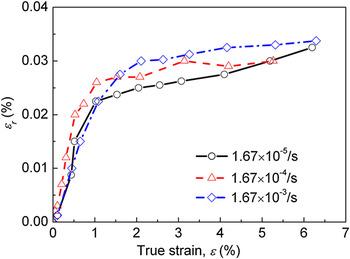
N 1/3 plotted against strain to about 5%, for different strain rates, is shown in Fig. 7. Similar to the results in Fig. 2, N is also observed to increase in the initial stage and decreased in the later stages. Figure 8 shows ε r as a function of strain at different strain rates. Up to strain levels of about 1.5%, ε r increased greatly with increasing strain. The incremental rate of anelastic recovery strain then gradually decreased.
Applied strain dependence of N 1/3 and the model for samples (35 μm) at three strain rates: (a) 1.67 × 10⁻⁵s−1, (b) 1.67 × 10⁻⁴s−1, and (c) 1.67 × 10⁻³s−1.

True strain dependence of (a) ε r and (b) f tw at various strain rates and grain size of 35 μm.

2. Strain-controlled cyclic process
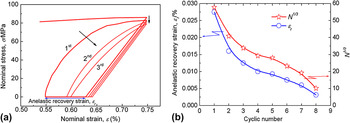
In strain-controlled cyclic process, gradual decreases in both the size of the hysteresis loops and the stress peak at strain of 0.75% were observed as the number of cycles increased [Fig. 9(a)]. In each cycle, the stress was quickly unloaded and was recovered for 60 min followed by a reloading to same strain level and another quick unloading for recovery again. After recovery, decreases in stress after each recovery cycle were observed, which is more obvious with increasing cyclic number as indicated by the vertical arrow in the figure. In addition, a gradual shrinking of the hysteresis loops was observed with increasing cyclic number, suggesting the degradation in strain recovery. With increasing cyclic number, gradual decreases in both ε r and N were observed [Fig. 9(b)], indicating that the volume of reversible movements of both dislocations and twinning boundaries decreased gradually with increasing cycles. The degradation of the anelastic recovery with cyclic number [Fig. 9(b)] is thought to be due to two facts inside the sample: the transformation of unstable twins into a stable state with a result that the detwinning occurred more difficultly with increasing cycles and the amount of dislocations, which can move forward and backward during the cyclic process, decreased gradually with increasing cyclic number.
(a) Hysteresis loops and (b) cyclic number dependence of ε r and N 1/3.

IV. DISCUSSION
A. Anelastic recovery
During the deformation processes, very high stresses (stress concentrations) were generated in the immediate vicinity of deformation twinning. These stresses and the associated strain energies arose from matrix resistance to macroscopic shape changes in the twinned volume. When the applied stress was withdrawn or reduced, internal stresses from twinning could result, at least partly, in the opposite effect, namely deformation by detwinning. Detwinning is considered to proceed by a competitive process between the internal stress and resistances in the vicinity of twin, such as dislocations at the interface between twins, matrix defects, etc. With time, relaxation inside the matrix, caused by reverse motion or destruction of dislocations, ordering of dislocation configurations, etc., could result in suitable conditions for the detwinning process. Detwinning behavior in the current study is considered to be analogous to traditional recovery process, in that the driver of which decreases gradually with recovery time as shown in the AE behavior [Fig. 1(b)].
B. Model of detwinning process
Dislocations at twinning interfaces with Burger’s vectors perpendicular to the interface are thought to be a prerequisite for detwinning because the dislocations at the twinning interface are edge type, which can only move parallel to their Burger’s vectors.Reference Reed-Hill, Hirth and Rogers14 In addition, due to the high stacking fault energy (SFE) for magnesium (about 200 mJ·m−2),Reference Li and Enoki12 twinning formation in magnesium and its alloy requires higher energy or relatively unstable states compared to the basal slip and makes it easy to shrink compared with other materials with low SFE.Reference Christian and Mahajan15
From Eq. (2), N 1/3 can be treated as the anelastic recovery strain ε r from detwinning; therefore, in a given sample, when compressed from a cycle of lower strain level to another cycle of higher strain level, N 1/3 is thought to be related to the following three parameters: the internal stress σ i, which is the detwinning driving force and is assumed to be proportional to the external stress σ a; the increment in the twinning area fraction from one cycle to the next (χ 2 − χ 1), which is thought to be proportional to the detwinning anelastic recovery strainReference Gil and Guilemany11; and the fraction of twinning strain rate before recovery  , which is related to the initial detwinning rate because the newly formed twinning is the most unstable.Reference Christian and Mahajan15 The true strain dependence of N 1/3 can then be expressed byReference Koike, Kobayashi, Mukai, Watanabe, Suzuki, Maruyama and Higashi16

where V is a constant related to the response characteristics of the AE sensor and some intrinsic properties of materials such as the SFE. The twinning density as a function of the true strain, described in terms of the twinning area fraction, follows the sigmoidal equation from our previous researchReference Li and Enoki8

where ε 0 is the theoretical strain when the twinning area fraction is unity and β is the rate exponent.Reference Li and Enoki8
This model [Eq. (4)] was applied to the samples at different strain rates. Good agreement between the experimental results and the model was obtained, especially in high and intermediate strain rates, implying good reliability of the model and the reliability of the current analysis through AE [Fig. 7(a)–7(c)].
C. Fraction of anelastic recovery by detwinning
The results in both Fig. 6(a) and in Fig. 4 indicate that at stage I there should be a detwinning-dominated recovery process ( twinningReference Christian and Mahajan15) since a linear relation between N 1/3 and ε r could be observed. At stage II, the twinning density increased gradually with increasing strain levelReference Li and Enoki8; however, the twinning process evolved into a twinning growth process,Reference Li and Enoki8 implying that the number of freshly formed twinnings or unstable twinnings was decreased accordingly, resulting in a decrease in N as described by Eq. (4). In addition, the anelastic recovery process evolved into a dislocation motion dominant process with increasing strain level because of the increasing dislocation activities of nonbasal slip systems in the deformation process at higher strain levels.Reference Jones and Munro2 The anelastic recovery strain, which consists of both detwinning and dislocation motion, therefore continued to increase. In the final stage, other twinning systems, for example,
 should be activated as a result of reorientation of grains and an increase in internal stress.Reference Li and Enoki9 The
 detwinning process is thought to lead to the second linear relation for their higher stress required in their formation process compared to the
 twinning, which has a higher slope, seen in the final stage.
In the near Hall–Petch relation in Eq. (6), the physical meaning of k 0 is the value of k when anelastic recovery is fully realized by detwinning. With increasing grain size, the twinning density will grow,Reference Christian and Mahajan15 which leads to a higher fraction of anelastic recovery by detwinning. As can be seen in Fig. 8(b), when d −1/2 exceeds 6.5–7.0 μm (grain size lower than 7–15 μm), the value of k approaches zero, where there is no twinning formed; therefore no AE signal could be detected from its corresponding recovery process due to detwinning. This result is, to a certain degree, in agreement with the Hall−Petch relationReference Barnett, Keshavarz, Beer and Atwell10: in the deformation process, twinning became difficult as the grain size became finer or basal and nonbasal slip became dominant, shown by the high value of the slope in the Hall–Petch twinning relation.Reference Barnett, Keshavarz, Beer and Atwell10
The higher the value of k, the higher the fraction of anelastic recovery strain by detwinning, f tw. If we suppose that k has a linear relation with f tw, it follows that

then the fraction of anelastic recovery strain by dislocation motion, f dis, can be described by the following equation, correspondingly,

The absolute value of the anelastic recovery strain by detwinning can be calculated from

and the anelastic recovery strain by dislocation motion can be deduced from

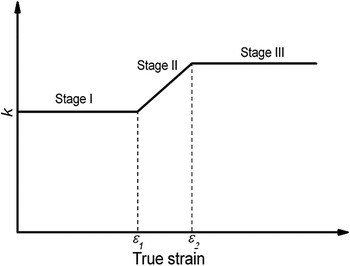
Thus, using k 0, the anelastic recovery strain by detwinning, ε tw, and dislocation motion, ε dis, can be calculated. The values of k 0 in stage I and stage III are k 10 and k 20, respectively. In stage II, k 0 is thought to vary from k 10 to k 20, following a linear relation with the true strain, as follows

where ε 1 is the critical strain level at which the transition from stage I to stage II begins. Correspondingly, ε 2 is the critical strain level at which stage II starts to evolve into stage III, as shown schematically in Fig. 11.
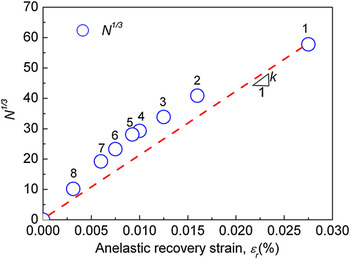
Relation between ε r and N 1/3 in strain-controlled cyclic process.

Schematic showing the evolution of slope k as a function of strain.

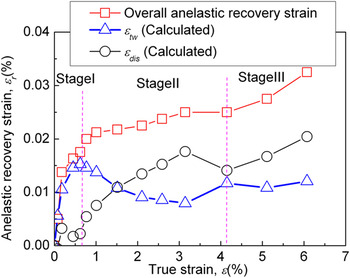
Separation of anelastic recovery strain by detwinning from recovery by dislocation motion was achieved for the first time using Eq. (11) substituted in Eqs. (9) and (10), as shown in Fig. 12, for the sample of grain size 100 μm. A fairly gradual increase in the anelastic recovery strain by dislocation motion was observed with increasing strain, whereas the anelastic recovery strain by detwinning, ε tw, showed a completely different behavior because of the variation in detwinning activity with strain levels.

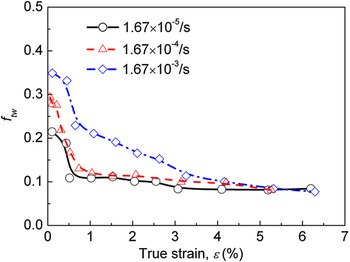
The fraction of anelastic recovery strain by detwinning, f tw, calculated from Eq. (7) is plotted in Fig. 13 for different strain rates. It can be observed that the fractions of anelastic recovery strain by detwinning for the three samples have similar trends: the highest value is observed in the initial deformation stage, and it then decreases greatly. However, the average fraction for the sample at a high strain rate had the highest value. The present results are thought to be related to that for the sample at a high strain rate, as the twinning nucleation rate is increased accordingly, which provides enough “sources” for the detwinning process in the anelastic recovery process.
True strain dependence of f tw at various strain rates.

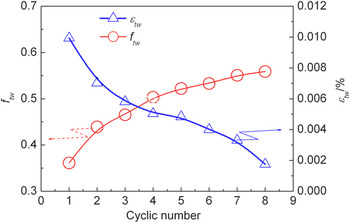
The degradation of anelastic recovery with increasing cycle number, as shown in Fig. 9, is thought to be due to the transition of the detwinning dominant process to a stable state and the exhaustion of dislocations that can move forward and backward during the cyclic process. Furthermore, the plot of ε r and N in Fig. 10, which shows a gradual growth of the slope k with increasing cycle number, demonstrates a gradual increase in f tw, the fraction of anelastic recovery strain by detwinning (Eq. 7). Figure 14 shows that f tw gradually increases from 0.35 to about 0.52 [Eq. (9)], whereas ε tw decreases from 0.011% to about 0.0019% [Eq. (9)] from the first cycle to the eighth cycle. With increasing cycle number, the anelastic recovery strains by both detwinning and dislocation motion decrease gradually. However, twinning seems more unstable than dislocation in resisting the cyclic process. An increase in the fraction of anelastic recovery strain by detwinning was observed, which suggests that anelastic recovery strain by dislocation motion decreases more rapidly than that by detwinning. During the cyclic process, the amount of both dislocations and twinning that can move forward and backward in the corresponding compression and anelastic recovery process, decreased greatly with the increasing cyclic number, with a result that the reloading becomes a more elastic behavior and the corresponding reloading curve becomes more straight [Fig. 9 (a)]. From the fact of the decreasing f tw with increasing cyclic number (Fig. 14), the dislocations seem easier to be stabilized (no recovery anymore) with increasing cycle number from the current results. It has been described previously that the recovery by dislocation motion actually is a kind of thermal-activated process in which the mobile dislocation density decreased with recovery time through their interaction with defects inside the matrix; with the increasing cyclic number at the same strain level of the previous cycle, the dislocation density is considered not to increase significantly, with a result that the entire amount of the dislocations attributed to the anelastic recovery decreased greatly. The detwinning is considered to proceed through the twinning boundary shrinking: once the sample was unloaded, the stress concentration in the vicinity of twinning boundaries is considered to still play an important role as a driving force for the detwinning. In addition, it is well-known that the formation of twinning required much higher stress compared to the basal slipping in pure magnesium.Reference Reed-Hill, Hirth and Rogers14 In the current study, the sample was compressed to a very low strain level, and the dislocations are considered to be almost generated from the basal slipReference Reed-Hill, Hirth and Rogers14, Reference Christian and Mahajan15 resulting in the lower driving force in reversal motion of these dislocations. The different formation mechanisms of both twinning and dislocation from basal slip possibly lead to the higher dynamic driving force for detwinning and lower driving force for the recovery through dislocation, with a result of increase in f tw with increasing cyclic number.
Cyclic number dependence of f tw and ε tw.

V. SUMMARY AND CONCLUSIONS
1. Hysteresis loops for pure magnesium were clearly observed in the cyclic compression process, and it was considered that such hysteresis loops were strongly related to twinning and detwinning in the loading and unloading processes, respectively. A clear separation of anelastic recovery and elastic recovery was obtained by using a high unloading speed.
2. A detwinning model of pure magnesium in a compression–quick unloading–recovery cyclic process was proposed, based on the previous deformation history, and showed to be in agreement with the experimental results.
3. Three anelastic recovery stages were observed for compression to higher strain levels: detwinning (stage I), a dislocation motion dominated recovery process (stage II), and detwinning of other twinning systems (stage III).
4. It was found that the slope k and the grain size d followed the equation k = k 0 − Dd −1/2 in stages I and III, and based on this relation, f tw and f dis were separated for the first time.
5. The values of f tw for samples with different strain rates had similar trends: the highest value was observed in the initial stage of deformation, and the value then decreased greatly. However, the sample at a high strain rate had the highest value.
6. Shrinkage of the hysteresis loops, stress decreases, and decreases in N and ε r were observed in the strain-controlled cyclic process. The value of f tw increased from the first cycle to the eighth cycle although ε tw was observed to decrease greatly with increasing cycle number.