


Introduction
The success of a plant breeding programme depends on the availability of germplasm and the genetic variation that can be exploited from it. The use of modern cultivars in breeding for complex traits becomes limited due to their relatively narrow genetic base (Abdurakhmonov and Abdukarimov, Reference Abdurakhmonov and Abdukarimov2008). In Asian rice (Oryza sativa L.), breeders can assemble a diverse breeding pool composed of landraces, improved lines and modern varieties that are spread across the main variety groups (indica, temperate japonica, tropical japonica, aus and aromatic; Garris et al., Reference Garris, Tai, Coburn, Kresovich and McCouch2005, Zhao et al., Reference Zhao, Tung, Eizenga, Wright, Ali, Price, Norton, Islam, Reynolds, Mezey, McClung, Bustamante and McCouch2011) to capture a wide range of adaptation and overcome the problem of low genetic base.
Rice is cultivated in a wide range of environments, such as irrigated lowland, rainfed lowland, upland, flood-prone (Dixit et al., Reference Dixit, Swamy, Vikram, Ahmed, Sta Cruz, Amante, Atri, Leung and Kumar2012) and aerobic (Zhao et al., Reference Zhao, Atlin, Amante, Sta Cruz and Kumar2010) rice areas. Irrigated lowland rice is grown in puddled soil throughout the cropping season; rainfed lowland rice relies entirely on rainfall or drainage from higher land areas; and, upland rice is grown in unbundled fields where soil drainage and land surface minimize the accumulation of water (Bernier et al., Reference Bernier, Atlin, Serraj, Kumar and Spaner2008). Aerobic rice was more recently developed due to emerging global water scarcity threatening the sustainability of irrigated lowland rice production. Rice for aerobic culture requires high-yielding fertilizer-responsive genotypes incorporated with drought-tolerance traits to adapt to high soil impedance due to aerobic soil conditions (Lafitte and Bennett, Reference Lafitte, Bennett, Bouman, Hengsdijk, Hardy, Bindraban, Tuong and Ladha2002; Zhao et al., Reference Zhao, Atlin, Amante, Sta Cruz and Kumar2010). Diverse breeding materials from these ecosystems were assembled to comprise the drought stress panel (DSP) utilized in this study to serve as germplasm for aerobic adaptation breeding.
The use of molecular markers in agricultural research has encouraged breeding institutions to adopt this technology as an integral part of their breeding programmes (Collard et al., Reference Collard, Jahufer, Brouwer and Pang2005). With the availability of abundant markers, genomic information allows a complementary strategy to using pedigree information for elucidating the nature of a breeding pool. In a diverse germplasm, data from genome-wide markers are useful in diversity analysis, population structure analysis and association studies (Agrama et al., Reference Agrama, Eizenga and Yan2007; Huang et al., Reference Huang, Wei, Sang, Zhao, Feng, Zhao, Li, Zhu, Lu, Zhang, Li, Fan, Guo, Wang, Wang, Deng, Li, Lu, Weng, Liu, Huang, Zhou, Jing, Li, Lin, Buckler, Qian, Zhang, Li and Han2010; Zhao et al., Reference Zhao, Tung, Eizenga, Wright, Ali, Price, Norton, Islam, Reynolds, Mezey, McClung, Bustamante and McCouch2011).
Two of the most promising marker systems, namely simple sequence repeats (SSRs) and single nucleotide polymorphisms (SNPs), have been widely used for genotyping in crops. SNPs have been known to occur in high density across the genome. They are amenable to high-throughput methods and have a simple mutation model. However, SNPs are biallelic and offer low information content (Frascaroli et al., Reference Frascaroli, Schrag and Melchinger2013). SSRs, on the other hand, have high allelic diversity and, in turn, have higher polymorphism rates than SNPs. The concurrent use of these two marker systems having different polymorphism mechanisms will provide results that are complementary to each other (Courtois et al., Reference Courtois, Frouin, Greco, Bruschi, Droc, Hamelin, Ruiz, Clément, Evrard, Coppenole, Katsantonis, Oliveira, Negrão, Matos, Cavigiolo, Lupotto, Piffanelli and Ahmadi2012).
The objectives of the study were to (1) compare the allelic properties of SNP and SSR markers with respect to the DSP, (2) infer population structure of the breeding panel, and (3) estimate kinship among the accessions comprising the panel.
Materials and methods
Rice breeding panel and marker genotyping
The collection of 187 rice accessions used in this study (referred to as DSP) included 141 breeding lines and Philippine-released varieties, 27 local and foreign landraces, and 19 diversity checks. The breeding lines were entries from upland, aerobic, rainfed lowland and irrigated lowland nurseries of the International Network for Genetic Evaluation of Rice (INGER) of the International Rice Research Institute (IRRI). These materials were assembled to serve as breeding germplasm for genetic improvement of rice for adaptation to drought stress in aerobic culture.
Genomic DNA was extracted by the CTAB (cetyltrimethylammonium bromide) method (Murray and Thompson, Reference Murray and Thompson1980) from leaf tissue collected from single plants. For SNP genotyping, 20 μl containing at least 25 ng of DNA were prepared and submitted to the Genotyping Services Laboratory of IRRI in Laguna, Philippines. The RiceOPA3.1 (also known as indica/japonica) SNP set, a multiplex of 384 markers, was used (Thomson et al., Reference Thomson, Zhao, Wright, McNally, Rey, Tung, Reynolds, Scheffler, Eizenga, McCLung, Kim, Ismail, de Ocampo, Mojica, Reveche, Dilla-Ermita, Mauleon, Leung, Bustamante and McCouch2012). After excluding SNP markers with no polymorphism and more than 20% missing data, there remained 373 markers, with an average interval of 1.03 Mb between them.
For the SSR assay, polymerase chain reaction (PCR) was performed in a GeneAmp PCR System 9700 (Applied Biosystems, Foster City, CA, USA) thermocycler. The following temperature profile was used: initial denaturation at 95°C for 9 min, followed by 35 cycles of denaturation at 95°C for 1 min, annealing at 52, 55 or 58°C for 2 min, and extension at 72°C for 2 min, and a final extension at 72°C for 7 min. Each PCR mix (7.5 μl) contained the following: 1.0 μl template DNA; 1.5 μl of 5 × Green GoTaq® Flexi Reaction Buffer (Promega Co., Madison, WI, USA); 0.25 μl of 25 mM MgCl2; 0.4 μl of 5 mM dNTPs; 0.4 μl each of 10 μM forward and reverse primers; 0.2 μl (5 U/μl) of Taq recombinant DNA polymerase (Vivantis, Inc., Oceanside, CA, USA); 3.35 μl water. PCR products were fractionated in 4% (w/v) non-denaturing polyacrylamide gel and visualized by ethidium bromide staining. Bands were scored as codominant alleles. A total of 153 SSR markers were used for genotyping, with an average interval of about 2.5 Mb between markers.
Data analysis
Allele number, allele frequency and polymorphism information content (PIC), which is the proportion of the sum of squared allele frequencies at a marker locus (Anderson et al., Reference Anderson, Churchill, Autrique, Tanksley and Sorrells1993), were calculated using PowerMarker 3.25 (Liu and Muse, Reference Liu and Muse2005). At each SNP and SSR marker locus, whether there were two or more alleles, those that occurred less frequently than the most frequent allele were referred to as minor alleles.
The Bayesian model-based program STRUCTURE 2.3 (Falush et al., Reference Falush, Stephens and Pritchard2003) was used to estimate the number of subpopulations (k) given an admixture model with correlated allele frequencies. Simulations were run for 100,000 burn-in steps and 100,000 main run steps over ten independent iterations. The Delta k statistic of Evanno et al. (Reference Evanno, Regnaut and Goudet2005) was calculated using STRUCTURE HARVESTER (Earl and vonHoldt, Reference Earl and vonHoldt2012). PowerMarker 3.25 (Liu and Muse, Reference Liu and Muse2005) was used to calculate Nei's (Reference Nei and Morton1973) genetic distance and construct neighbour-joining trees (Saitou and Nei, Reference Saitou and Nei1987), which were visualized in MEGA5.2 (Tamura et al., Reference Tamura, Peterson, Peterson, Stecher, Nei and Kumar2011).
Arlequin 3.5 (Excoffier et al., Reference Excoffier, Laval and Schneider2005) was used to perform the analysis of molecular variance (AMOVA) and calculate pairwise genetic distance between subpopulations (Schneider and Excoffier, Reference Schneider and Excoffier1999) denoted as fixation index (F ST). Statistical significance was tested by 1000 permutations. Rice accessions with an ancestry probability of less than 0.60 (according to model-based population structure analysis) were not included. The accessions that rearranged between subpopulations based on SNP data and those based on SSR data were also not included.
Marker-based genetic relatedness was calculated based on the Loiselle et al. (Reference Loiselle, Sork, Nason and Graham1995) formula for kinship (f) using SPAGeDi 1.3 (Hardy and Vekemans, Reference Hardy and Vekemans2002), given allele frequencies specific to the population. Negative estimates between any pair of genotypes, implying that the two were unrelated and with different ancestries (Thornton et al., Reference Thornton, Tang, Hoffman, Ochs-Balcom, Caan and Risch2012), were set to 0. Estimates greater than 1 were set to 1. The minimum kinship coefficient to mean relatedness between any pair of accessions was set to 0.05, i.e. accessions with a kinship coefficient lower than 0.05 were considered unrelated.
Results
Allelic properties of SNP and SSR markers
For the RiceOPA3.1 SNP set, markers that detected only one allele were not included for data analysis, hence the average number of alleles was 2. For the 153 polymorphic SSRs, the number of alleles ranged from 2 to 7 with a mean of 3.47. Most of the markers (i.e. 127 out of 153, or 83%) amplified two to four alleles.
Most of the SNP and SSR alleles tended to occur at low rather than intermediate frequencies, although SSRs were slightly better enriched with intermediate allele frequencies. These low allele frequency levels resulted in frequency distributions that were skewed to the right (Fig. 1). The average minor allele frequency for SNPs was 0.125, compared with 0.148 for SSRs, which was only slightly higher.
Frequency distribution of minor allele frequency and PIC for SNP and SSR markers.

In terms of PIC, the frequency distributions for both SNP and SSR markers were less skewed than that of allele frequency. PIC approximately centred around the mean of 0.17 for SNP markers and around the mean of 0.43 for SSR markers.
Population structure
Mean values of L(k) (i.e. natural logarithm of the posterior probability of k given the data) for k= 1–10, where k was the given number of subpopulations, showed that the increase in L(k) slowed sharply above k= 2, which was also reflected in the very high peak at k= 2 in the Delta k plots. This subdivision corresponds to the very distinct separation between indica and japonica (JA) accessions (Fig. 2). At k= 3, the aus (AU) accessions (representing aus-type rice) differentiated from the rest of the indica accessions for SNPs, whereas a group of upland rice (UL) accessions differentiated from the rest of the indica accessions for SSRs. At k= 4, the UL accessions differentiated from the remaining indica accessions (which were mostly irrigated lowland and rainfed lowland accessions) for SNPs, whereas the AU group diverged from the remaining indica accessions for SSRs. At k= 5, the remaining indica accessions diverged into two groups for both markers, but there was no apparent pattern to this subdivision, as both groups comprised a mixture of mostly rainfed lowland and irrigated lowland accessions. For this reason, the number of biologically plausible subpopulations was set to 4. Because the rainfed lowland and irrigated lowland rice accessions could not be clearly differentiated from each other, the lowland-adapted indica (LL) was a disproportionately large subpopulation, comprising at least 53% of the DSP.
Ancestry probability of 187 rice accessions inferred by STRUCTURE using (a) 373 SNP and (b) 153 SSR markers at k= 2 and k= 4 subpopulations.

Ancestry probability was less than 0.60 for 32 accessions (16 based on SNPs and 21 based on SSRs), which were categorized as having admixed ancestry. Most of these accessions were an admixture of LL and UL ancestries. These were breeding lines developed for upland environments, which were often crosses between tropical japonica genotypes (to impart upland adaptation) and irrigated lowland-adapted lines (to impart high yield potential).
Only one accession was assigned to two different subpopulations depending on the marker type. TCA80-4, a breeding line from Africa, had the following ancestry probabilities: 0.66 LL:0.34 UL based on SNP marker data and 0.39 LL:0.60 UL based on SSR marker data. Apparently, this genotype was a combination of two different genetic backgrounds, but obtained an ancestry probability of at least 0.60 from either marker type such that it was not classified as having an admixed ancestry.
The agreement in subpopulation assignment between SSR and SNP markers was remarkably high. Of the 32 accessions with admixed coancestry between the SNP and SSR markers, five were classified as such by both marker types. From the remaining 155 accessions with an ancestry probability of at least 0.60, only one was rearranged between the two marker types.
Cluster analysis
Except for the difference in resolution in the indica main cluster, the branching patterns between the SNP- and SSR-based neighbour-joining trees were in general agreement with each other (Fig. 3). In both SNP- and SSR-based trees, the indica group (UL and LL) clustered in one direction, whereas the JA (red) accessions were in the opposite direction. It can also be seen in both trees that the UL accessions (orange) separated from the rest of the indica (blue). The AU accessions formed a separate cluster in both trees. In the SNP-based tree, the AU cluster was in the same direction with the indica group, while in the SSR-based tree, it was midway between the indica and JA main branches. Both trees also depicted that there was no apparent structure within the large LL subpopulation.
Neighbour-joining trees of 187 rice accessions based on Nei's (Reference Nei and Morton1973) genetic distance using SNP (top) and SSR marker (bottom) data. The colour of each accession corresponds to subpopulation assignment by STRUCTURE (AU, green; LL, blue; UL, orange; JA, red; admixed ancestry, grey).

In general, the major clusters of the neighbour-joining trees (Fig. 3) agreed with the subpopulations based on model-based groups. Some of the LL accessions were interspersed in some of the predominantly UL branches, and vice versa. Admixed ancestry rice accessions were mostly interspersed with the UL accessions, and some may be found along the juncture between the indica and JA subdivision, and among the LL accessions.
Genetic differentiation among subpopulations
The eight accessions that were rearranged between the subpopulations based on SNP and SSR data were not included in the population differentiation analysis. The 32 accessions with admixed ancestry (16 based on SNP data and 21 based on SSR data) were also not included. In total, there were 33 accessions that were either rearranged or had admixed ancestry, leaving 154 accessions across four subpopulations (AU, LL, UL and JA) that were analysed for population differentiation.
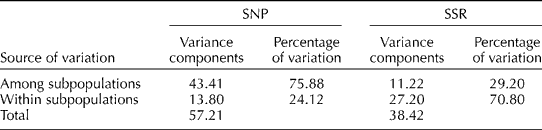
The results of the AMOVA of the SNP data showed that most of the molecular diversity in the panel was due to variation among subpopulations (75.9%), and only about one-quarter was due to the variation within the subpopulations (Table 1). The overall F ST among the model-based groups was 0.7588, implying a relatively high level of differentiation. Except for the LL and UL subpopulations, which had a relatively low F ST (0.2773), the subpopulations were highly differentiated from each other, with pairwise F ST ranging from 0.7097 to 0.8580 (Table 2).
Analysis of molecular variance of SNP and SSR marker data
Pairwise F ST based on SNP (below diagonal) and SSR markers (above diagonal) among the four subpopulationsa
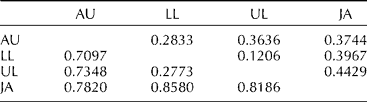
a All estimates were significant (P< 0.001) based on 1000 permutations.
The overall F ST based on SSR data was much lower (F ST= 0.2920), and the results of AMOVA showed a reversed trend: molecular diversity due to the variation among the subpopulations (29.2%) was lower than the within-subpopulation variation (70.8%). In other words, according to the information obtained by the SSR assay, the main indica and JA groups were individually more diverse than the SNP assay would suggest.
The levels of genetic differentiation among the model-based subpopulations were lower for SSRs than for SNPs. Pairwise F ST ranged from 0.1206 to 0.4429. The lowest F ST was observed between the LL and UL subpopulations, as what was observed in the SNP-based F ST. The lowest level of differentiation being observed between the LL and UL subpopulations (for both SNP and SSR markers) was apparently because most of the accessions belonging to these subpopulations were interrelated, as they were breeding lines developed from inter-crosses between the irrigated lowland, rainfed lowland and upland-adapted genotypes.
Kinship
Marker-based kinship (f) estimates in the DSP were mostly less than 0.05, and pairs of accessions with such kinship coefficient were considered unrelated. For related accessions, the mean kinship was 0.160 based on SNP data, and 0.187 based on SSR data. In other words, kinship estimates for the most part were very close to 0 (Fig. 4, top), implying that the degree of genetic relatedness in the DSP was generally low.
Kinship (f) based on the Loiselle et al. (1995) formula. Top: frequency distributions of kinship estimates among related (i.e. f≥ 0.05) accessions based on the SNP (left) and SSR (right) markers. Bottom: kinship matrices based on the SNP (left) and SSR (right) markers. Accessions are arranged according to model-based subpopulation assignment.

The relatedness between rice accessions was apparent within the subpopulations, especially in the AU and JA subpopulations where mean kinship was high (0.598 based on SNP data and 0.469 based on SSR data). This high level of kinship was also depicted by the deep red boxes on the heat map corresponding to the AU and JA subpopulations (Fig. 4, bottom). However, these two subpopulations represented only a small proportion (17%) of the whole panel.
There was some degree of inter-relatedness between the members of the LL and UL subpopulations, and between those of the AU and JA subpopulations, as indicated by the faint red boxes between the subpopulations in Fig. 4. The genetic relatedness between the members of the LL and UL subpopulations corroborated the relatively lower degree of genetic differentiation between these two subpopulations, as shown in Table 2.
Pearson's correlation between pairwise kinship based on SNP and SSR markers was moderately high (r= 0.78, P< 0.001), implying a general agreement between, and the suitability of the Loiselle et al. (Reference Loiselle, Sork, Nason and Graham1995) formula to, the two marker types. Yu et al. (Reference Yu, Zhang, Zhu, Tabanao, Pressoir, Tuinstra, Kresovich, Todhunter and Buckler2009) preferred this formula because it does not assume Hardy–Weinberg equilibrium, a prerequisite that cannot be assumed in the DSP as well. In Fig. 4, a similar pattern could be observed in the heat maps of kinship based on SNP and SSR markers. Studies from other crops also showed general agreement between SNP- and SSR-based genetic diversity estimates (Van Inghelandt et al., Reference Van Inghelandt, Melchinger, Lebreton and Stich2010; Yang et al., Reference Yang, Xu, Shah, Li, Han, Li and Yan2011; Würschum et al., Reference Würschum, Langer, Longin, Korzun, Akhunov, Ebmeyer, Schachschneider, Schacht, Kazman and Reif2013).
Discussion
Genetic diversity and population structure
The use of two independent marker systems, namely SSRs and SNPs, successfully characterized the genetic diversity and population structure of the DSP. The allele frequencies in the panel were found to be low in both marker types. In maize, allele frequencies of SNPs were reported to be distributed evenly from 0 to 0.5 in improved lines and cultivars (Hamblin et al., Reference Hamblin, Warburton and Buckler2007; Yang et al., Reference Yang, Xu, Shah, Li, Han, Li and Yan2011). The same observation was reported for the self-pollinated crop wheat (Würschum et al., Reference Würschum, Langer, Longin, Korzun, Akhunov, Ebmeyer, Schachschneider, Schacht, Kazman and Reif2013). In the present study, the population contained some genotypes that were either landraces or improved non-indica accessions, which may carry alleles throughout the genome that were not in common with the rest of the accessions. The outcome would be an excess of low-frequency alleles even for biallelic SNP markers. Consequently, PIC values were generally lower than what have been previously reported because of the composition of the panel, being mostly improved lines and cultivars with some landraces. For SSR markers, PIC would tend to be not lower than 0.50 when the sample of genotypes is composed mostly of landraces (Garris et al., Reference Garris, Tai, Coburn, Kresovich and McCouch2005; Ram et al., Reference Ram, Thiruvengadam and Vinod2007; Pervaiz et al., Reference Pervaiz, Rabbani, Pearce and Malik2009). PIC takes into account not only the number of alleles, but also their frequencies. If many alleles are present only in low frequencies, as was the case in the DSP, the PIC is not expected to be high.
In general, the major clusters of neighbour-joining trees agreed with the subpopulations based on model-based grouping. The breeding panel was structured into JA, AU, UL and LL. When global diversity is considered, the number of known subpopulations is 5, representing the five main variety groups of Asian rice: indica; tropical japonica; temperate japonica; AU; aromatic (Garris et al., Reference Garris, Tai, Coburn, Kresovich and McCouch2005; Zhao et al., Reference Zhao, Tung, Eizenga, Wright, Ali, Price, Norton, Islam, Reynolds, Mezey, McClung, Bustamante and McCouch2011). In contrast, the DSP did not represent global diversity, hence the observed clustering did not correspond to the five known variety groups.
The results of AMOVA showed a reversed trend between the SNP and SSR markers. SNP data showed that most of the molecular diversity in the panel was due to the variation among the subpopulations, while SSR data showed that the within-subpopulation variation was higher than the among-subpopulation variation. One explanation is the way the RiceOPA3.1 SNP set was designed, which was to differentiate indica from JA genotypes, such that the emphasis was variation between, and not within, the two groups. Another reason is the difference in the basis of polymorphism between the two marker types. Single-base changes occur much more slowly through time, reflecting deeper variation between genotypes. In contrast, SSRs, which are due to polymerase slippage, have a higher mutation rate (Hamblin et al., Reference Hamblin, Warburton and Buckler2007) and therefore reflect more recent variation in DNA.
Kinship estimates were generally low. Genetic relatedness estimates between accessions were higher within, than across, the subpopulations. There was some degree of inter-relatedness between the members of the LL and UL subpopulations, which corroborated the relatively lower degree of genetic differentiation between these two subpopulations. The lack of inter-relatedness among the accessions from different subpopulations (such as between the LL and JA groups) was also observed. These observations highlighted the difference between kinship and population structure. Familial relatedness is significant only in recent generations, whereas population structure is due to ancestry differences that have developed through long evolutionary time (Yu et al., Reference Yu, Pressoir, Briggs, Bi, amasaki, Doebley, McMullen, Gaut, Nielsen, Holland, Kresovich and Buckler2005). Genetic relatedness within the LL and UL subpopulations was observed to be low, implying that these breeding lines were genetically diverse, and that there is much opportunity for genetic improvement. The development of advanced cycle inbreds by crossing elite by elite lines in pedigree breeding is one of the reasons for genetic gain to decline over time. As for the LL and UL accessions in this breeding panel, loss of variation is not a problem as yet. Thus, the immediate breeding strategy is to focus on improving the mean by crossing the improved indica lines within the LL or UL subpopulations, and to tap into the exotic alleles of the AU and JA subpopulations later, when genetic gain declines.
SSR markers, being often able to detect more than two alleles, provide more information than do SNP markers. Hamblin et al. (Reference Hamblin, Warburton and Buckler2007) compared 847 SNP with 89 SSR markers in terms of assigning maize inbreds to subpopulations, and concluded that the small number of SSR markers exhibited higher discriminatory power over the biallelic SNP markers. Van Inghelandt et al. (Reference Van Inghelandt, Melchinger, Lebreton and Stich2010) concluded that there should be seven to ten times more SNP markers to achieve the precision of SSR markers in the analysis of genetic diversity and population structure in maize. In the present study, the RiceOPA3.1 SNP set seemed to have provided the same degree of efficiency as the 153 SSRs in assigning traditional and improved accessions into different subpopulations and in determining their genetic relatedness. The two marker types complemented each other in assessing the variation between and within subpopulations (i.e. genetic differentiation between subpopulations).
Upland rice in improved genetic background
The results from the use of both SNP and SSR markers pointed to the formation of the UL subpopulation, which was distinct from, but which seemed to be an intermediate group between, the LL and JA subpopulations. Traditional rice varieties that are adapted to upland culture are mostly tropical japonica (Garris et al., Reference Garris, Tai, Coburn, Kresovich and McCouch2005; Atlin et al., Reference Atlin, Lafitte, Tao, Laza, Amante and Courtois2006); however, UL accessions in this study were found to be closer to the indica group than to the JA group. In fact, in the Bayesian model-based clustering, UL accessions belonged to the indica group, not to the JA group, when the number of subpopulations was set to 2. Whereas UL accessions have the adaptation to upland environments as JA accessions generally do, their yielding ability and plant stature are more similar to those of improved accessions belonging to LL. In other words, UL accessions are upland-adapted genotypes in a modern genetic background as a result of varietal improvement.
Zhao et al. (Reference Zhao, Atlin, Amante, Sta Cruz and Kumar2010) reported a new production system that grows rice in non-puddled aerobic soils (i.e. upland environment), but which utilizes a different set of varieties called aerobic rice. Such genotypes are a product of breeding that utilizes traditional upland varieties, to confer drought tolerance, and modern irrigated lowland-adapted rice varieties, which are high yielding and input-responsive. This has been the strategy employed by breeding programmes to improve the productivity of uplands. Bernier et al. (Reference Bernier, Kumar, Venuprasad, Spaner and Atlin2007) and Venuprasad et al. (Reference Venuprasad, Bool, Quiatchon and Atlin2012) also reported aerobic breeding efforts that concentrated on identifying quantitative trait loci from upland-adapted entries in semi-dwarf, high-yielding indica backgrounds. In this study, the 32 accessions that were considered admixed (i.e. ancestry probability < 0.60) became as such because they were also mostly an admixture of LL and UL ancestries. Indeed, based on cluster analysis, they tended to intersperse with UL accessions, as shown in Fig. 3. The separation of UL accessions pointed to the formation of a new group and the admixed accessions could represent breeding materials that were transitioning to UL. Previous studies (Garris et al., Reference Garris, Tai, Coburn, Kresovich and McCouch2005; Lu et al., Reference Lu, Redus, Coburn, Rutger, McCouch and Tai2005; Giarocco et al., Reference Giarocco, Marassi and Salerno2007) attributed genetic structure in different panels of rice accessions to domestication events. In this study, genetic structure, particularly for UL accessions, was found to be a result of modern breeding. Courtois et al. (Reference Courtois, Frouin, Greco, Bruschi, Droc, Hamelin, Ruiz, Clément, Evrard, Coppenole, Katsantonis, Oliveira, Negrão, Matos, Cavigiolo, Lupotto, Piffanelli and Ahmadi2012) and Shinada et al. (Reference Shinada, Yamamoto, Yamamoto, Hori, Yonemaru, Matsuba and Fujino2014) similarly found that plant breeding programmes have led to the formation of new genotypes with a unique morphology and ecosystem-specific adaptation. The analysis of genome-wide genotype data affords the profound understanding of genetic variation to guide the conceptualization and realization of breeding strategies for adaptation to less favourable environments, such as drought-prone and aerobic rice areas.
Supplementary material
To view supplementary material for this article, please visit http://dx.doi.org/10.1017/S1479262114000884
Acknowledgements
This study was funded by the Philippine Government through the Philippine Rice Research Institute and the Department of Agriculture National Rice Program.



