

Endscrapers, common in Paleolithic and Paleoindian assemblages, are analyzed for their raw materials, technology of production, retouch, and wear on margins and faces as evidence of hafting and use. Increasingly, endscrapers also are studied for the factors and processes by which they enter the archaeological record, particularly how their size and form reveal use life and the allometric change they experienced between first use and discard (e.g., Morales Reference Morales2016). Use life can be as important a functional attribute of tools as the form, angle, and retouch technology of their used edge.
Assemblage formation addresses “the very general problem of what exactly leads to discard. . .which, although it might seem an obvious and fundamental question in archaeology has largely been ducked” (Gamble Reference Gamble1986:275). One solution to ducking starts from the observation that in retouched tools such as endscrapers, use life is partly a function of the degree and pattern of retouch during use, whether to rejuvenate dulled edges or to repair damaged ones.
Size and form of tools at discard are matters of archaeological observation. Original size and form, however, are observable only if tools experienced little or no resharpening. Both their technology of production and their use suggest that Paleoindian endscrapers experienced considerable retouch during their use lives (e.g., Rule and Evans Reference Rule, Evans and McNett1985; Seeman et al. Reference Seeman, Summers, Morris, Dowd and Barans2001; Shott Reference Shott1995), a judgment that ethnoarchaeology (e.g., Sahle et al. Reference Sahle, Negash and Braun2012; Sahle and Negash Reference Sahle and Negash2016; Weedman Reference Weedman2000) and experiments (Bohush Reference Bohush2013; Giner and Sacchi Reference Giner and Sacchi1994; Morrow Reference Morrow1997; Pelton and Boyd Reference Pelton and Boyd2015; Seeman et al. Reference Seeman, Loebel, Comstock and Summers2013) corroborate. For most endscrapers, therefore, size and form at first use and at discard differ in pattern and degree that are directly proportional to retouch (Eren Reference Eren2013; Seeman et al. Reference Seeman, Loebel, Comstock and Summers2013; Shott and Weedman Reference Shott and Weedman2007:1028).
Curation and Reduction in Stone Tools
Tools may preserve evidence at discard from which original size and form may be inferred, depending on the technology of their blanks and the allometric relationships that reside in degree and patterning retouch that they have experienced. These relationships, which change tools’ form as size reduces, are important to measure for several reasons. Change in tool form has typological implications (Dibble Reference Dibble1987; Hoffman Reference Hoffman and Carr1985; Iovita Reference Iovita2011). Pattern and especially degree of change correlate with duration of use (Dibble Reference Dibble1987; Shott Reference Shott1995), thus comprising measures of use life. Use life is good to know for its own sake, as perhaps a design attribute of tools (e.g., Beck Reference Beck, Ramenofsky and Steffen1998; Iovita Reference Iovita, Lycett and Chauhan2010), in behavioral models of tool design and use (e.g., Kuhn Reference Kuhn1994; Kuhn and Miller Reference Kuhn, Miller, Goodale and Andrefsky2015), and to tease out occupation modes and spans in time-averaged accumulations (Morales Reference Morales2016:235–236; Surovell Reference Surovell2009:191–200; Ugan et al. Reference Ugan, Bright and Rogers2003). Use life also affects the rate at which tools are discarded and thereby influences assemblage size and composition (Ammerman and Feldman Reference Ammerman and Feldman1974; Cowgill Reference Cowgill, Leonard and Jones1989; Shott Reference Shott2010).
In retouched tools, allometry's most important implication concerns curation, defined here as the amount of utility extracted from a tool compared to the maximum amount possible (Andrefsky Reference Andrefsky2009:71; Kilby Reference Kilby2008:134; Kuhn Reference Kuhn1994; Shott Reference Shott1996). All else being equal, tools are more curated the more that realized utility approaches maximum utility (Shott and Sillitoe Reference Shott and Sillitoe2004). Curation registers in the design and use of tools and influences the size and composition of the assemblages that result from their use and discard (e.g., Cornejo and Galarce Reference Cornejo, Luis and Patricio2010; Shott Reference Shott2010). Surovell (Reference Surovell2009:60–109) demonstrated curation's importance to the formulation and testing of models of behavior and assemblage formation, the latter to disentangle the complex relationships between occupation span and site contents. Curation is a continuous variable that characterizes each tool and assemblage, not a categorical one that either occurs or does not, and is good to know for reasons both practical and theoretical.
Methods to Estimate Original Size
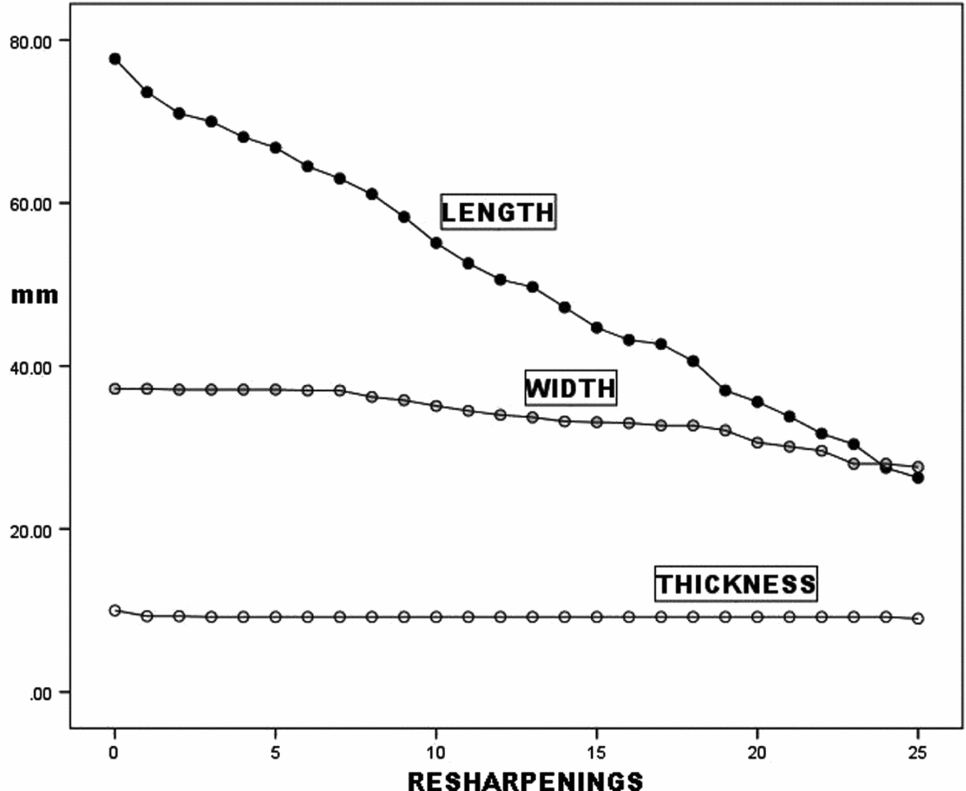
Endscrapers are a suitable subject for reduction analysis, experiencing resharpening chiefly on their bits, which results in disproportionate reduction in length compared to other dimensions (Daniel et al. Reference Daniel, Moore and Pritchard2007:79; Morales Reference Morales2016:234; Morrow Reference Morrow1997; Sahle and Negash Reference Sahle and Negash2016:Table 1; Shott and Weedman Reference Shott and Weedman2007). Bearing in mind that original design and patterns of retouch make different measures more or less suitable for different tool types and analytical purposes, the estimation of original size from reduced size uses several properties of tools, including the cross-sectional geometry of retouched flakes (e.g., Brumm and McLaren Reference Brumm and McLaren2011; Clarkson Reference Clarkson2002a; Eren et al. Reference Eren, Dominguez-Rodrigo, Kuhn, Adler, Le and Bar-Yosef2005; Eren and Prendergast Reference Eren, Prendergast and Andrefsky2007; Goodale et al. Reference Goodale, Otis, Andrefsky, Kuijt, Finlayson and Bart2010; Hiscock and Clarkson Reference Hiscock and Clarkson2005; Kuhn Reference Kuhn1990; Méndez et al. Reference Méndez, Blanco, Quemada, Oliva, de Grandis and Rodrigúez2007:591–592; Morales Reference Morales2016:234), degree and extent of retouch invasiveness (e.g., Andrefsky Reference Andrefsky2006; Clarkson Reference Clarkson2002b; Li et al. Reference Li, Kuman and Li2015), and reduction allometry (e.g., Blades Reference Blades2003; Braun Reference Braun2005; Cardillo and Charlin Reference Cardillo and Charlin2009; Goldstein Reference Goldstein2014; Iriarte Reference Iriarte, Consens, Mazz and Curbelo1995; Lerner Reference Lerner and Shott2015; Quinn et al. Reference Quinn, Andrefsky, Kuijt, Finlayson and Andrefsky2008; Seeman et al. Reference Seeman, Loebel, Comstock and Summers2013:Figure 10; Shipton and Clarkson Reference Shipton and Clarkson2015). Allometric reduction variation is demonstrated in the steady decline in endscraper length while width and especially thickness remain more constant, a pattern found in both experimental (Bohush Reference Bohush2013: Appendix B; Morrow Reference Morrow1997; Sahle and Negash Reference Sahle and Negash2016:Table 1; Figure 1) and empirical (Eren Reference Eren2013:Figure 7) data. Such an allometric pattern should also register in ratios of estimated original to final mass, volume, or length, or of length to thickness.
Reduction of length, width, and thickness by resharpening episode in an experimental endscraper, showing allometry by disproportionate reduction of length, particularly in relation to thickness. Source: Morrow (Reference Morrow1997:Table 1).

Analysts have estimated original size from thickness (Blades Reference Blades2003:147; Eren Reference Eren2013; Goldstein Reference Goldstein2014:11–12; Kilby Reference Kilby2008:137; Quinn et al. Reference Quinn, Andrefsky, Kuijt, Finlayson and Andrefsky2008:164–166) and platform size (Davis and Shea Reference Davis and Shea1998; Dibble Reference Dibble1997:154; Dibble and Rezek Reference Dibble and Rezek2009; Dogandžić et al. Reference Dogandžić, Braun and McPherron2015; Pelcin Reference Pelcin1996; Shott et al. Reference Shott, Bradbury, Carr and Odell2000; Wilson Reference Wilson2007; Wilson and Andrefsky Reference Wilson, Andrefsky and Andrefsky2008) in order to measure allometry. Empirical data on original size, for example from caches of unused blanks (e.g., Bement Reference Bement, Bruce and Kilby2014) and ethnoarchaeological sources (e.g., Sahle and Negash Reference Sahle and Negash2016; Sahle et al. Reference Sahle, Negash and Braun2012; Shott Reference Shott1995; Shott and Weedman Reference Shott and Weedman2007; Weedman Reference Weedman2000), can gauge degree of reduction. Such data sources are uncommon and not necessarily representative (Skov Reference Skov2012:67). Another source comes from relevant experiments (e.g., Bohush Reference Bohush2013; Morrow Reference Morrow1997).
Evaluation Criteria for Estimates of Original Size
Development of a range of reduction measures indicates an active field. Yet diversity creates its own problems, not least the lack of comparability between measures, which complicates comparison between studies, and limited testing of most measures (Eren and Prendergast Reference Eren, Prendergast and Andrefsky2007; Hiscock and Tabrett Reference Hiscock and Tabrett2010; Shott Reference Shott, Clarkson and Lamb2005). No single measure is apt to be best for all purposes. Fortunately, criteria by which to evaluate reduction measures exist. With particular reference to flake tools but worth applying to endscrapers and other hafted tools, Hiscock and Tabrett (Reference Hiscock and Tabrett2010:549–551) proposed inferential power, directionality, comprehensiveness, sensitivity, versatility, and scale-independence.
“Inferential power” is measured by significant relationships between degree of reduction, determined experimentally or by inference, and measures of that reduction. “Directionality” is simply the requirement that reduction measures continue to increase, monotonically or otherwise, with increasing reduction. “Comprehensiveness” denotes a measure's ability to track reduction across its full range, not just early, intermediate, or late stages. “Sensitivity” refers to proportionality between variation in reduction and its measure. A measure that applies equally to retouch type and pattern, blank morphology, edge morphology, thickness, and angle, is “versatile.” “Scale-independence” returns values for reduction independent of specimen size. On experimental and inferential grounds, Hiscock and Tabrett (Reference Hiscock and Tabrett2010:557–559) evaluated several flake-blank or uniface reduction measures against these criteria in experimental biface data.
Many curation studies involve only a single measure of reduction, understandable and valid at early stages of research. By now, though, the diversity of measures demands their comparison and evaluation. Here, we compare several allometric measures that relate size-invariant characteristics of flake blanks to size-varying ones. We identify characteristics correlated with original size of flake blanks measured as mass (Clarkson and Hiscock Reference Clarkson and Hiscock2011; Dogandžić et al. Reference Dogandžić, Braun and McPherron2015; Shott et al. Reference Shott, Bradbury, Carr and Odell2000), volume (Patten Reference Patten2005:165), length (Goldstein Reference Goldstein2014), and thickness (Morrow Reference Morrow1997). We use values of these characteristics to estimate original size of Paleoindian endscrapers. Then we compare directly observable size at discard to estimated original measures. In the process, we evaluate measures for their adherence to common scales and parameter values in model-fitting and test them against performance criteria for such measures.
Nobles Pond
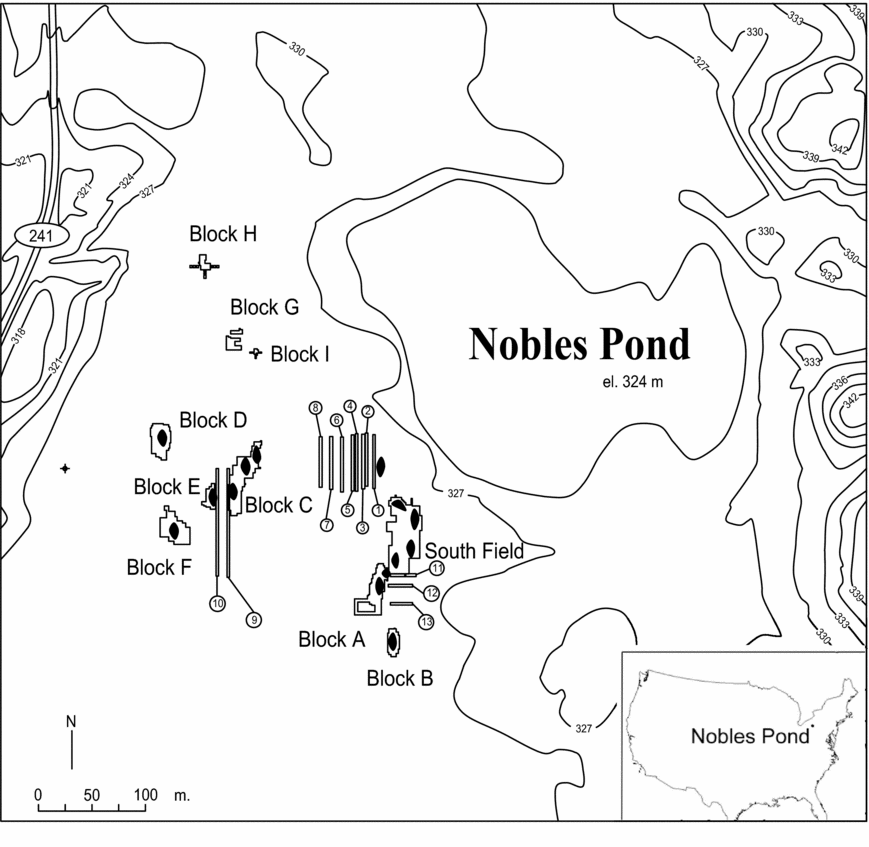
Nobles Pond (33ST357) is among the largest and best-documented early Paleoindian assemblages in eastern North America. Located in northeastern Ohio, USA (Figure 2), the site was discovered by Garry Summers and extensively excavated under Seeman's direction. Nobles Pond has been analyzed for refitting (Seeman et al. Reference Seeman, Summers, Dowd, Morris and Dancey1994), spatial structure (Seeman Reference Seeman1994), biface design (Morris et al. Reference Morris, Seeman, Summers, Dowd, Szafranski, Barans and Nilsson1999), ongoing morphometric and residue study of tools (Seeman Reference Seeman and Lepper2005; Seeman et al. Reference Seeman, Nilsson, Summers, Morris, Barans, Dowd and Newman2008, Reference Seeman, Loebel, Comstock and Summers2013), and broad interpretation (Seeman et al. Reference Seeman, Summers, Dowd, Morris and Dancey1994). In an earlier study (Shott and Seeman Reference Shott and Seeman2015), we applied a single reduction measure to the same sample used here. Here we derive four reduction measures, all different from the one we defined previously. The goal is to evaluate and compare several reduction measures applied to the same assemblage. In the process, we apply a method to reconcile measures by weighting them in proportion to their conformity to the major dimension of variation among them.
Location of the Nobles Pond site.

Nobles Pond endscrapers were made from block-core or biface-core blanks mostly of relatively fine-grained Upper Mercer or Flint Ridge chert (Seeman Reference Seeman and Lepper2005). Block-core blanks usually have flat (single-facet) platforms, subparallel sides, triangular or trapezoidal cross-sections, and slight longitudinal curvature. Biface-core blanks tend to have faceted platforms, sub-parallel or convex sides (in particular, margins may expand somewhat directly below the platform), and somewhat greater longitudinal curvature. Their extensive use-wear analysis led Seeman et al. (Reference Seeman, Loebel, Comstock and Summers2013:426) to conclude that despite variation in size and form virtually all endscrapers were used in early stage hideworking. Similar functional specificity is reported in other Paleoindian assemblages (Loebel Reference Loebel and Gingerich2013; Muñiz Reference Muñiz, Larson, Kornfeld and Frison2009:213), although considerable functional variation occurred in a small endscraper assemblage from a nearby Paleoindian site (Miller Reference Miller2013:Table 2). Nor is a change in worked material with tool reduction and increasing working edge-angle evident at Nobles Pond.
Endscrapers were extensively resharpened from the interior face to produce a beveled edge, usually at the distal end of the original blank. They also may bear lateral chipping, or bulbar or exterior-face thinning at the end opposite the bit (working edge), to facilitate hafting. Ethnoarchaeological and archaeological sources indicate that endscrapers were hafted, often in socketed hafts (e.g., Nissen and Dittemore Reference Nissen and Dittemore1974; Sahle et al. Reference Sahle, Negash and Braun2012; Weedman Reference Weedman2000) for use in various stages of hideworking.
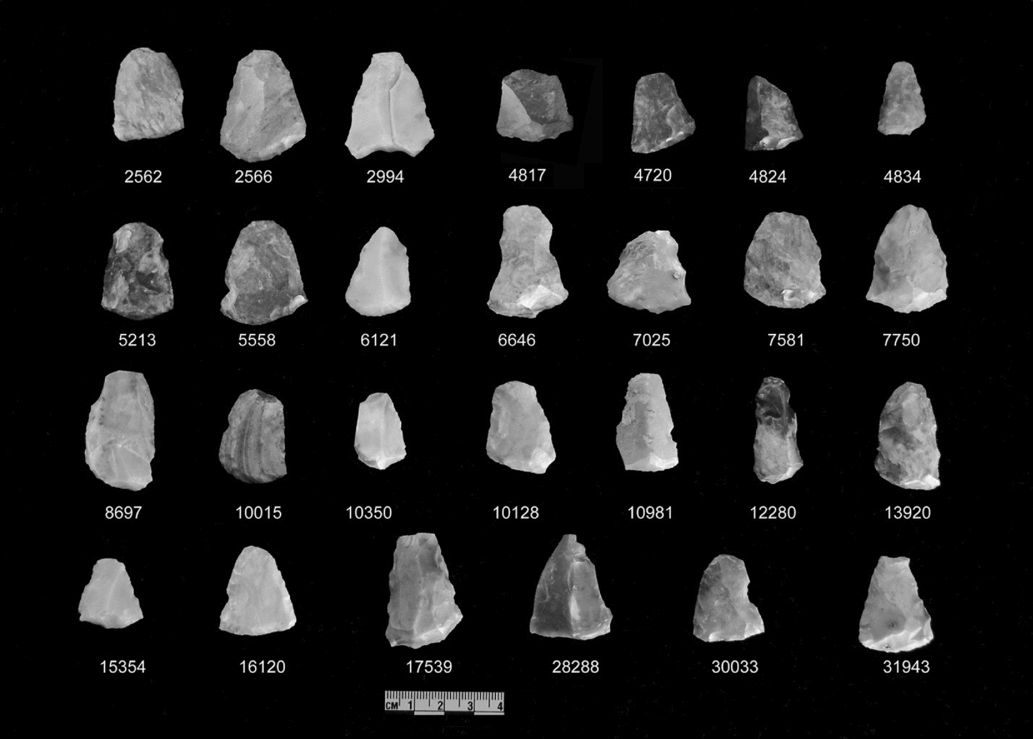
For this pilot study, Seeman selected 27 complete Nobles Pond endscrapers (Figure 3). Because the sample was drawn with the original purpose of applying Clarkson and Hiscock's (Reference Clarkson and Hiscock2011) mass estimate from platform area, the specimens had to retain the platform. Specimens were chosen to roughly span the range of morphological and technological variation in Nobles Pond's platform-bearing endscrapers (platforms of two specimens were somewhat attrited and difficult to measure; as a result, sample size is 25). Some specimens bore evidence of marginal or basal retouch for hafting. We cannot know how much if any retouch and therefore length reduction the working (usually distal) edge experienced or how much mass reduction the blank experienced before first use, but we use experimental data when available to estimate these quantities. We make no claim that 25 tools are representative of a large assemblage in all respects. But this study's purpose is to test the performance and correspondence among a set of reduction measures applied to the same specimens, not to characterize the Nobles Pond endscraper assemblage.
Analyzed sample of Nobles Pond endscrapers.

Background to Analysis
Before estimating the original size of reduced archaeological specimens, it seems wise to consult archaeological and ethnoarchaeological sources for direct evidence. Broadly, Nobles Pond endscrapers are similar in technology, form, and dimensions to other Paleoindian or early Holocene assemblages (e.g., Collins and Byrd Reference Collins and Byrd1994; Daniel Reference Daniel1998; Ellis and Deller Reference Ellis and Deller2000; Marshall Reference Marshall and McNett1985; Morrow Reference Morrow1996; Lothrop Reference Lothrop1988; Rule and Evans Reference Rule, Evans and McNett1985). Few archaeologists have compared endscraper assemblages, so the degree of similarity in discarded endscraper characteristics is poorly known; also, few have analyzed endscapers to estimate original size and form. The empirical parameters of endscraper reduction must come from comparable archaeological data, Paleoindian endscraper blanks, or ethnoarchaeological sources that document first to last use. Limited Paleoindian data suggest reduction rates that range from 40–70% of original length (Grimes and Grimes Reference Grimes and Grimes1985; Shott Reference Shott1995:61–63; Walthall and Holley Reference Walthall and Holley1997:Table 1).
Similarly, Morrow (Reference Morrow1997:Table 4; Figure 1 here) reported changes in dimensions of an experimental Paleoindian endscraper that were similar to Nobles Pond specimens. Although this tool closely resembles Nobles Pond and other midcontinental Paleoindian endscrapers, in the context of this pilot study technological or metric similarity is less important than the control that the experiment provides. Through 25 resharpenings, the specimen was reduced in length from 77.7 to 26.3 mm, similar to Grimes and Grimes's (Reference Grimes and Grimes1985) estimate for flakeshavers. As thickness remained essentially constant, its length:thickness ratio fell, from 7.77 to 2.92, a range that encompasses the same ratio in used Lembke Cache endscrapers (Walthall and Holley Reference Walthall and Holley1997:Table 1).
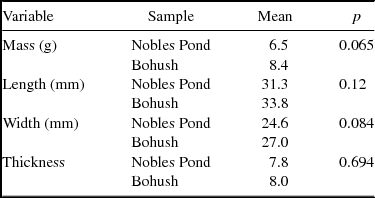
Bohush (Reference Bohush2013:Appendix A1, A3, A5) analyzed experimental endscrapers designed to emulate Nobles Pond specimens, reporting, as above, much greater reduction by resharpening in length than in thickness. From flake blank to discarded specimen, length declined from a mean of 62.1 mm to 33.8 mm, mass from 19.1 g to 8.4 g, somewhat less at both extremes of the length range from Bull Brook flakeshavers and Morrow's experimental data. In major dimensions, our Nobles Pond sample does not differ significantly from Bohush's replicas at discard (Table 1), with a difference in mass approaching conventional significance levels, Nobles Pond specimens being lighter. Bohush also reported dimensions of experimental specimens at first use, after undergoing retouch and reduction to prepare bits for use and butts for hafting.
Mean Dimensions of Nobles Pond and Bohush Experimental Endscrapers.

Note: Sample sizes: Nobles Pond = 27, Bohush = 12.
Clearly, there is allometric variation in endscrapers because of curation. Yet the range of variation in original size form and degree of reduction invites free selection among values. Estimates of original size are required.
Materials and Methods
Most endscrapers are resharpened at their distal margin; like pencils (Shott Reference Shott, Clarkson and Lamb2005), their reduction in use affects length and, correspondingly, aggregate size measures like volume and mass more than it affects other major dimensions (Figure 1). Accordingly, we estimated original mass, volume, length, and length:thickness ratio (LT) of Nobles Pond endscrapers, and measured changing allometry and proportions as ratios of discarded to original quantities. Mass and volume are three-dimensional measures; LT is obviously a ratio of two dimensions; length is one-dimensional. Thus, we can estimate degree of reduction and curation in four ways and three dimensions, compare resulting measures, fit them separately to governing models, and evaluate them against interpretive criteria for model parameters (Hiscock and Tabrett Reference Hiscock and Tabrett2010).
Estimated Reduction in Mass
Experimental studies expressed mass as arithmetic or power functions of flake attributes such as platform size and exterior platform angle. We attempted to estimate original mass from platform area (Dibble Reference Dibble1997). Previous studies (e.g., Davis and Shea Reference Davis and Shea1998) revealed robust but imperfect patterning between platform size and flake size partly because area of irregular objects like platforms was approximated as the product of length and width (Cadieux Reference Cadieux2013:61; Dogandžić et al. Reference Dogandžić, Braun and McPherron2015:Table 2; Shott et al. Reference Shott, Bradbury, Carr and Odell2000:881). Three-dimensional (3D) scanning of platforms might at once increase the precision and reduce the error of measurement.
We wished to test Clarkson and Hiscock's (Reference Clarkson and Hiscock2011) predictive equations that estimate original flake-blank size from platform area and exterior platform angle (EPA), so we laser-scanned specimens to produce precise measurements of platform area (Supplemental Figure 1). Unfortunately, their data, graciously made available, involved a considerably wider range of platform area than Nobles Pond; over 70% (excluding small focalized platforms, not found at Nobles Pond) exceeded the highest Nobles Pond value of 80.9 mm2, so we were unable to use acceptable predictive equations; for instance, 10 of 25 Nobles Pond estimates of original mass were less than observed mass of discarded specimens. Neither did Muller and Clarkson's (Reference Muller and Clarkson2014:33, fn. 1, Table 3) reanalysis of Clarkson and Hiscock's (2010) dataset yield suitable estimates for Nobles Pond, as it expressed platform area as a function of original mass whereas original mass is the target, not the basis, of estimation here (see Supplementary Text for details).
Research on platform allometry reports statistically robust correlations between platform area and measures of flake size but with estimates for individual specimens that sometimes differed substantially from empirical values (Davis and Shea Reference Davis and Shea1998:607; Morales, Lorenzo, and Vergès Reference Morales, Lorenzo and Vergès2015:Figure 1; Shott et al. Reference Shott, Bradbury, Carr and Odell2000:880; Wilson and Andrefsky Reference Wilson, Andrefsky and Andrefsky2008:91). In controlled experiments, flake mass rose faster with platform size as EPA increased (Dibble and Rezek Reference Dibble and Rezek2009:Figure 6), suggesting nonlinear interaction effects.
Therefore, we analyzed the products of “freehand, hard hammer percussion” in Dogandžić and colleagues’ (Reference Dogandžić, Braun and McPherron2015:8) flint experimental data. We regressed ln_mass upon ln_flake-thickness (in mm), ln_platform area (platform area in mm2, estimated as the product of platform width and platform thickness, which, as in previous research [e.g., Shott et al. Reference Shott, Bradbury, Carr and Odell2000], introduces some error), and EPA. Using stepwise entry (probability of F-to-enter ≤ 0.05 and probability of F-to-remove ≥ 0.10), only ln_flake-thickness entered the equation (r2 = 0.68). Results improved only slightly for all three variables combined using forced entry (r2 = 0.73), so we use the more parsimonious result. Measured less precisely than in our or Clarkson and Hiscock's (2015) dataset, platform area in Dogandžić and colleagues’ (Reference Dogandžić, Braun and McPherron2015:11–12) data does not contribute significantly. Dogandžić and colleagues’ data yield the following result:
 $$\begin{equation}
{\rm{ln\_mass}}\;{\rm{ = }}\;{\rm{ - 0}}{\rm{.61}}\;{\rm{ + }}\;{\rm{1}}{\rm{.68}}\;{\rm{*}}\;{\rm{ln\_thickness}}
\end{equation}$$
(see Supplemental Table 1). Applied to the Nobles Pond data, no result was less than observed mass nor nearly as high as the highest estimates produced using platform-allometry estimates. Only one estimate was > 40 g, a range that, above, we considered unusually high, and only four > 30 g (range = 7.5–41.7 g, X = 17.7 g, σ = 8.6, CV = 48.7). Mean estimated mass did not differ significantly from the mean of Bohush's experimental blanks (t = 0.045, p = 0.64). Statistically and intuitively, that is, this expression produced the most satisfactory result. We label this estimate of original mass “DBM,” after the authors of the original study. Retouch to prepare the distal edge and for haft accommodation reduced mass of Bohush's experimental specimens an average of 19.58% before first use. Therefore, we derived a mass-reduction measure as:
 $$\begin{eqnarray}
&&{\rm{N}}{{\rm{P}}_{{\rm{MR2}}}}\;{\rm{ = }}\;{\rm{1}}\;\nonumber\\
&&\quad{\rm{ - }}\;\left( {{\rm{discarded}}\;{\rm{mass}}\;{\rm{/}}\;{\rm{DBM}}\;{\rm{*}}\;{\rm{0}}{\rm{.8042}}} \right){\rm{)}}\nonumber\\
\end{eqnarray}$$
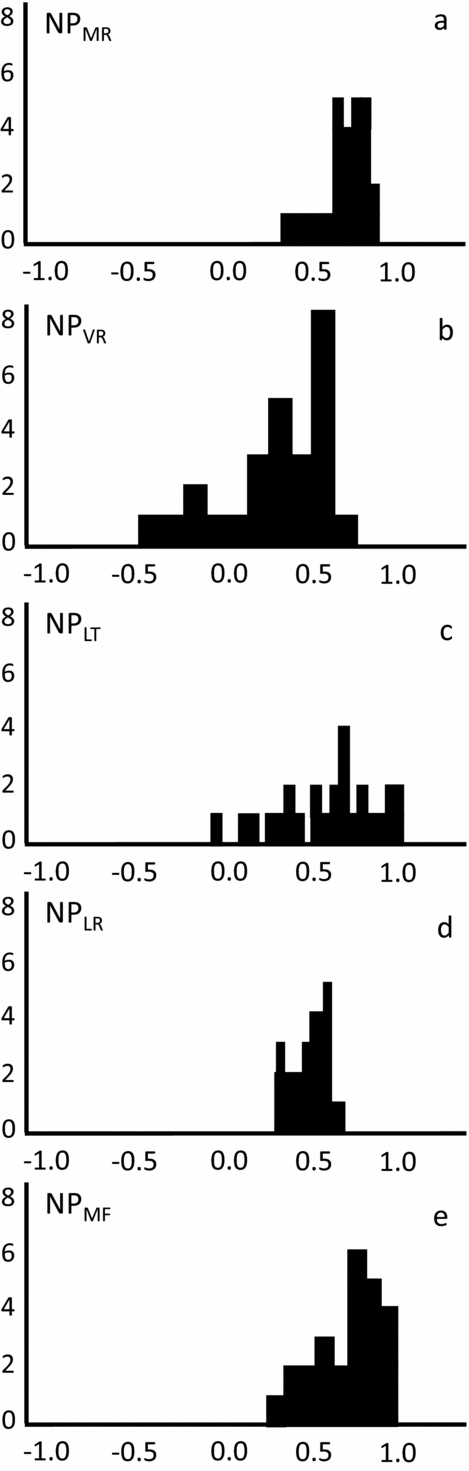
where actual or measured mass is mass at discard and DBM is reduced proportional to Bohush's data (1.00–0.1958 = 0.8042). To distinguish this measure from previously defined volumetric reduction (VR) measures (Shott and Weedman Reference Shott and Weedman2007), we call it “Mass Reduction 2” (MR2). Mass at discard divided by (estimated) original mass is a proportion that ranges between 0 and 1 and that varies inversely with degree or extent of reduction. That is, it yields higher values for less-reduced specimens. Subtracted from 1, the measure varies directly with degree of reduction, as elsewhere (Morales, Lorenzo, and Vergès Reference Morales, Lorenzo and Vergès2015; Shott and Seeman Reference Shott and Seeman2015). NPMR2 values show a modest negative skew and most values in the range of 0.50–0.75 (Figure 4).
Histograms of Nobles Pond reduction variables: (a) NPMR, (b) NPVR, (c) NPLT, (d) NPLR, and (e) NPMF.

Estimated Reduction in Volume
Original volume of flake blanks was estimated using Patten's (Reference Patten2005:165) expression of original volume as a function of maximum thickness:
 $$\begin{eqnarray}
&&{\rm{Original\; Volume}}\;{\rm{ = }}\;{\rm{40}}{\rm{.812}}\;\nonumber\\
&&\quad\;{\rm{*}}\;{\rm{maximum\; thicknes}}{{\rm{s}}^{{\rm{2}}{\rm{.242}}}}
\end{eqnarray}$$
Volume of discarded specimens was calculated by ScanStudio. Volume reduction then was calculated as:
 $$\begin{eqnarray}
&&{\rm{N}}{{\rm{P}}_{{\rm{VR}}}}\;{\rm{ = }}\;{\rm{1}}\;{\rm{-}}\;( {{\rm{discarded\; volume/}}}\nonumber\\
&&\quad{{\rm{estimated\; original\; volume}}} )
\end{eqnarray}$$
which varies between 0 and 1. Bohush (Reference Bohush2013) did not report volumes of experimental blanks, so we cannot correct this value for modification before hafting and first use. Patten (Reference Patten2005) did not plot volume upon maximum thickness but reported that all data points fell within broad 88% confidence limits; clearly, this estimator also contains error. In fact, estimated volume reduction in 5 of 25 Nobles Pond endscrapers yielded a negative value, i.e., original volume < volume at discard. As with Clarkson and Hiscock's (2015) estimators, obviously there is error in NPVR. Otherwise, NPVR is skewed to high positive values (Figure 4). Shott and Weedman (Reference Shott and Weedman2007:1027–1028) used this measure, where no negative values were encountered and it correlated strongly with most other reduction estimates.
Estimated Reduction by Length:Thickness Allometry
Shott and Seeman (Reference Shott and Seeman2015:Eq. 1) computed a variable based on the allometric relationship between endscrapers’ constantly declining length and substantially constant thickness (Blades Reference Blades2003) as:
 $$\begin{eqnarray}
&&{\rm{LT}}\;{\rm{ = }}\;{\rm{8}}\;{\rm{-}}\;({{\rm{discarded\; length}}\;{\rm{/}}}\;\nonumber\\
&&\quad{{\rm{discarded\; thickness}}})
\end{eqnarray}$$
where 8 slightly exceeds the maximum value (= 7.91) for length:thickness in Morrow's (Reference Morrow1997) experimental dataset. The result ranged from 1.6–5.1 and rose as reduction progressed. LT should decline steadily as reduction proceeds, an expectation that Morrow's (Reference Morrow1997:Table 4) and Bohush's data support. LT does not vary between 0 and 1 in ours or other datasets (e.g., Bohush Reference Bohush2013:Appendix B; Daniel et al. Reference Daniel, Moore and Pritchard2007:80; Morrow Reference Morrow1997). There are no mathematical or theoretical limits on the range of LT. In our Nobles Pond sample, it ranged from approximately 1 to 5 and showed no marked skew or mode. To conform its scale to other reduction measures, we zeroed LT by subtracting the minimum value from all cases, then divided the result by its maximum value (3.6) to yield a reduction variable NPLT that, like other measures, ranged between 0 and 1. This variable strongly correlated with “size-adjusted” thickness (Eren Reference Eren2013:2105) calculated for Nobles Pond specimens (r = 0.97, p < 0.01); both measure the allometry by which length and other size measures decline in use as thickness remains nearly constant. Obviously, the calculation assumes that the minimum value represents little to no use and curation, maximum value the greatest use and curation possible.
Estimated Reduction in Length
Finally, we estimated original length of Nobles Pond endscrapers from Goldstein's (Reference Goldstein2014:12) regression of flake original length upon thickness, as:
 $$\begin{eqnarray}
&&{\rm{Original\; length}}\;{\rm{ = }}\;{\rm{25}}{\rm{.024}}\;\nonumber\\
&&\quad{\rm{ + }}\;( {{\rm{5}}{\rm{.836}}\;{\rm{*}}\;{\rm{maximum\; thickness}}})\;\;\;\;\;\;\;\;\;\;\;\;\;\;
\end{eqnarray}$$
Goldstein's (Reference Goldstein2014:Figure 5) regression was statistically significant but also showed considerable dispersion around the least-squares line; original length so estimated also contains error. Mean estimated original length was 70.3 mm, similar to the estimated length of northeastern Paleoindian flake shavers at first use (Grimes and Grimes Reference Grimes and Grimes1985) and Morrow's (Reference Morrow1997) experimental scraper. No estimate was less than the length of endscrapers at discard, so this reduction estimate returned no negative values. Bohush (Reference Bohush2013:Appendices A-2, A-3) reduced original length of flake blanks an average of 15.6% as they were modified for hafting and first use. Accordingly, we multiplied the Goldstein length estimate by 0.844 (= 1.00–0.156) and then calculated length reduction as:
 $$\begin{eqnarray}
&&{\rm{N}}{{\rm{P}}_{{\rm{LR}}}}\;{\rm{ = }}\;{\rm{1}}\;{\rm{-}}\;( {{\rm{discarded\; length}}\;{\rm{/}}\;}\nonumber\\
&&\quad{({{\rm{estimated\; original\; length}}\;{\rm{*}}\;{\rm{0}}{\rm{.844}}})} )\;\;\;\;\;\;\;\;\;\;\;\;
\end{eqnarray}$$
which again ranged from 0 to 1 and occupied mostly intermediate values (Figure 4). NPLR is not to be confused with the empirically derived length-reduction measures used by Shott and Seeman (Reference Shott and Seeman2015).
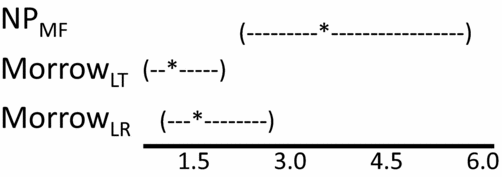
Plot of Weibull β parameter estimates for NPMF compared to MorrowLT and MorrowLR.

Model-Fitting Reduction Distributions
Distributions of reduction and curation measures can be fitted to theoretical distribution models that are efficiently summarized by their parameter estimates and that implicate different causes of discard. If reduction indices measure, at least indirectly, the amount of utility extracted from tools (Shott Reference Shott1996), then the shape of their distributions can reveal the major factors that explain that degree of curation. As before (Shott and Seeman Reference Shott and Seeman2015; see also Morales Reference Morales2016; Morales, Soto, et al. Reference Morales, Soto, Lorenzo and Vergès2015; Shott Reference Shott, Iovita and Sano2016), we fitted empirical distributions to the Weibull model. The basic Weibull is a two-parameter model that describes a distribution's scale (α) and form (β). NPMR2, NPVR, NPLR and NPLT are scaled between 0 and 1 and increase in value with degree of reduction and, by extension, curation. (Unscaled reduction measures did not vary between 0 and 1, but their Weibull β values were nearly identical to analyzed distributions.) Differences between measures, therefore, can be only in mean and distribution of values.
Values of the Weibull shape or β parameter implicate different causes of failure. When β is significantly less than 1, much failure is in earliest use, called “burn-in.” When β is near 1, failure rates are constant across the range of life, and chance is the chief cause of failure. When β significantly exceeds one, failure rate increases with age or time and attrition is implicated. When 1 < β < 2, failure rate increases at decreasing rate that implicates early wear-out failure; when β = 2, the rate of increase is linear such that failure risk increases at constant rate; and when β > 2, failure rate increases at an increasing rate, implicating rising attrition (Martínez Fernandez Reference Martínez Fernández2011:11; Morales Reference Morales2016:235; ReliaSoft 2015:107–109). Fitting empirical distributions to models, therefore, can reveal not merely how much reduction the tools experienced but also the factors that determine or govern reduction, curation, and the range of variation in curation within assemblages.
Uncertainty arising from different measures of original size and degree of reduction of stone tools forces archaeologists either to make ad hoc choices among measures or to use the information that inheres in all of them to derive an overall reduction measure. Physical anthropologists have confronted a similar dilemma when using different skeletal-aging methods. Reasoning that if “more than one criterion is available from which to assess skeletal age at death, then clearly all should be employed,” Lovejoy and colleagues (Reference Lovejoy, Meindl, Mensforth and Barton1985:3) submitted independent estimates to principal-components analysis (PCA) of correlation matrices. Each measure was multiplied by its correlation with Principal Component 1 (PC1), and the sum of products averaged as “multifactorial age” (see Supplemental Text).
Analysis
Evaluated against experimental controls and relevant archaeological data, all measures of estimated reduction show some error or uncertainty. This is true of analytical measures generally, certainly of reduction measures devised elsewhere (e.g., Archer et al. Reference Archer, Schlager, Cornel, Rezek, Dogandžić, Desta, Weiss, Lin and McPherron2016; Davis and Shea Reference Davis and Shea1998; Dibble and Rezek Reference Dibble and Rezek2009; Eren et al. Reference Eren, Dominguez-Rodrigo, Kuhn, Adler, Le and Bar-Yosef2005; Hiscock and Clarkson Reference Hiscock and Clarkson2005; Shott et al. Reference Shott, Bradbury, Carr and Odell2000). None is a panacea. A measure's chief value is to estimate the degree of reduction that specimens experienced. In that sense, devising the measures and calculating their values is an end in itself. But analysis can be advanced in two ways. The first uses the range and distribution of reduction values to fit distributions of reduction values to models whose parameters are interpretable in archaeological terms. The second weights different measures and derives overall reduction measures that mitigate measurement error or uncertainty.
Model-Fitting
Analysis began by fitting each reduction estimate using Minitab™’s Reliability/Survival Analysis module, its Distribution Identification function, that measures each variable's best fit to specified models, and its overview plots and parameter estimation. First, we fitted measures to Weibull, exponential, logistic, log-logistic, and log-normal distributions. Anderson-Darling values were lowest for the Weibull models, indicating closest fit.
Accordingly, we confined further analysis to the Weibull distribution, both for goodness-of-fit and parameter estimation. We used Minitab's least-squares regression (LSR) method to calculate Weibull goodness-of-fit and parameter estimates for reduction estimates, and 95% confidence limits around β estimates. Parameter estimates increased, but statistical results did not differ significantly in using Minitab's maximum-likelihood (MLE) alternative. MLE can yield seriously biased results in small samples; LSR is recommended when sample sizes are less than 40 and for complete (i.e., uncensored) data like ours (Trustrum and Jayatilaka Reference Trustrum and Jayatilaka1979).
Minitab tests for similar β estimates between measures, and for β’s equality to 1. As above, when β = 1, Weibull reduces to the exponential model where failure is constant across the entire use-life range, essentially a default random model of failure risk and discard and reasonable baseline (e.g., Surovell Reference Surovell2009:75; but see Shott and Sillitoe Reference Shott and Sillitoe2004 for data that fit Weibull and Gompertz models). But the exponential model best fits modest reduction and curation rates. Degree of reduction and by extension curation increase as Weibull β rises above 1; accordingly, Weibull is a more versatile model that encompasses the exponential.
We compared Weibull parameter estimates for Nobles Pond endscrapers to two controls. First, Morrow (Reference Morrow1997:Table 4) reported length, width, and thickness before first use and following each of 25 resharpenings for an experimental Paleoindian endscraper. We calculated cumulative length reduction (MorrowLR) and length:thickness ratio (MorrowLT) at each resharpening stage, rescaled, as were comparable Nobles Pond variables defined above. Resulting reduction values for the experimental scraper thus represented the full range of values that such endscrapers might experience, most of which are attained well before maximum reduction, representing endscrapers discarded at approximately uniform intervals between first use and depletion. Such range and relative frequency of values should approximate an exponential model in which all resharpening episodes have an equal chance of occurring (i.e., where Weibull β = 1) and where reduction and curation rates are low. The Weibull β parameter for the Morrow experimental specimen should therefore approximate constant, therefore exponential, failure risk. The second control is Bohush's (Reference Bohush2013:Appendices A1, A3, A5) 12 Nobles Pond replicas, for which mass, length, thickness, and other variables were reported for original flake blanks, then blanks as retouched to form fresh, unused endscrapers, and at depletion (but at no resharpening stages between first use and depletion). We measured MR2 and LT for this dataset (BohushMR2, BohushLT). Bohush did not report volume, so VR could not be measured. Accordingly, we treat reduction from flake blank to discard as a high-reduction, high-curation control, and expect that β >1.
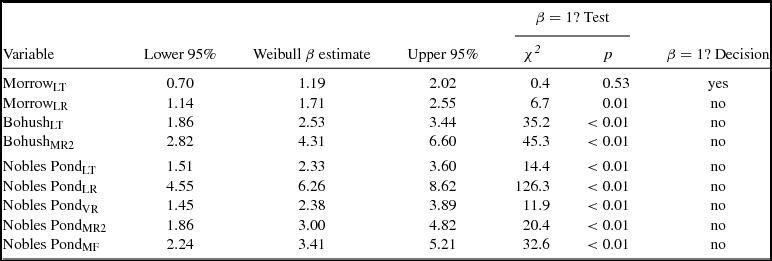
Table 2 reports Weibull β estimates and 95% confidence limits. As expected, MorrowLT fit an exponential model where discard is random with respect to age, curation, or degree of reduction. For MorrowLR, however, β >1, and the measure slightly exceeded exponential failure. Even in this controlled dataset, reduction measures did not agree or fit the same model. As expected, β >1 for BohushMR2 and BohushLT, indicating high curation. Yet parameter estimates were not similar, illustrating the need for multifactorial reconciliation of measures. For all Nobles Pond reduction measures, β >1 (this includes NPVR which returned some negative values omitted from analysis). NPLT and NPVR values implicate early attrition tending toward constant rate of attrition, NPMR2’s and NPLR’s higher values indicating failure at constantly rising rate. As in Morrow's data, NPLR yielded higher β estimates than did NPLT.
Weibull β Estimates, 95% Confidence Limits, and Tests for β = 1.

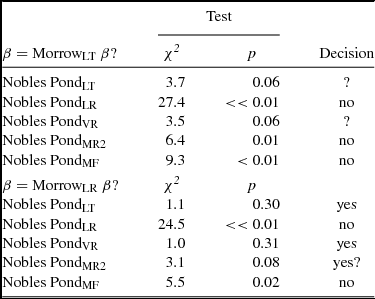
Among Nobles Pond reduction measures, NPMR2 and NPLR considerably exceeded the MorrowLT parameter estimate, while NPLT and NPVR narrowly failed to exceed it at the conventional 0.05 threshold (Table 3). NPMR2 and NPLR also clearly exceeded MorrowLR while NPLT and NPVR failed to attain significant difference. On balance, in Weibull model-fitting, most Nobles Pond endscrapers were depleted after considerable but not exhaustive use, some probably retaining utility when discarded. Morales (Reference Morales2016:236) reported similar results using a single reduction measure in Paleolithic data. Overall, Morrow and Bohush controls pattern mostly as expected, and the Nobles Pond sample falls between the extremes they define.
Test for Equality of Nobles Pond β Parameters to MorrowLT and MorrowLR.

Multifactorial Estimation
Nevertheless, there remains considerable variation among reduction measures and their Weibull β estimates. We used the multifactorial method to reconcile them, conducting PCA of NPVR, NPLT, NPLR and NPMR2 using the correlation matrix to extract factors. One significant PC resulted (eigenvalue = 3.6, percent variance = 89.7), denoted “multifactorial” reduction (NPMF). We multiplied each variable by its PC1 loading and averaged the results for each specimen as:
 $$\begin{eqnarray}
&&{\rm{Score}}\;{\rm{ = }}\;( {\left( {{\rm{N}}{{\rm{P}}_{{\rm{LR}}}}\;{\rm{*}}\;{\rm{ 0}}{\rm{.949}}} \right)\;{\rm{ + }}\;\left( {{\rm{N}}{{\rm{P}}_{{\rm{LT}}}}\;{\rm{*}}\;{\rm{ 0}}{\rm{.945}}} \right)\;}\nonumber\\
&&\quad{{\rm{ + }}\;\left( {{\rm{N}}{{\rm{P}}_{{\rm{VR}}}}{\rm{{*} 0}}{\rm{.970}}} \right)\;{\rm{ + }}\;( {{\rm{N}}{{\rm{P}}_{{\rm{MR2}}}}\;{\rm{*}}\;{\rm{0}}{\rm{.924}}} )} ){\rm{/4}}\nonumber\\
\end{eqnarray}$$
All measures had high loadings; this result does little more than average them for each specimen. But the method minimizes effects of aberrant values that may occur when weakly correlated measures are applied to the same dataset. For instance, replacing NPMR2 with a measure based on mass estimated from Clarkson and Hiscock's (Reference Clarkson and Hiscock2011) method (NPMRCH) yielded:
 $$\begin{eqnarray}
&&{\rm{Score}}\;{\rm{ = }}\;( {( {{\rm{N}}{{\rm{P}}_{{\rm{LR}}}}\;{\rm{*}}\;{\rm{0}}{\rm{.975}}} )\;{\rm{ + }}\;( {{\rm{N}}{{\rm{P}}_{{\rm{LT}}}}\;{\rm{*}}\;{\rm{0}}{\rm{.972}}} )\;}\nonumber\\
&&\quad{{\rm{ + }}\;( {{\rm{N}}{{\rm{P}}_{{\rm{VR}}}}{\rm{{*} 0}}{\rm{.897}}})\;{\rm{ + }}\; ( {{\rm{N}}{{\rm{P}}_{{\rm{MRCH}}}}\;{\rm{*}}\;{\rm{0}}{\rm{.593}}} )} ){\rm{/4}}\nonumber\\
\end{eqnarray}$$
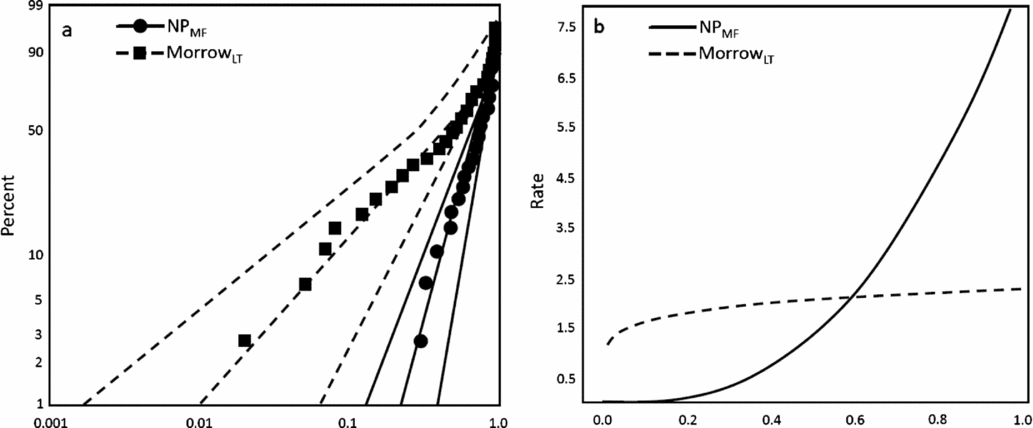
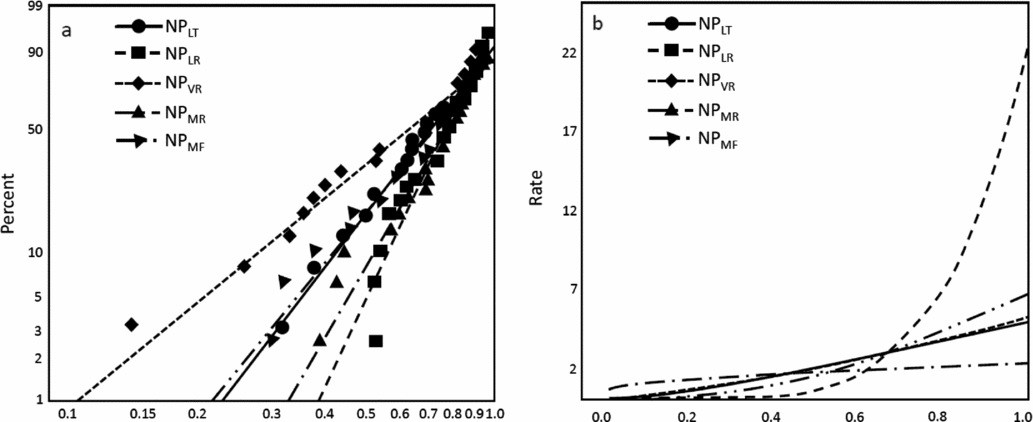
whose NPLR, NPLT, and NPVR loadings changed little but whose mass-reduction loading was much lower; multifactorial estimation effectively weights measures by their correlation with the major axis of variation. We divided scores produced in Eq. 3 by the maximum value among specimens, obtaining NPMF that varied between 0 and 1. As an aggregate measure of the reduction and curation of Nobles Pond endscrapers, it suggests unevenly rising degree of reduction from values near 0.20 toward complete reduction and curation. Like individual measures, NPMF fit the Weibull model best (Table 2). Its β estimate clearly exceeded MorrowLT’s and MorrowLR’s (Table 3; Figure 5), resembled BohushLT’s (χ2 = 1.3; p = 0.26), BohushMR2’s (χ2 = 0.6; p = 0.45), NPVR’s (χ2 = 1.2; p = 0.27), NPLT’s (χ2 = 1.5; p = 0.22) or NPMR2’s (χ2 = 0.2; p = 0.69), and was significantly less than NPLR’s (χ2 = 5.0; p = 0.03), suggesting that NPLR does not scale similarly to other reduction measures. Figure 6 compares NPMF’s probability and hazard plots to MorrowLT (each plot's y-axis shows the cumulative percentage of observations, its x-axis reduction values from 0 to 1). Hazard-plot y-axes show rate of failure, x-axes the reduction-measure value from 0 to 1; NPMF’s hazard curve rises with “age” at rising rate as do distributions governed partly by attrition, while MorrowLT’s remains nearly constant (i.e., flat), consistent with an “age”-independent exponential model of low curation rate. NPMF’s β estimate lay between Bohush values, both of which are consistent with somewhat increasing attrition and relatively high curation. Accordingly, NPMF suggests considerable but not complete curation of Nobles Pond endscrapers. Its probability plot and hazard curve lie between NPLR and other Nobles Pond measures, somewhat reconciling the former's high value with other measures (Figure 7 confidence limits omitted for clarity).
Weibull probability plots and hazard curves for (a) MorrowLT and (b) NPMF. Probability-plot x-axes denote time of failure in units of the measure, y-axes cumulative percentage of observations. Hazard-plot y-axes denote failure rate across the range of x-axes measures.

Weibull (a) probability and (b) hazard plots for all Nobles Pond reduction measures.

As above, NPMF’s β significantly exceeded the baseline value of 1.0, equivalent to the exponential model. NPMF’s β also significantly exceeded 2.0 (χ2 = 6.2; p = 0.01), indicating increasing attrition. Although the multifactorial method applied to our data with nearly equal weights may seem merely to roughly average them, NPMF yields important information that individual measures do not. Separately, NPLT and NPVR β estimates are near 2.0, suggesting positive, linear attrition. Only when combined with other measures and summarized by NPMF do results implicate rising, not linear, attrition. NPMF’s β does not significantly exceed 3.0 (χ2 = 0.6; p = 0.45). If NPLR is removed and NPMF recalculated, β (= 3.33) is only slightly lower and produces no difference in test results.
Interpretation of NPMF agrees with Seeman and colleagues’ (Reference Seeman, Loebel, Comstock and Summers2013:426–429) view that many Nobles Pond specimens were used to exhaustion but that some were discarded with remaining utility. Ethnoarchaeological (Sahle and Negash Reference Sahle and Negash2016; Shott and Weedman Reference Shott and Weedman2007) and archaeological (Goldstein Reference Goldstein2014) data showed similar results as did, to different degrees, data from Spanish Paleolithic and Neolithic sites (Morales Reference Morales2016:236; Morales, Soto, et al. Reference Morales, Soto, Lorenzo and Vergès2015). Seeman et al. (Reference Seeman, Loebel, Comstock and Summers2013:428–429) attributed variation in curation to contingent factors (e.g., the completion of individual hides or work sessions) complicating “a planned, stage-like reduction of reliable tools.” Analysis corroborates this conclusion but surpasses qualitative judgment to reduce degree of curation to a general, comparative scale. Also, it provides estimates of Weibull model parameters useful for comparison to other datasets and in modeling assemblage formation.
Discussion
No reduction measure is ideal, but those tested here possess Hiscock and Tabrett's (Reference Hiscock and Tabrett2010) criteria such as significant relationships between reduction and its measurement (inferential power), and positive variation reduction (directionality). All showed at least broad proportionality between reduction and its measurement (sensitivity), and none suggests dependence of reduction values upon specimen size (scale-independence). Only controlled experiments can gauge whether measures are comprehensive, the tendency to vary monotonically across the full range of reduction that specimens experience. Measures differ from retouch invasiveness or reduction measures based upon cross-section geometry, so may share with those other approaches limited versatility. Future research might test measures concurrently, including another performance criterion: commensurability between them. Those meeting some minimum standard for convergence or agreement can be reconciled using the multifactorial method described here.
There is also the question of the level at which reduction measures apply. Previous studies suggested that platform-allometry indices may be valid for entire assemblages but not their constituent tools (e.g., Clarkson and Hiscock 2010; Davis and Shea 1999; Shott et al. Reference Shott, Bradbury, Carr and Odell2000). Yet all reduction measures used here (and most used by others) are computed from individual specimens and so pertain, trivially, to that level. To speak of their application to assemblages signifies merely that they can be measured on many specimens and that their values can be summarized over assemblages, much as can other attributes of individual specimens such as mass or length.
Earlier analyses (e.g., Clarkson and Hiscock 2010; Shott et al. Reference Shott, Bradbury, Carr and Odell2000) produced good results for most but not all flakes. Results here are more encouraging, because both incidence and magnitude of estimation error seem much lower. Ultimately, however, the best assemblage-level measures will be the best individual-level ones, because all involve measurement of individual specimens projected to the assemblage level. If at the individual level we suspect a measure of significant error, then it becomes valid at the assemblage level only with the optimistic assumption that those errors somehow cancel out there. Ultimately, for measures taken on individual specimens there is no separate assemblage-level validity.
We see two lines of future research. First, lithic analysts must continue to devise and evaluate various reduction measures for their conformity to Hiscock and Tabrett's (Reference Hiscock and Tabrett2010) criteria, as well as to the congruence sought here and elsewhere (Eren and Prendergast Reference Eren, Prendergast and Andrefsky2007). This will include controlled experiments where measures of original size like mass, volume, and length are directly measured, then remeasured at successive intervals of use and reduction (e.g., Shipton and Clarkson Reference Shipton and Clarkson2015). Ideally, such experiments also should include 3D digital artifact models at all stages of work from flake blank through modification for hafting and reduction from resharpening at each subsequent retouch episode. Archer and colleagues (Reference Archer, Schlager, Cornel, Rezek, Dogandžić, Desta, Weiss, Lin and McPherron2016) used geometric morphometrics to predict overall flake-blank size and shape from landmarked proximal segments, and failed to detect any influence of core surface preparation, angle of blow, or other variables that are difficult if not impossible to measure. Unfortunately, their study appeared after this study was completed, but their approach should be tested in future experiments. In Paleoindian studies, a complementary approach should involve the growing corpus of empirical flake-blank data, particularly from caches (e.g., Bement Reference Bement, Bruce and Kilby2014:Figure 5.3; Kilby Reference Kilby2008). Whether they are representative of larger assemblages (Skov Reference Skov2012), precise measurement of cache tools by scanning may define empirical functions that express volume, area, or mass as functions of, for instance, platform area. If reduced endscrapers in archaeological assemblages bear platforms of similar size or form produced by similar core-reduction processes, it is reasonable to apply estimates of original size derived from cache specimens. Resulting measures can be assessed individually for their conformity to performance measures discussed here, as can the multifactorial measure that reconciles them.
Second, reduction measures must be applied to a range of flake-blank and tool types, and toolstones. For instance, scar density in bifaces (Shipton and Clarkson Reference Shipton and Clarkson2015) may mirror scar density in flake debris (Bradbury and Carr Reference Bradbury and Carr1999) as a continuous measure of reduction. As we learn which measures work best on which types and materials, we learn more about the “ducked” (Gamble Reference Gamble1986) processes that govern artifact discard and the formation of assemblages.
Assemblage modeling is no esoteric problem, despite the necessarily abstract character of its foundational sources (Ammerman and Feldman Reference Ammerman and Feldman1974; Cowgill Reference Cowgill, Leonard and Jones1989). In modeling how Folsom people depleted toolkits, Surovell (Reference Surovell2009:75) reasonably assumed that discard rate was exponential. Results here and elsewhere (e.g., Shott and Seeman Reference Shott and Seeman2015; Shott and Sillitoe Reference Shott and Sillitoe2004; Shott and Weedman Reference Shott and Weedman2007) suggest that discard often is attritional, not exponential, and that relevant Weibull parameters vary significantly. Revising Surovell's sophisticated behavioral models (see also Barton and Riel-Salvatore Reference Barton and Riel-Salvatore2014; Stevens and McElreath Reference Stevens and McElreath2015:102–104; Ugan et al. Reference Ugan, Bright and Rogers2003) in light of such formation research will improve our ability to test such models against empirical archaeological data.
Conclusion
We used allometric estimates of reduction in mass, volume, length, and length:thickness ratio to estimate degree of reduction of discarded archaeological specimens from Nobles Pond. Measures based upon volume, length, and length:thickness fit a Weibull distribution where β >1, indicating considerable curation of Nobles Pond endscrapers; a mass-reduction estimate yielded different results. Analysis demonstrated most methods’ consistency with one another. A multifactorial measure that reconciles variation among separate measures is the best aggregate measure for this dataset. It too indicated substantial reduction and curation.
This pilot study's goal is not to conclude that any particular Weibull β estimate and inferred curation rate is the “true” one for this sample, although NPMF seems preferable for reasons discussed above. Only further research on allometric relationships will improve the reliability of reduction analysis. Until then, the value of reduction measurement and estimation of curation will remain only partly realized.
Acknowledgments
Key volunteers and students Garry Summers, Larry Morris, Elaine Dowd, Becky Sponseller, Paul Barans, Nick Labasi, Rick Neilson, Phil Costentino, and Aaron Comstock provided leadership in excavation and analysis. Excavation at Nobles Pond was funded in part with the support of NSF grant BNS 88–14809 and the Timken Foundation, and analyzed with NSF grant BCS-0948235. We thank Kent State University, Stark for providing laboratory space for analysis. Brian Trail scanned and processed specimens for 3D analysis. Thanks are due to Andrew Bradbury, Chris Clarkson, and three anonymous reviewers for constructive comments and assistance. Robert Kelly ably guided the paper through the editorial process.
Data Availability Statement
The Nobles Pond collection is housed at the Stark Campus of Kent State University. Data used in analysis here are available as Supplemental Material.
Supplemental Materials
Supplemental materials are linked to the online version of the papers, accessible via the SAA member login at https://doi.org/10.1017/aaq.2017.40.
Supplemental Text. Discussion on Estimating Original Mass and Multifactorial Estimation.
Supplemental Table 1. Nobles Pond Specimen Measures and Original-Mass Estimates.
Supplemental Figure 1. ScanStudio image showing 3D model of an endscraper proximal end and platform.