Nomenclature
- b
radius
- c 0
tracer gas concentration at coolant inlet
- c a
-
tracer gas concentration at mainstream inlet
- c s
tracer gas concentration at determined points in wheel-space cavity
- f blade
rotor frequency
- IR
injection ratio
- m main
mass rate of main flow
- m seal
mass rate of rim seal flow
- n
rotational speed
- pa,max
maximum pressure in the
 ${T}_{\textrm{r}}$
period
- pa,min
-
minimum pressure in the
${T}_{\textrm{r}}$
period - p t, in
-
inlet total pressure
- Rhub
-
hub radius
-
$T_{\textrm{r}}$
-
1/18 of the entire period
-
$T_{\textrm{t},\,\textrm{in}}$
-
inlet total temperature
-
$T_{\textrm{t},\,\textrm{seal}}$
-
inlet total temperature of rim seal flow
-
$V_{\textrm{r}}$
-
time-averaged non-dimensionalised radial velocity
-
$\rho$
-
the gas density
- Ω
-
rotational angular velocity
-
$\boldsymbol\varepsilon$
c
-
sealing effectiveness
- ΔC p,a
-
pressure coefficient


1.0 Introduction
With the improvement of gas turbine performance, the inlet temperature of the turbine is increasing. To prevent high temperature gas from damaging the wheel-space, a certain amount of cooling gas needs to be introduced to protect the disk cavity. However, the cooling gas from high pressure compressor will affect the efficiency of the gas turbine [Reference Carey, Inderwildi and King1]. Appropriate cooling gas can cool down the turbine components while ensuring the efficient operation of the turbine. Therefore, it is of great significance to clarify the interaction mechanism between the purge flow and the mainstream in the main gas path, which improves the efficiency and optimises the design of the gas turbine structure.
With the advancement of experimental measurement technology and the accuracy improvement of numerical simulation methods, researchers have carried out a large number of fruitful studies on the flow characteristics of turbines with rim sealing structures, which is located at rotor-stator disk. McLean et al. [Reference Mclean, Camci and Glezer2, Reference Mclean, Camci and Glezer3] experimentally measured the effect of purge flow on turbine efficiency and investigated the interaction characteristics of three types of jet flow with the main flow: root injection, radial cooling and impingement cooling. Their results showed that the purge flow disturbs the hub boundary layer and affect the development of rotor secondary flow, and 1% increase in purge flow volume causes a reduction in the total-total turbine efficiency, total pressure loss coefficient, and three-dimensional velocity of over 5%, 2% and 15%, respectively. Schuepbach et al. [Reference Schuepbach, Abhari and Rose4, Reference Schuepbach, Abhari and Rose5] investigated the effect of purge flow on rotor passage secondary flow and the mechanism causing turbine aerodynamic losses by a combination of experimental measurements and numerical simulations, and found that the purge flow lifts the hub secondary flow structure and induces a new vortex structure at the leading edge of the rotor. Bunker and Laskowski et al. [Reference Bunker, Laskowski and Bailey6, Reference Laskowski, Bunker and Bailey7] designed an experimental rig with a rotating cylinder replacing the blade and the corresponding numerical simulation method to study the development of the vane wake, the distribution of the circumferential pressure gradient and the blockage effect caused by the sealing flow. The results showed that the blade leading edge bow wave and the vane trailing edge wake are key to the resulting gas ingestion or more appropriately the forcing of hot gas inboard of the rim seal, which can increase the leading edge blockage and reduce buffer cavity cooling effectiveness by a factor of 0.1. Jia et al. [Reference Jia and Liu8] simplified the rim sealing structure and numerically investigated the variation of the blade flow field under four purge flow rates. It was found that the rim sealing gap jet changes the distribution of the flow angle at the exit of cascade along the blade height. The higher the sealing flow rate, the thicker the boundary layer at the leading edge of the blade, and the more the turbine aerodynamic loss.
Chilla et al. [Reference Chilla, Hodson and Newman9] numerically investigated the interaction between the mainsteam and the egress of the overlapped rim sealing structure. The results showed that the circumferential nonuniform pressure distribution caused by the blade rotation and the difference in velocity between the purge flow and the mainstream greatly affect on the stator-rotor cavity exit flow field. The increase of the flow rates and tangential velocity can stabilise the interaction process between the purge flow and the mainstream. Regina et al. [Reference Regina, Kalfas and Abhari10] investigated the effect of purge flow on turbine performance on a 1.5-stage high-pressure turbine rig. The results showed that the stage isentropic efficiency of the turbine decreases by 0.8% for each 1% increase in the purge flow, and the unsteady interaction between the purge flow and the mainstream secondary flow changes the attacking angle of the airflow and the flow coefficient at the root of the blade. Zerobin et al. [Reference Zerobin, Peters and Bauinger11, Reference Zerobin, Aldrian and Peters12] experimentally investigated the effect of four purge flow types with different flow rates, pressures and temperatures on the performance of a high-pressure turbine, and found that the aerodynamic loss in the main gas path is more sensitive to variation in the relative positions of the rim seal and the vane and blade. Sterzinger et al. [Reference Sterzinger, Zerobin and Merli13] investigated the effect of the purge flow mixed with the high-pressure turbine main flow on secondary flow, outlet flow field and performance in the low-pressure turbine by experimental measurement and numerical simulation. It was found that the high-pressure turbine secondary flow causes additional aerodynamic loss in the low-pressure turbine flow path, and the low-pressure turbine is less affected by the purge flow than the high-pressure turbine. Schreiner et al. [Reference Schreiner, Wilson and Li14] investigated the effect of purge flow on the secondary flow in the endwall of the rotor and found that the purge flow increases the flow instability in the wheel-space. With the influence of purge flow, the horseshoe vortex pressure side leg is enhanced significantly, and the horseshoe vortex suction side leg is weakened. Ziqing et al. [Reference Zhang15] studied the effect of leakage vortex formed by the three rim sealing structures on the sealing efficiency and the interaction between the purge flow and the main flow. The results showed that the sealing structure with larger cavities could improve the sealing efficiency more, and the vortex structures generated in the main gas path are diverse at different purge flow rates.
In recent years, rim seal of stator-rotor disk cavities has gradually attracted the attention of scholars. Feng Zhang et al. [Reference Zhang, Wang, Li and Zheng16] investigated the flow and heat transfer characteristics of the front and aft rim sealing structure with a pre-swirl cavities at different purge flow rates, annulus pressure ratio and rotation speed. The results showed that the flow field in the front cavity is sensitive to the purge flow rate and rotation speed. The purge flow rates, rotation speed and annulus pressure ratio slightly influence the flow field in the aft cavity, and the sealing effectiveness of the aft cavity is better than that of the front cavity. Scobie et al. [Reference Scobie, Hualca and Sangan17, Reference Scobie, Hualca and Patinios18] experimentally compared the pressure fluctuations and cooling efficiency of the front and aft rim seal cavities and the re-ingestion of the upstream purge flow into the aft cavity. It was found that the purge flow provides film cooling to the guide vane and blade, and the re-ingestion of the upstream purge flow reduces the thermal effect at the aft cavity exit. Patinios et al. [Reference Patinios, Scobie and Sangan19] and Shuxian et al. [Reference Shuxian, Zhigang and Jun20] investigated the flow characteristics and sealing effectiveness of a dual radial structure with front and aft rim seals by experimental measurements and numerical simulations. The results showed that the vortex in the disk cavity originates from the vane boundary layer and determines the radial distribution of pressure. The main flow pressure fluctuation near the aft cavity is smaller than that of the front cavity. As the main flow increases, the sealing effectiveness decreases.
While the above study of the upstream rim seal of the turbine blades is of great importance in reducing the aerodynamic losses, the downstream rim seal of the blades is affected by more complex factors such as the combined effect of the front and aft purge flows, the upstream vane and blade trailing edge wake, and unsteady effect of blade rotation, which also have a significant impact on the efficiency of the turbine. Therefore, in order to further improve the efficiency of the turbine, this study uses a 1.5 stage turbine to analyse the effect of the front cavity seal flow and the second vane on the downstream rim seal flow characteristics, as well as the unsteady pressure fluctuations in the main flow after gas ingestion into the disc cavity.
2.0 Configuration and numerical setup
2.1 Computational model
The LISA 1.5-stage turbine of the Turbomachinery Laboratory of the Swiss Federal Institute of Technology is selected as the research object. The detailed design process and aerodynamic parameters are described in the reference [Reference Behr21]. Figure1 shows the schematic diagram of the model used in this study. The relative position of the sealing structure and the main gas path is shown in the figure. In order to facilitate the study of the interaction between the purge flow and the main flow, the disc cavity structure is simplified and only the part of the rim seal configurations intersecting the main gas path is retained, while the corresponding extension and enlargement are carried out to ensure the stability of the flow.
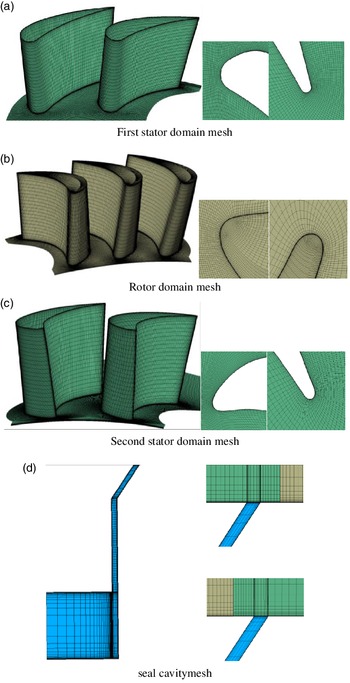
The grids of the main gas path and the sealing structure are both generated by AutoGrid5/IGG, as shown in Fig. 2. To save computational resources, the number of blades in the 1.5-stage turbine model is simplified from 36:54:36 to 2:3:2. The computational domain includes two stator and three rotor passages. The surface of the periodic boundary is a periodic matching mesh to ensure the accuracy of the calculation and continuity of the streamline during post-processing. The non-dimensional first cell height was set to
 $y^{+}\approx 1$
which is fully in accord with the requirement of turbulence model. To reduce the error caused by the interpolation calculation, the interface of the sealing structure and the main gas path of the turbine is meshed with exactly matched axial and circumferential nodes.
The sensitivity verification of the computational grids has been carried out in the study and the chosen comparison parameter is the stage efficiency. The results are shown in the Table 1. After comparing the previous experimental and numerical results, a grid model of 9.37 million was chosen for the study in order to save computational resources, of which the number of stator grids is about 1.95 million, and the number of rotor grids is about 4 million, and the number of second stator grids is about 2.49 million, and the number of seal cavity grids is about 1.1 million.
Sensitivity verification of the computational grids

1.5-stage turbine with front and aft seal cavity.

2.2 Boundary condition
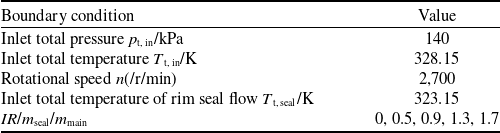
The commercial CFD solver, ANSYS CFX Version 18.0, has been employed to solve Unsteady Reynolds-Averaged NavierStokes (URANS) equations coupled with shear stress transport (SST) turbulence model. The URANS method is subject to a certain degree of error for the study of rim seal flow, but in view of the current computational resources and practical needs, URANS is still the main research method in this study. CFX uses the finite volume method based on the finite element method. It adopts an implicit coupling pressure-based method which is the use of a coupled formulation for the mass and momentum equations. The fluid was modeled as an ideal gas. Thermal and transport properties such as specific heat capacity, thermal conductivity and molecular viscosity were kept constant. Total pressure and static pressure boundary conditions were imposed to the mainstream inlet and outlet, respectively. The solid wall was smooth, adiabatic and no slip wall. Mass flow rate boundary conditions were assigned for the front and aft purge flow inlets. The IR (Injection Ratio) was given by the ratio of the purge flow rate to the main flow rate, and the selected purge flow IR was adopted as 0, 0.5%, 0.9%, 1.3% and 1.7%. Endwall indicated the condition without sealing structure, and IR = 0 indicated the condition where sealing structure existed but no purge flow was applied. In this study, the purge flow was not applied to the aft cavity. The detailed boundary conditions are shown in Table 2.
Computation boundary conditions

Computation mesh of 1.5-stage turbine with front and aft seal cavities.

Referring to the measurement method of sealing effectiveness in the experiment, a scalar equation was solved to represent the purge flow and to determine the rim sealing effectiveness. Tracer gas was seeded into the purge flow and then the tracer gas concentration was measured in the cavities to quantify the sealing effectiveness of the rim seal. The sealing effectiveness
 $\boldsymbol\varepsilon$
c
is defined as Eq. (1)
 \begin{align}{\varepsilon _{\rm{c}}} = \frac{{{c_{\rm{s}}} - {c_{\rm{a}}}}}{{{c_0} - {c_{\rm{a}}}}}\end{align}
where c
0 is the tracer gas concentration at coolant inlet, c
a is the tracer gas concentration at mainstream inlet, and c
s is tracer gas concentration at determined points in wheel-space cavity. In the calculation, the concentration of the tracer gas at the inlet of the front cavity is set to 1, and the inlet of the mainstream is set to 0. According to the Eq. (1), that is, c
0 = 1, c
a = 0; the sealing effectiveness
 $\boldsymbol\varepsilon$
c
is equal to the concentration of the tracer gas.
The steady simulation was conducted with the domain interface modeled by Frozen rotor and steady results were used as the initial flow field of the unsteady calculations. In the unsteady simulation, the domain interface was set as Transient rotor stator, i.e. sliding grid. The second-order Euler-backward and second-order upwind schemes were used for temporal and spatial discretisation. The time step was set to 1.03 × 10⁻⁵s, corresponding to 120 physical time steps for one blade passing period. The number of iteration steps in each physical time step was 10 and the residual was set to 10–6. When the key parameters of the monitoring point show a periodic change with time for more than two periods, the calculation was considered to be converged.
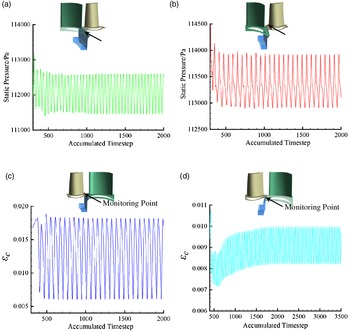
Figure 3 shows the convergence history of static pressure and sealing effectiveness at the different monitoring points in unsteady calculation for IR = 1.7%. It can be seen that after reaching approximately 2000 time steps, the key parameters at the intersection of the front and aft cavities and the main gas path change periodically and the calculation converges.
Static pressure variation at monitoring points: (a) static pressure monitor at the front rim seal cavity; (b) static pressure monitor at the leading edge of the rotor; (c) sealing effectiveness monitor at the trailing edge of the rotor; (d) sealing effectiveness monitor at the aft rim seal cavity.

2.3 Validation
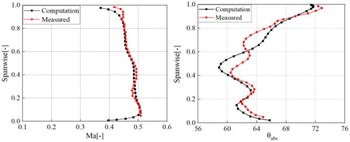
To validate the numerical method, the calculated pitchwise mass-averaged Mach number and the absolute flow angle at the computational domain outlet are compared with experimental data [Reference Behr21] for Endwall. Results are shown in Fig. 4 and indicate that the numerical simulation results are consistent with the distribution trends of experimental measurements. Except from close to the hub and shroud, the relative error of the absolute flow angle and Mach number of the other blade heights is not exceed 5%.
Mach number and absolute flow angle at outlet.

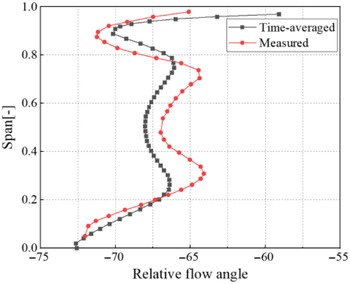
A comparison of the time-averaged results of the relative flow angle with the experimental results [Reference Schuepbach22] at rotor outlet for IR = 0.9% is given in Fig. 5. As can be seen from the figure, the unsteady time-averaged results of the numerical simulation are consistent with the trend of the radial distribution of the experimental measurements with a maximum relative error of 3.3%.
Relative flow angle at rotor exit for IR = 0.9%.

The radial distribution of sealing effectiveness.

Based on the comparison between the numerical simulation and experimental measurement results in Figs. 4 and 5, it must be acknowledged the discrepancy between the predictions of the numerical simulations and the experimental data, but the error can be considered to be within acceptable limits from the comparison of the results. The numerical method adopted in this paper can accurately simulate the flow characteristics of the flow field in a 1.5-stage turbine with front and aft cavities.
3.0 Results and discussion
3.1 Distribution of purge flow in the front cavity
The radial distribution of time-averaged sealing effectiveness in the front cavity near both the stationary and rotating wall is given in Fig. 6. The vertical coordinate is the dimensionless radius, defined as (r-Rhub)/Hblade. At IR = 0.5%, the front cavity is not completely sealed, and the mainstream ingress to 8% blade height depth on the stationary wall, and 10% blade height depth on the rotating wall. The sealing effectiveness is higher on the stationary wall than on the rotating wall. According to the research results of Patinios et al. [Reference Patinios, Scobie and Sangan19], the mainstream ingresses the wheel-space axially along the stationary wall and then egresses along the rotating wall. From the research results of Wei et al. [Reference Wei and Huoxing23], the inclined axial structure of the rim seal effectively prevents the main flow from injecting into the wheel-space along the stationary wall side caused by the pressure difference between the front cavity and the main gas path. Because the larger inclination angle leads to the mainstream more easily to ingress the disc cavity on the rotating wall side, so the sealing effectiveness of the front cavity stationary wall side is higher than the rotating wall side. For IR = 0.9%, stationary wall side sealing effectiveness is close to 1, the rotating wall side 4.2% blade height depth is still a small amount of ingress, the front cavity under this condition is close to completely sealed. The front cavity purge flow rates continues to increase to IR = 1.3%, the disc cavity sealing effectiveness is constant 1, the front cavity is completely sealed.
The radial distribution of pitchwise mass-averaged sealing effectiveness: (a) the leading edge of the blade without second vane; (b) the leading edge of the blade with second vane; (c) the trailing edge of the blade without second vane; (d) the trailing edge of the blade with second vane.

Figure 7 shows the radial distribution of the pitchwise mass-averaged sealing effectiveness at the leading and trailing edge of the blade. The data collected along the radial traverse upstream of the rotor blades (red dotted line) are shown in Fig. 7(a)(b), measured half way between the downstream face of the rim seal and the blade leading edge. The concentration measurements downstream of the rotor blades (blue dotted line) are shown in Fig. 7(c)(d). The radial distribution of tracer gas concentration is basically the same, which shows that the mixing process of the front purge flow with the mainstream in the rotor passage is basically not affected by the second vane. The tracer gas concentration at the leading edge of the blade increases with the increase of the front purge flow rates and decreases with the increase of the blade height, with the maximum influence area up to 10% the blade height. The tracer gas concentration at the trailing edge of the blade is more extensive than that at the leading edge of blade, expanding from the hub to approximately 50% the blade height. The tracer gas concentration at trailing edge maximum point climbs along the blade height with the increase of the purge flow rates. IR = 0.5% to IR = 1.7%, the maximum points of the tracer gas concentration at trailing edge are located at 15.2%, 19.2%, 21.2%, 24.2% blade height, respectively. This is consistent with the research results of Schreiner et al. [Reference Schreiner, Wilson and Li14]: The front purge flow is mixed with the mainstream and converges into the hub passage. The purge flow increases the thickness of the hub boundary layer and raises the radial position of the passage vortex.
Contour of non-dimensionalised radial velocity: (a) aft cavity exit without second vane; (b) aft cavity exit with second vane.

3.2 Flow field of aft cavity
Figure 8 shows the contour of time-averaged non-dimensionalised radial velocity V r at the aft cavity exit. The radial velocity of the aft cavity exit is dimensionless by the second vane inlet radial velocity. In the contour, red represents gas ingestion and blue represents purge flow injection. The ingress is more intense than the egress because the purge flow is not applied to the aft cavity. In Fig. 8(a), without the second vane, the aft cavity exit is mainly influenced by the upstream blade, and the influence area of the blade wake is the highest static pressure position of the nonuniform pressure distribution around the hub, where the mainstream is more likely to inject into the aft cavity along the stationary wall of the aft cavity. At the downstream of the suction side of the blade, the static pressure at this position is lower than the area affected by the blade wake. The mainstream ingesting the wheel-space moves axially and then enters the main gas path again along the rotating wall. With the presence of the second vane in Fig. 8(b), the aft cavity exit is affected by the potential field of the vane and the wake of blade together. The frequency of ingress and egress is increased. The positions of ingress and egress are located in the high static pressure area affected by the potential field of the leading edge of second vane and the relatively low static pressure area of the suction side. Because the relative motion of the blade and vane and the ratio of the number is 2:3, the different positions of the high static pressure area and the low static pressure area cause the variation of the strength of the ingress and egress of the aft cavity exit. The front purge flow raises the hub pressure so that the egress between the suction side of the blade and the suction side of the second vane is weakened.
Figure 9 shows contour of the velocity vector and the total pressure coefficient in the middle section of the aft cavity with second vanes. The total pressure coefficient is defined as the ratio of the local total pressure to the total pressure at the main inlet. The dashed line in the figure indicates the location of the second vanes. Comparing the radial velocity distribution at the aft cavity exit in Fig. 8, it can be found that the pressure gradient near cavity exit in Fig. 9 and radial velocity correspond to each other. The high and low total pressure areas correspond to the ingress and egress in Fig. 8. The total pressure at the deeper position of the wheel-space is higher than the inlet of the aft cavity, and the direction of airflow is consistent with the rotor. When the front cavity has no purge flow IR = 0, it can be observed from the velocity vector that the mainstream ingresses the aft cavity from the high total pressure area and is divided into two legs along the direction of rotor rotation and the reverse direction. The leg with the same direction of rotation is subject to the action of the pressure difference between the mainstream and the wheel-space downward into the deeper with the movement of the rotating wall, part of the fluid near hub in the low pressure area forms a counterclockwise vortex out of the aft cavity. The leg against the direction of rotation is subject to the action of the pressure difference between the mainstream and the wheel-space, which forms a clockwise vortex out of the aft cavity. When the front purge flow rate increases continuously, the pressure in the aft cavity increases and the low total pressure area weakens, which is consistent with the performance of the aft cavity exit in Fig. 8(b).
Contour of velocity vector and total pressure coefficient in the middle section of the aft cavity with second vanes.

Based on the analysis of Figs. 8 and 9, it can be seen that the aft cavity is affected by the blades and the second vane. The potential field of the leading edge of the vane greatly influences the airflow changes at the aft cavity exit, which enhances the mainstream gas ingestion. The front purge flow weakens the egress of the aft cavity near the suction side of the second vanes.
Since the purge flow is not applied to the aft cavity, the tracer gas concentration distribution can be used to observe the re-ingestion distribution characteristics of the front egress into the aft cavity. Figure 10 shows the time-averaged tracer gas concentration at the aft cavity exit. Figure 10(a) is aft cavity exit without second vane. For IR = 0.9%, the high and low concentration area of the tracer gas at the aft cavity exit alternately appear. Comparing with Fig. 8(a), it can be seen that the high concentration region and low concentration region roughly correspond to the ingress and egress positions at the aft cavity exit. Combined with the analysis in Fig. 7, it can be seen that part of the front purge flow is not completely mixed with the mainstream and is injected into the aft cavity by circumferential pressure difference. The variation of ingress and egress in Fig. 8(a) is small for IR = 1.3% and IR = 1.7%, but the tracer gas concentration at the aft cavity exit increases overall, which indicates that the front egress increases the ingress into the aft cavity. From the results of Scobie et al. [Reference Scobie, Hualca and Patinios18], this is due to the fact that the front egress disturbs the hub boundary layer, which makes the ingress of the front purge flow in the aft cavity increase. Figure 10(b) is aft cavity exit of with second vane. Influenced by the potential field at the leading edge of the second vane, the ingress of mainstream into the aft cavity is enhanced, and the frequency and the front purge flow rates injecting into the aft cavity increases accordingly.
Tracer gas concentration: (a) aft cavity exit of without second vane; (b) aft cavity exit of with second vane.

Figure 11 shows the radial distribution of the time-averaged tracer gas concentration of the aft cavity near the stationary and rotating wall side. Without the influence of the second vanes, the concentration of tracer gas in Fig. 11(a)(b) decreases gradually along the radial depth. The tracer gas concentration on the side of the stationary wall is higher at low radial depth. The front purge flow along the stationary wall ingresses the aft cavity by the pressure difference between the wheel-space and the main gas path. The tracer gas concentration at the radius of the inclined axial seal is significantly higher than that at the deeper wheel-space, indicating that the rim sealing structure inhibits the gas ingestion. When the air flows out of the wheel-space along the rotating wall, the maximum tracer gas concentration appears at the position of 1% blade height depth. In Fig. 11(c)(d), with the presence of the second vane, the front purge flow ingresses the aft cavity more severely due to the potential field of the leading edge of the second vane. When the same purge flow rate is applied to the front cavity, the tracer gas concentration in the aft cavity is higher than that in Fig. 11(a)(b) and remains almost constant along the radial. The concentration distribution of tracer gas on the rotating and stationary wall is also similar.
The tracer gas concentration distribution: (a) the rotating wall of without second vane; (b) the stationary wall of without second vane; (c) the rotating wall of with second vane; (d) the stationary wall of with second vane.

Based on the analysis of Figs. 10 and 11, it can be seen that without the influence of the second vane, front purge flow is mixed with the main flow and then ingresses into aft cavity in the affected area of the rotor wake. In the presence of the second vane exists, the purge flow rates of ingress is increased and injects into the deeper wheel-space in the high pressure area of the potential field at the leading edge of the second vane. The presence of the potential field at the leading edge of the vane suppresses the nonuniform distribution of airflow in the disk cavity resulting in the tracer gas concentration almost uniform near the rotating and stationary wall.
3.3 Mainstream unsteady fluctuations
Figure 12 shows the circumferential distribution of the tracer gas concentration and pressure coefficient in annulus ΔC p,a. The positions of upstream point 1 and downstream point 2 of the aft cavity are shown in the figure. The abscissa is the nondimensional vane pitch, and the ordinate is ΔC p,a is defined as:
 \begin{align}\Delta {C_{{\rm{p,a}}}}=\frac{{{{\rm{p}}_{{\rm{a,max}}}}-{{\rm{p}}_{{\rm{a,min}}}}}}{{{\rm{1/2}}\rho {\Omega ^2}{{\rm{b}}^2}}}{\rm{ }}\end{align}
where pa,max is the maximum pressure in the T
r period, pa,min is the minimum pressure in the T
r period, and T
r represents 1/18 of the entire period.
 $\rho$
is the gas density, and Ω is the rotational angular velocity, and b is the radius. Observing Fig. 12(a)(b), it can be found that the distribution of the front purge flow on the upstream and downstream of the aft cavity is consistent with that shown in Fig. 10. The high and low concentration areas are alternated by the influence of the blade wake and the leading edge of the second vane alternately appear. Due to the influence of the potential field at the leading edge of the vane, the downstream tracer gas fluctuates is more uneven than the upstream. Observing Fig. 12(c)(d), for IR = 0, the pressure fluctuation at the upstream point 1 during the T
r period changes more significantly than that of the downstream point 2. The overall wheel-space gap pressure fluctuates drastically. For IR = 0.5% and IR = 0.9%, the upstream and downstream pressure fluctuations of the aft cavity are weakened, and the circumferential position of the high pressure fluctuation area in the upstream of the aft cavity changes due to the enhancement of the blade wake. When the purge flow rate increases to IR = 1.3% and IR = 1.7%, the tracer gas concentration in the upstream and downstream of the aft cavity increases accordingly, and the pressure fluctuation changes sightly.
The ΔC p,a and tracer gas concentration.

The fast Fourier transform is used to analyse the static pressure value of the monitoring point. Among them, the abscissa uses the rotor frequency f
blade for dimensionlessness, and the ordinate pressure value is the difference between the static pressure value of the monitoring point and the average value. The locations of the monitoring points are given in the figure. Monitoring points 1 and 2 are located in the middle of inclined axial seal of the front cavity and the leading edge of the blade near the hub, and monitoring points 3 and 4 are located in the middle of inclined axial seal of the aft cavity and the trailing edge of the blade near the hub. The monitoring point 1 of front cavity and the monitoring point 4 of aft cavity are in the stationary domain, and the blade leading and trailing edge monitoring points 2 and 3 are in the rotating domain. Figure 13 shows the static pressure frequency characteristics of the monitoring points 1 and 2. Monitoring point 1 is greatly affected by the rotation of blade, and the main frequency is the same as the rotation frequency. For IR = 0, due to the ingress of the mainstream for the disk cavity, there is a very strong low-frequency f < f
blade disturbance in the front cavity. The maximum value of the pulsation amplitude corresponds to a frequency of about
 $\,f=0.29f_{\textrm{blade}}$
and
 $\,f=0.72f_{\textrm{blade}}$
. For IR = 0.5%, the purge flow balances the pressure difference between the wheel-space and the main gas path. The low-frequency disturbance amplitude decreases, and the main frequency amplitude increases. The purge flow rates further increases, and it can be seen from Fig. 6 that the ingress basically disappears. The low frequency disturbance of f < f
blade disappears, and the main frequency amplitude decreases.
Static pressure frequency characteristic diagram: (a) monitoring point 1 of front cavity; (b) monitoring point 2 of blade leading edge.

Monitoring point 2 is greatly affected by the flow field of the stator. The main frequency at f = 0.66f blade is consistent with the passing frequency of the vane, and twice the main frequency f = 1.32f blade is the pressure fluctuation caused by the upstream vane. For IR = 0, there is low-frequency pressure fluctuation at f < 0.66f blade, which is mainly caused by the unstable flow in the inlet area of the rotor. For IR = 0.5%, due to the simultaneous presence of ingress and egress at the front cavity, the low-frequency disturbance is enhanced. The egress interferes with the vane wake, resulting in a reduction in the main frequency amplitude. The purge flow rates further increases, the disappearance of ingress and the enhancement of egress cause the disappearance of low-frequency pressure fluctuations and the reduction of the main frequency amplitude.
Figure 14 shows the static pressure frequency characteristics of blade the trailing edge monitoring point 3 and the aft cavity monitoring point 4. It can be seen from Fig. 14(a) that the monitoring point 3 of aft cavity is mainly affected by the upstream flow without second vane, and the main frequency and double frequency are located at f = 0.66f blade and f = 1.32f blade. The low frequency pulsation (f < 0.66f blade) at monitoring point 3 is less affected by the front purge flow rate. The main frequency amplitude increases as the front purge flow rate increases. The main frequency and double frequency of monitoring point 3 in Fig. 14(b) are the same as those in Fig. 14(a). Affected by the leading edge of the second vanes, the main frequency static pressure amplitude of monitoring point 3 increases. The increase of the front purge flow sightly affects the static pressure fluctuation of the monitoring point 3.
Static pressure frequency characteristic diagram: (a) monitoring point 3 of blade trailing edge without second vane; (b) monitoring point 3 of blade trailing edge with second vane; (c) monitoring point 4 of aft cavity without second vane; (d) monitoring point 4 of aft cavity with second vane.

Figure 14(c) the main frequency of the aft cavity monitoring point 4 with second vane is the same as the rotor frequency of the rotor. For IR = 0, there is a strong low-frequency f < f blade disturbance in the aft cavity, and the maximum value of the pulsation amplitude corresponds to the frequency f = 0.05f blade. The amplitude of main frequency drops after the emergence of the front purge flow. As the purge flow rate increases, the amplitude of main frequency rises slightly. The amplitude of the low-frequency pulsation increases or even exceeds the amplitude of the main frequency. Since the purge flow is not applied to the aft cavity, the low-frequency pulsation at monitoring point 4 is caused by the ingress and egress of the main flow and the front cavity purge flow to the wheel-space. After the purge flow rate of front cavity increases, the ingress of aft cavity increases and the low frequency pulsation is strong. In Fig. 14(d), the second row of vanes exists, and for IR = 0 the low-frequency pulsation amplitude is larger at f = 0.02f blade. The front purge flow appears and continues to increase, and the low-frequency pulsation amplitude and the main frequency amplitude are reduced to the same level as the main frequency and low-frequency pulsation amplitude in Fig. 14(c).
4.0 Conclusions
The ingress and unsteady pressure fluctuations of a 1.5 stage axial turbine rim seal with the front and aft wheel-space cavities are numerically studied by means of three-dimensional URANS equations and SST turbulence model. Draw the following conclusions:
-
(1) The inclined axial structure of the rim seal effectively prevents the mainstream from injecting the stationary wall of the front cavity, while the mainstream is more likely to ingress the disk cavity due to the large inclination angle on the rotating wall side. Thus the sealing efficiency of the stationary wall side of the front cavity is higher than that of the rotating wall side. The front purge flow is mixed with the mainstream and then converges into the hub passage vortex, which increases the thickness of the hub boundary layer and raises the radial position of the passage vortex.
-
(2) The aft cavity is affected by the combined effects of the blade and the second vane, and the potential field at the leading edge of the vane greatly influences the variation of airflow in the aft cavity, which enhances the ingress of the mainstream into the aft cavity. The increase of the front purge flow raises the pressure of the blade suction side, which makes the egress between the blade suction side and the second vane suction side weaken.
-
(3) Without the influence of the potential field of the leading edge of the second vane, the front purge flow is mixed with the mainstream and then ingresses the aft cavity in the area. In the presence of the second vane, the front purge flow ingresses into the deeper aft cavity at the high pressure area of the leading edge of the second vane and the airflow rate increases.The potential field at the leading edge of the vane suppresses the nonuniform distribution of airflow in the aft cavity caused by the rotating wall.
-
(4) When the front cavity adopts small purge flow rate, the pressure difference between the mainstream and the wheel-space is balanced. The simultaneous existence of ingress and egress leads to the enhancement of unsteady fluctuations in the wheel-space. The front cavity adopts small purge flow rate, which suppresses the unsteady fluctuation in the wheel-space and the leading edge of blade. The increase in the flow rate in the front cavity has a small effect on the pressure fluctuations in the aft cavity. The potential field of second vane enhances the unsteady pressure fluctuations in the trailing edge of blade and the aft seal cavity.
Funding data
The Natural Science Project of Tianjin Education Commission (2018KJ240); The Graduate Research Innovation Project of Civil Aviation University of China (10502728).
Supplementary material
To view supplementary material for this paper, please visit https://doi.org/10.1017/aer.2022.13