Implications
Beef production systems of temperate regions are experiencing important challenges due to the changes in the environmental conditions as well as the major concern of consumers by animal well-being. This study was conducted to assess the effects of metabolizable energy intake on the physiology, performance and carcass characteristics of finished steers during the summer and winter seasons. Results indicate that weather conditions affected animal performance, particularly wind speed and rainfall in the winter. Thus, cattlemen must consider weather conditions of their regions in their feed yard design as well as their feeding management, particularly the energy intake level.
Introduction
Climate conditions have a great importance on animal production because it impacts the surrounding environment in which animals are raised and reproduced (Mader and Gaughan, Reference Mader and Gaughan2011). In fact, two of three major welfare issues involve environmental subjects, muddy conditions and heat stress (Grandin, Reference Grandin2016). Animals are continuously attempting to achieve homeothermic status, consequently the thermoregulation is a very dynamic process. In addition, it has been established that the environment is a potent factor influencing the rate of energy loss and thereby playing a significant role in the energetic efficiency (National Research Council, 1981). Therefore, season of year affects animal’s maintenance energy requirement, which in turn impacts animal performance (Birkelo et al., Reference Birkelo, Johnson and Phetteplace1991), particularly in average daily gain (ADG) and feed to gain ratio (F : G) (Birkelo and Johnson, Reference Birkelo and Johnson1993). Previous research has demonstrated that cattle in cold wet muddy conditions require more energy and more effort to walk, resulting in lower performance (Dijkman and Lawrence, Reference Dijkman and Lawrence1997). In addition, many feed yards in South America have not been properly designed nor has pen surface been properly prepared. Grandin (Reference Grandin2016) pointed out recently, the lack of peer reviewed scientific studies on the effects of mud on beef cattle. Therefore, a need to study the effects of environmental variables under these particular conditions can provide valuable information to producers and cattle industry in these regions. In addition, there is limited information about the effects of climate on beef production in temperate regions of southern South America. The objective of the present study was to assess the effects of environmental conditions and level of metabolizable energy intake on performance and carcass quality of finished steers.
Material and methods
Two experiments were conducted at the Experimental Research Station of the Universidad Católica de Temuco in Temuco City, Chile, with the approval of the ethics committee for research.
Facilities and animals
It consisted of four pens (six head/pen; 26.25 m2/head) equipped with a Calan Broadbent Feeding System (American CALAN Inc., Northwood, NH, USA), which in turn had a shed protecting the feeding area to prevent equipment and feedstuffs from being affected by rainfall. The facility was located 15 km northeast of Temuco city. Water tanks were shared between fences of pens one-two and three-four. In both experiments, steers were provided by a private company (Ferias Araucanía S.A.) Once steers arrived at the facilities, they were sorted by BW, assigned randomly to two blocks (light or heavy) and then allocated into one of two treatments: T1=1.85 times or T2=2.72 times metabolizable energy intake above maintenance (MEI), according to requirements estimated on BW by using the software of the National Academies of Sciences Engineering and Medicine (2016).
Experiment 1 (Winter)
The experiment had 91 days on feed, beginning on 4 July 2013 and finishing on October 03 of 2013. A total of 24 crossbred steers (Angus×Hereford; BW=420 kg±4.4 kg) arrived on 13 June 2013. There was a pre-experimental period (21 days) that allowed steers to get used and trained with the feeding system and adapted to the facilities. Throughout this period steers were fed ad libitum (100% haylage, Table 1) with free access to water. Subsequently, in the experimental period, steers were fed once per day with the experimental diet (Table 1). The amount of feed offered by group was different in order to adjust the MEI as was established for the treatments.
Amount of ingredients (dry matter (DM) basis, kg/day) at the beginning of the experimental periods for the two studies of finishing steers

ME=metabolizable energy.
1 Diet composition: Experiment 1 (winter): 62% haylage, 8% lupine whole grain and 29% triticale whole grain; Experiment 2 (summer): 64% haylage, 5% canola meal and 30% oat whole grain. Diet energy density in Exp 1=2.69 EM/kg DM and 13.03% CP; diet energy density in Exp 2=2.51 EM/kg DM and 13.04% CP. Salt minerals included a ionophore (Lasalocid sodium 3 mg/g).
2 1.82× and 2.72×=1.82 or 2.72 times metabolizable energy intake above maintenance.
Individual animal BW were recorded by using an electronic scale (Gallagher W300, Hamilton, New Zealand), and then used to calculate average daily gain (ADG, g/day). Likewise, mud depth was recorded twice during the experimental period (23 July 2013 and 21 September 2013) in three different locations of each pen and then averaged. In addition, the amount of mud in the animal´s body was also estimated by using a simple mud score (1=clean; 2=dirty legs; 3=dirty legs and belly; 4=dirty legs, belly and partial sides of the animal; and 5=dirty legs, belly and sides of the animal). Animals received a veterinary treatment (Triclabendazole 10%, 10 ml/100 kg and Ivermectin 1 cc/50 kg), and a growth promoting implant (140 mg Trenbolone Acetate+20 mg estradiol; Intervet, Schering-Plough Animal Health, Kenilworth, NJ, USA) before the experimental period on 3 July 2013.
Tympanic temperature
A total of 16 steers (eight per treatment, four by pen) were randomly chosen to receive a iButton device to collect TT (Maxim Integrated Products Inc., San José, CA, USA). This device was fitted manually into the tympanic canal in the ear allowing the collection of data continuously. After the device was placed, this was cover with absorbent material (Tampax Palitex Edgewell), and subsequently with pipe foam (Isoplast) to give firmness to the structure of the ear pinna, which was wrapped with an elastic bandage (Coban Nexcare 3M, St. Paul, MN, USA). Finally, the elastic bandage was wrapped with adhesive tape for medical use (5 cm wide Leukoplast, BSN Medical, Hamburg, Germany). The devices were programmed to collect TT at intervals of 10 min and installed on 31 July 2013. Subsequently, data were compiled into hourly readings. The criterion to install the devices was made considering the weather forecast. The retrieving of the devices was made 10 days later. During this experiment, a total of six devices were lost (three in each treatment group), finishing with five devices per treatment.
Environmental data collection and thermal comfort indices
Ambient temperature (AT, °C), wind speed (WS, m/s), relative humidity (RH, %), total solar radiation (SR, W/m2) and precipitation (PP, mm/day) were collected continuously at 15 min intervals by using a weather station (Campbell Scientific CR1000, Utah, USA) located at 5 km southeast from the research site. Later, these data were compiled into hourly values to match TT dataset. In addition, these climatic data were used to calculate three thermal comfort indices: (a) Comprehensive climate index, CCI (Mader et al., Reference Mader, Johnson and Gaughan2010); (b) temperature–humidity index, THI (Hahn et al., Reference Hahn, Gaughan, Mader and Eigenberg2009); and (c) the THI adjusted by wind speed and solar radiation, THIadj (Mader et al., Reference Mader and Griffin2006), according to equations given below:
 $${\rm THI}\,{\equals}\,0.8{\times}\,{\rm AT}{\plus}\left( {\left( {{\rm RH}/100} \right){\times}\,\left( {{\rm AT}{\minus}14.4} \right)} \right){\plus}46.4$$
 $${\rm THI}_{{{\rm adj}}} \,{\equals}\,{\rm THI}{\plus}4.51-\left( {1.992{\times}{\rm WS}} \right){\plus}\left( {0.068{\times}{\rm SR}} \right)$$
 $${\rm CCI}\,{\equals}\,{\rm AT}{\plus}{\rm FRH}{\plus}{\rm FWS}{\plus}{\rm FSR}$$
Where:
FRH corresponds to the relative humidity correction factor;
 $$\eqalignno {& e^{{(0.00182{\rm }{\times}{\rm RH }{\plus}{\rm }1.8{\times}10^{{{\minus}5}} {\times}{\rm AT }{\times}{\rm RH})}} {\times}0.000054{\times}{\rm AT}^{2} {\plus}0.00192 \cr & \quad \quad \quad \quad \quad \quad {\times}{\rm AT}{\minus}0.0246{\times}{\rm RH}{\minus}30$$
FWS corresponds to the wind speed correction factor;
 \eqalignno {& $$\left[ {{{{\minus}6.56} \over {e^{{\left\{ {\big[{{1 \over {2.26{\times}{\rm WS}{\plus}0.23^{{0.45}} }}\big]}{\times}{\big[2.9{\plus}1.14{\times}10^{{{\minus}6}} {\times}{\rm WS}^{{2.5}} {\minus}{\rm log}_{{0.3}} \left( {2.26{\times}{\rm WS}{\plus}0.33} \right)^{{{\minus}2}} }\big]} \right\}}} }}} \right] \cr & \quad \quad \quad \quad {\minus}0.0556{\times}{\rm WS}^{2} {\plus}3.33$$
and FSR corresponds to the solar radiation correction factor;
 \eqalignno {& $$0.0076{\times}{\rm SR}{\minus}0.00002{\times}{\rm AT}{\plus}0.00005{\times}{\rm AT}^{{\rm 2}} {\times}\sqrt {{\rm SR}} {\plus}0.1 \cr & \quad \quad {\times}{\rm AT}{\minus}2$$
Experiment 2 (Summer)
The experiment had 95 days on feed, beginning on 23 January 2014 and finishing on 28 April 2014. A total of 24 crossbred (Angus×Hereford) steers (BW=431 kg±10.4 kg) arrived on 4 January 2014. There was a pre-experimental period of 19 days with a diet similar than in Exp 1. In order to fit the MEI supply for treatments T1 and T2 feed intake was different, with a similar approach than in Exp 1. Tympanic temperatures, environmental data and thermal comfort indices were also collected in a similar manner as described in Exp 1. In addition, panting scores (PS) and respiration rates (RR) were collected during 3 days, in the hottest week of the summer (Table 1), from 13 February 2014 to 15 February 2014, according to procedure described by Mader et al. (Reference Mader and Griffin2006). A total of 22 iButton devices were installed in steers (T1=12 and T2=10) on 6 February 2014 and retrieved 10 days later. Four devices were lost during this experiment (three in T2 and one in T1), ending up with nine devices for T1 and T2. In addition, insecticide-impregnated cattle ear tags were applied for control of horn flies (Moskimat Drag pharma/Expert Plus Intervet Schering-Plough Animal Health, 11 January 2014) and the same growth promoting implant described in Exp 1 on 23 January 2014. During the summer mud depth was not measured, because no mud was present.
Respiration rates (breaths per minute=bpm) were collected twice by counting 20 movements on each animal’s flank and timing the required time during those days, in the morning starting at 0900 h and in the afternoon at 1500 h. The criterion to install the devices and measure RR was done based on weather forecast.
Carcass data collection
Steers were slaughtered in Temuco city after 91 and 95 days on feed for experiments 1 and 2 respectively. In both experiments, the goal was to reach a minimum of 90 days on feeding. Carcass data included: cold carcass weight, rib eye area, longissimus muscle pH, fat coverage, kidney–pelvic–heart fat (KPH), back fat and marbling. After slaughtering, carcasses were kept in cold chambers at a temperature of 3°C by 48 h. Later the carcasses were opened between the 12th and 13th (Exp 1) and 9th and 10th rib (Exp 2) from where data were collected. The complete external fat coverage was estimated by the official certification personnel of the slaughterhouse (Tecno-Carnes Ltda.), based on the Chilean Standard of Classification (INN, 2002), as well as the muscle pH values. In Exp 1 data of 23 animals were collected because one animal from 2.72 EMm diet was removed from the experiment 50 days before the slaughter date due to a minor leg injury not related with the treatments, which affected its normal displacement in the pen.
Statistical analysis
Only days with full TT and weather data were considered, for the analysis. The analysis was performed considering a randomized complete block design (blocking factor=BW) with a factorial arrangement of 2×2, with season and level of MEI as main factors. Each animal was considered as an observational and experimental unit, the level of significance was 0.05. All numerical variables were analysed by ANOVA test. The statistical model used for the analysis was:
 $Y_{{ijk}} \,{\equals}\, \mu {\plus}\alpha _{i} {\plus}\tau _{j} {\plus}\beta _{k} {\plus}(\alpha \tau )_{{ij}} {\rm }{\plus}{\epsilon}_{{ijk}} $
, where μ is the general mean,
 $\alpha _{i} $
the level of MEI effect,
 $\tau _{j} $
the season effect,
 ${\rm }(\alpha \tau )_{{ij}} $
the interaction of season and MEI,
 $\beta _{i} $
the block effect and
 ${\epsilon}_{{ijk}} $
the experimental error. The statistical package used for the analysis was JMP 11 (SAS Institute, Cary, NC, USA). Likewise, TT and RR were modelled using a repeated measurements analysis (MIXED procedure of SAS 9.1; SAS Institute) with TT as the dependent variable with day, season, hour and MEI levels and their interaction as independent variables in the model, being the hour the repeated measured. The random effect was animal (MEI). In addition, RR was also a dependent variable with day, hour and MEI levels and their interaction as independent variables in the model. The random effect was also animal (MEI). Finally, a principal component analysis was performed for the following variables: cold carcass weight (CCW, kg); back fat (BF, mm); rib eye area (RA, cm2); dressing (%); beef pH; final body weight (FBW, kg); tympanic temperature (TT, °C); and the mean values of the climatic variables (AT, WS, SR, RH, PP) for those days in which TT was also collected. The analysis was performed in JMP statistical package (JMP 12.0, SAS Institute) based on the correlation matrix given the scale differences in the variables included. The correlations were estimated by using the REML method.
Results
Weather variables and tympanic temperatures
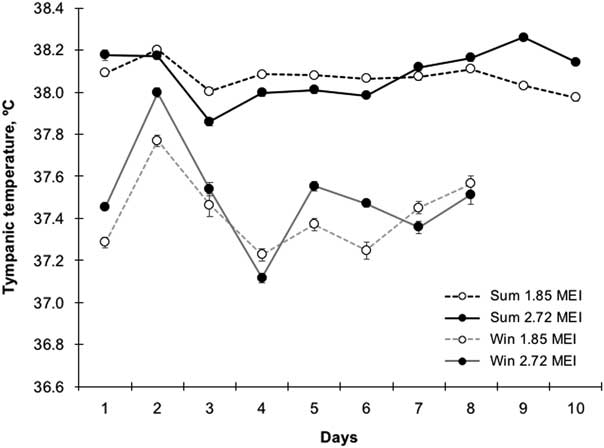
Table 2 shows a summary of daily mean values (±standard error of the mean) for meteorological variables and TT. As expected, mean values of AT, SR, THI, THIadj and CCI were greater in the summer by ∆=9.6°C, ∆=196.0 W/m2, ∆=15.0, ∆=30.9 and ∆=15.8°C, respectively. Daily mean values of RH, WS and PP were greater in the winter experiment by ∆=15.1%, ∆=1.3 m/s and ∆=11.6 mm/day, respectively. During the summer, daily mean TT presented higher values and also a more homogeneous pattern than during the winter (Figure 1) independent of the level of MEI. By contrast, values of TT were much more variable in the winter, presenting a strong drop on day 2. This coincides with an increase in the values of WS and PP (Table 2 and Figure 1). After the fifth day in the winter study, TT decreased again but in this case in a lower magnitude, in that day PP was the highest but WS was moderate.
Mean daily tympanic temperatures of steers fed with two levels of metabolizable energy intake above maintenance requirements and by season for those periods of data collection (Sum=summer season and Win=Winter season; 1.85 MEI=1.85 times metabolizable energy intake and 2.72 MEI=2.72 times metabolizable energy intake).

Summary of average daily values for climate and tympanic temperature (standard error of the mean) of finished steers fed with two levels of metabolizable energy intake above maintenance requirements during days of tympanic temperature data collection in both seasons

AT=air ambient temperature; RH=relative humidity; WS=wind speed; SR=solar radiation; THI=temperature–humidity index (dimensionless); THIadj=temperature–humidity index (dimensionless) adjusted by WS and SR; CCI=comprehensive climate index (°C); PP=rainfall; TT=tympanic temperature.
There was a trend for an interaction season×MEI on mean daily TT (P=0.09). There was also an effect of main factors (P<0.001 and P=0.0063). Steers fed with 1.85 and 2.72 times MEI averaged 38.0°C and 38.1°C±0.01°C during summer experiment, whereas in the winter experiment averaged 37.4°C and 37.5°C±0.02°C, respectively.
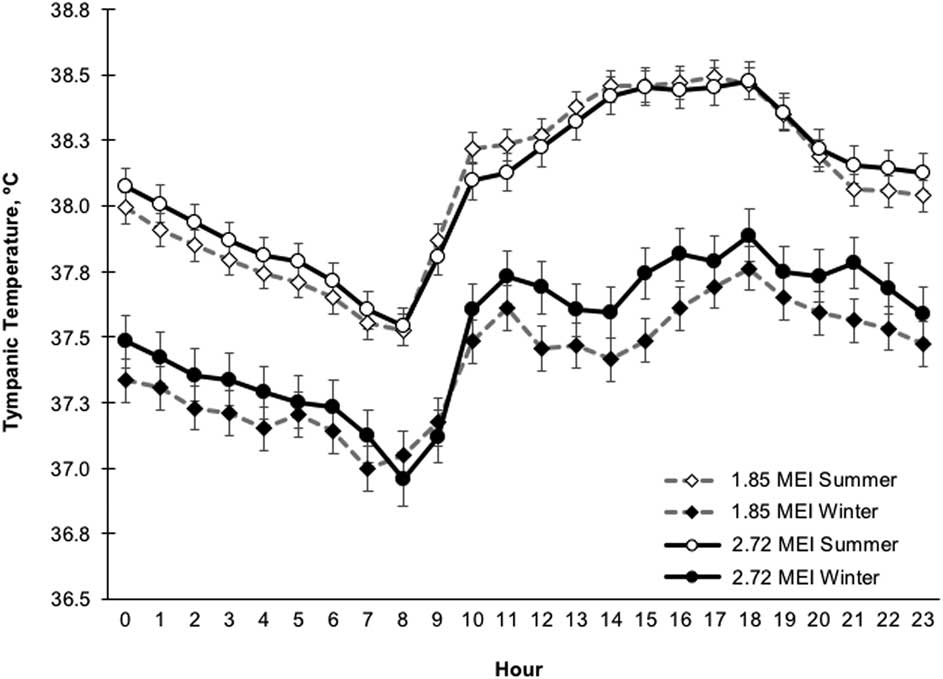
No interaction of season×MEI×hour was found for hourly mean TT (P=0.9862), but there were interactions for season×hour (P<0.0001), season×MEI (P<0.0001) and hour effect (P<0.0001). Figure 2 shows the hourly mean TT values for both seasons and MEI levels fed to steers. In general, patterns of TT were similar between seasons, showing minimum TT early during the morning (0700 to 0800 h) to quickly increase later during the day, reaching the maximum TT between 1700 and 1800 h. Nevertheless, during the winter the increase in TT was less sharp than during the summer. In addition, steers showed a lower TT during the winter season (∆=0.62°C less), through hours of the day, independent of the MEI level fed. Only in the winter season, there were some hours of the day when steers fed with higher MEI showed different TT (or tended to be different), than steers fed 1.85 times MEI. These differences were observed at 1200; 1500 and 2100 h (P=0.07; P=0.04; and P=0.08, respectively).
Mean hourly tympanic temperatures of steers fed with two levels of metabolizable energy intake above maintenance requirements during the summer and winter experiments (1.85 MEI=1.85 times metabolizable energy intake and 2.72 MEI=2.72 times metabolizable energy intake).

Animal performance and carcass quality
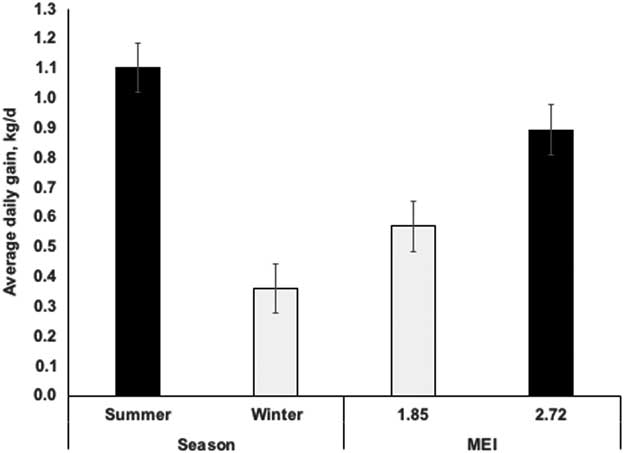
No interaction between season×MEI level was observed for ADG (P=0.7859), but there was an effect of season (P<0.0001) and MEI level (P=0.0088). The performance of steers was better during the summer period in comparison to the winter period (1.10±0.11 v. 0.36±0.06) kg/day, as presented in Figure 3. Similarly, animals fed with the higher MEI level across seasons, showed a greater ADG (0.89±0.12 v. 0.57±0.10) kg/day.
Least squares mean values (standard error of the mean) for the average daily gain of steers fed with two levels of metabolizable energy and by season (MEI=1.85 or 2.72 times metabolizable energy intake above maintenance requirements).

A summary of carcasses variables across seasons and MEI levels are presented in Table 3. Only cold and hot carcass weight showed an interaction between season×MEI level. However, for all the variables there was a season effect (P<0.0001), with the exception of Back fat, that ranged from 2.93 to 4.46 mm. Values of muscle pH were lower and less variables during the summer season, with only two samples showing values above 5.8 but below 6.0, whereas 13 samples were observed in the winter study, with four of them with pH values above 6.0. The rib eye area was 2.1 times greater in the summer experiment, but the KPH was 1.8 times greater in the winter experiment. Fat coverage was greater in the summer time, but the dressing percentage was lower by ∆=6%.
Least square means (standard error of the mean) of carcasses variables of finished steers fed with two levels of metabolizable energy intake above maintenance requirements and by season

MEI=metabolizable energy intake above energy maintenance requirements; SEM=standard error of the mean; KPH=kidney–pelvic–heart fat.
* Back fat, pH, and rib eye area were measured between the 12th/13th in the winter, and between 9th/10th rib in the summer. This change was done by slaughter plant personnel.
† Adipose tissue covering the outer face of the carcass (from 0=no adipose tissue to 3=abundant adipose tissue, without being excessive and its distribution) Official Chilean Standard NCh 1306, of 2002.
Environmental stressors
During Exp 1, mud accumulated in the pens increased (P=0.0261) with days of feeding, averaging 11.2 and 16.1±1.7 cm for 23 July 2013 and 21 September 2013, respectively. No differences were observed for mud depth between pens for each date. In addition, no differences in mud scores (MS) were observed for 23 July 2013 (P=0.46), MS=3.37 v. 3.95±0.22 for 1.85 and 2.72 times MEI, respectively, neither for 21 September 2013 (P=0.38), MS=4.16 v. 4.40±0.20 for 1.85 and 2.72 times MEI. However, there was a difference between the two dates (P=0.0036), MS=3.82 v. 4.28±0.15 for 23 July 2013 and 21 September 2013, respectively.
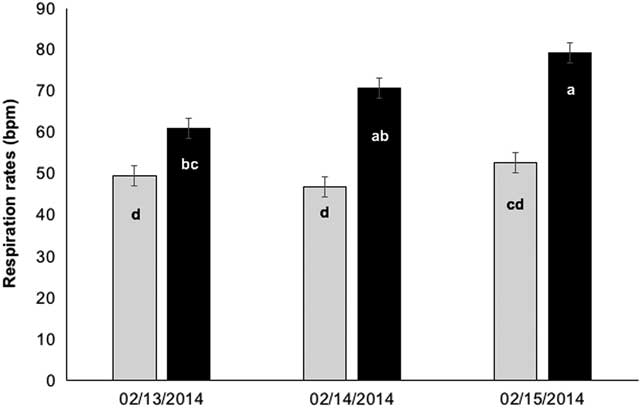
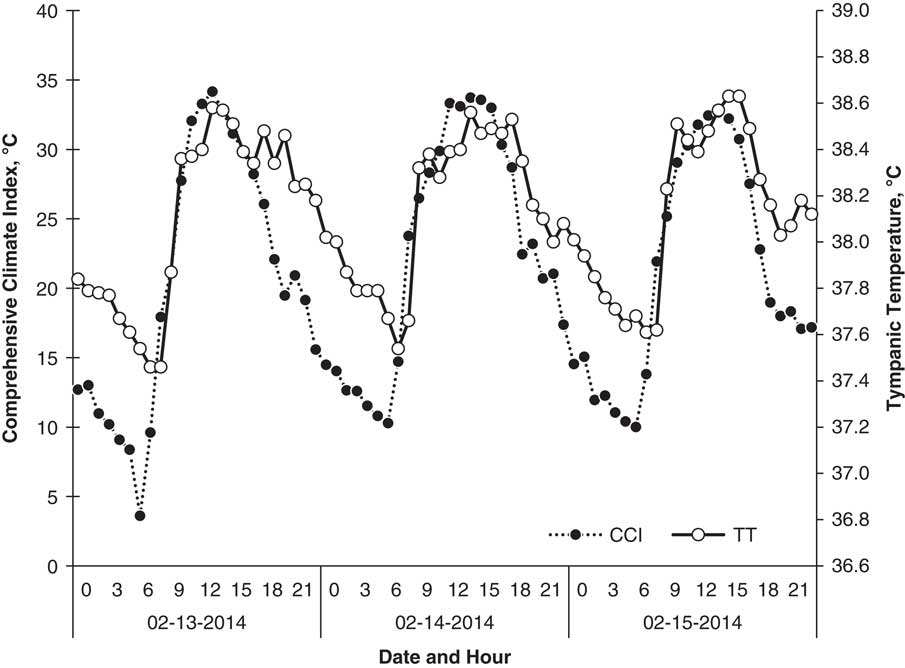
In Exp 2, none of the daily mean values of thermal comfort indices assessed were above the critical ones: 68 for THI and 25°C for CCI. However, during the 10 days of TT collection, a total of 18.33% of hours (44 h) had CCI values ⩾25°C. In addition, in those days where RR were collected (13 to 15 February), the number of hours with CCI ⩾25°C had a mean of 9.3 h/day, concentrated between 0900 and 1800 h. Respiration rates were greater at the third day of collection (P=0.005). In addition, RR increased after midday from 49.8 to 70.3±2.5 bpm (P<0.0001), whereas TT reached mean values of 37.90°C±0.04°C and 38.45°C±0.02°C, AM and PM respectively (P<0.0001). In fact, the CCI values of these hours in days where RR were collected, averaged 30.6°C; 31.05°C; and 30.2°C, respectively. These uncomfortable thermal conditions were reflected in an increase of RR in the afternoon measurements (Figure 4), but during the mornings no differences were observed across days of evaluation. Finally, CCI showed a great fluctuation during the day, as shown in Figure 5, with one mean daily amplitude of 25.6°C between the maximum and minimum CCI.
Least squares mean values (standard error of the mean) for respiration rates (bpm=breaths per minute) per day and moment of the day (grey columns=before noon and black columns=afternoon) of steers fed with two levels of metabolizable energy intake above maintenance requirements. Different letters in the bar represent statistical differences (Tukey’s test, P<0.05).

Hourly least square mean values of the comprehensive climate index (CCI) and the tympanic temperature (TT) of steers fed with two levels of metabolizable energy intake above maintenance requirements for each day of respiration rate data collection of the summer experiment.

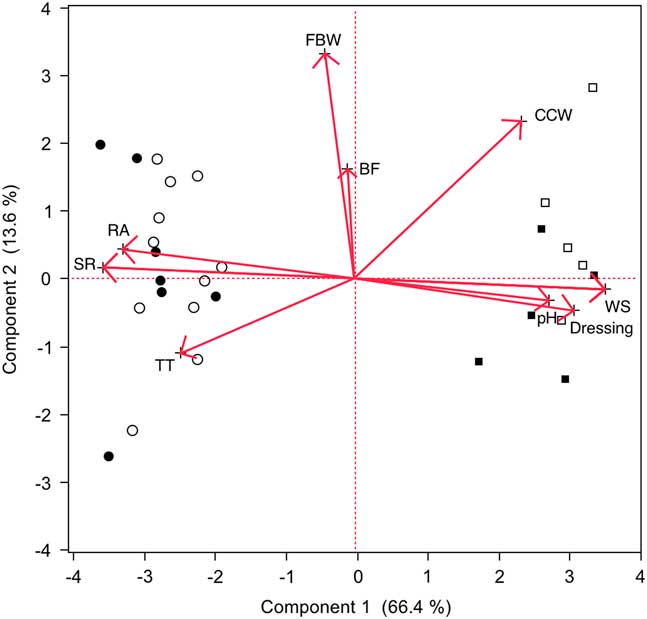
The first two components (Figure 6) explain 80.0% of the observed variance. Adding a third component improves it to an 88.7%. The first component separates clearly the summer and winter experiments and is positively affected by CCW, dressing, pH, RH, PP and WS variables, whereas is negatively affected by the SR, AT, RA, TT variables. On the other hand, the second component is positively affected by BF and FBW variables, which in turns are highly correlated. Steers fed during the summer had higher RA and TT. On the contrary, the steers finished during winter showed a higher pH, which makes sense because they were exposed to more rainfall, WS, RH and less AT (environmental stressors).
Bi-plot (score plot and the loading plot) of the two first principal components of steers finished with two levels of metabolizable energy intake during the summer and winter seasons. SR=solar radiation (W/m2); TT=tympanic temperature (°C); RA=Rib eye area (cm2); FBW=final live BW (kg); BF=back fat (mm); CCW=cold carcass weight (kg); WS=wind speed (m/s); dressing=dressing percentage; and pH=degree of acidity of the beef carcass (●=summer 2.72 times metabolizable energy intake above maintenance requirements (MEI); ○=summer 1.85 times MEI; ◼=winter 2.72 times MEI; ◻=winter 1.85 times MEI).

Discussion
Most of the previous studies, regarding environmental effects, have been focused on heat stress in dairy and beef cattle including: performance (Mader and Davis, Reference Mader and Davis2004, Bernabucci et al., Reference Bernabucci, Biffani, Buggiotti, Vitali, Lacetera and Nardone2014), animal metabolism (Baumgard and Rhoads, Reference Baumgard and Rhoads2013), fertility (Ferreira et al., Reference Ferreira, Ayres, Chiaratti, Ferraz, Araujo, Rodrigues, Watanabe, Vireque, Joaquim, Smith, Meirelles and Baruselli2011), gene expression (Rhoads et al., Reference Rhoads, La Noce, Wheelock and Baumgard2011, Howard et al., Reference Howard, Kachman, Snelling, Pollak, Ciobanu, Kuehn and Spangler2014) and nutrition (Mader and Davis, Reference Mader and Davis2002, Smith et al., Reference Smith, Chapa, Willard, Herndon, Williams, Crouch, Riley and Pogue2006) among others. On the contrary, cold stress has received less attention (Young et al., Reference Young, Walker, Dixon and Walker1989), with an emphasis on the lower critical temperature and its impact on the same variables before mentioned, probably, because cattle naturally has a greater level of adaptation to it.
In many regions of North America (Canada and United States) muddy conditions are limited to 4 months, mainly due to snow melting and ground thawing. However, rainfall seems to be less important (Grandin, Reference Grandin2016). On the contrary, in regions with humid-temperate climate, winter season is characterized by abundant rainfall (up to 800 mm/year), creating important muddy conditions as well as almost a lingering wet hair coat condition. In fact, at the experimental site location rainfall season can extent to at least 5 to 7 months. Indeed, during the last 35 years there was an average of 134 days with rainfall and an accumulated precipitation of 1010 mm/year. Thus, mud depth and mud in animal’s body depends on the amount of precipitations and cattle management (density, BW, soil properties). Few studies have been conducted in humid-temperate regions that compare the effects of environmental factors on animal welfare and animal performance. However, there exists an increasing concern by producers and government agencies about these topics, which in turn may also be associated with climate change.
The differences in TT observed between seasons seem not to be biologically important. In addition, they are in agreement with the results previously reported by Arias et al. (Reference Arias, Mader and Parkhurst2011), who reported a greater TT during the summer without differences due to the level of energy intake. In addition, they also reported a difference in TT due to energy intake during the wintertime, coinciding with our results. These differences can be explained due to a higher amount of direct solar radiation being received by the animals in the summer season (Arias, Reference Arias2008), but also because different genes have been associated with body temperature regulation during winter and summer seasons (Howard et al., Reference Howard, Kachman, Snelling, Pollak, Ciobanu, Kuehn and Spangler2014). In fact, it has been established that animal performance varies between breeds (Pesonen et al., Reference Pesonen, Honkavaara and Huuskonen2012). This could be explained in part by the different energy requirements for maintenance as well as per the composition of the gain (NRC, 1981; NASEM, 2016). As consequence, the present results may differ according to the genotype. During the winter experiment, unlike that observed in the summer, mean values of TT dropped sharply after the second day of data collection. This could be explained by changes in the climatic conditions with an increase of both precipitations and wind speed (Table 2). Thus, PP increased almost 10 times (from <2 to almost 20 mm/day) on days three and four; whereas WS increased 1.6 and 2.8 times, respectively. Similarly, on days 6 and 7 there was also an increase in PP, even greater than days three and four, but the increase in WS was moderate. The previous conditions favoured mud formation which in turns affect animal welfare and animal performance by increasing energy of maintenance requirements and feed intake (Mader and Gaughan, Reference Mader and Gaughan2011). In addition, mud is of great concern regarding contamination of the carcass (Garcia et al., Reference Garcia, Nicholson, Hoffman, Lawrence, Hale, Griffin, Savell, VanOverbeke, Morgan, Belk, Field, Scanga, Tatum and Smith2008). Thus, the combination of WS and PP have an important role in the thermal balance during the wintertime (Mader and Griffin, Reference Mader, Davis and Brown-Brandl2015), even though the values of AT were above 0°C, as such pointed out by Brownson and Ames (Reference Brownson and Ames1980), who indicate that a steer may experience cold stress at 15.6°C if its hair coat is wet. The relevance of WS was also discussed by Angrecka and Herbut (Reference Angrecka and Herbut2015) in a study of dairy cattle in a free stall barn. Thus, changes in the winter weather conditions implies adjustments in cattle behaviour (Graunke et al., Reference Graunke, Schuster and Lidfors2011).
Energy intake has been also reported as a factor affecting carcass quality (McCarthy et al., 1985; Sami et al., 2006), with animals fed with higher energy diets showing greater hot carcass weight and better quality grades (Berthiaume et al., Reference Berthiaume, Mandell, Faucitano and Lafreniere2006). In addition, other researchers have reported changes on digestibility of organic matter and ether extract as well as changes in blood metabolite concentrations (Fiems et al., Reference Fiems, Vanacker, De Boever, van Caelenbergh, Aerts and De Brabander2007). There is also an effect of season of the year on percentage choice cattle (Birkelo and Johnson, Reference Birkelo and Johnson1993).
During the summer experiment, the mean AT for the week of TT collection was 16.6°C. However, 50% of those days presented maximum AT above 25.0°C, averaging 28.5°C. Nevertheless, during night time the AT averaged 7.5°C, that is a drop of 21.04°C. This great difference in AT between day and night allowed for the dissipation of heat load accumulated during the day. In addition, none of the daily mean values of thermal comfort indices exceeded the thresholds established in the literature, that is, THI=68 (Zimbelman et al., Reference Zimbelman, Rhoads, Rhoads, Duff, Baumgard and Collier2009) and CCI=25.0°C (Mader et al., Reference Mader, Johnson and Gaughan2010). Nevertheless, daily maximum values for those days in THI, THIadj and CCI were 75.5, 79.9 and 34.2°C, respectively. The previous was in agreement with the signs of thermal discomfort showed by the animals (increase in RR), that showed an average of 20 breaths per minute more during the afternoon when compared with the morning. Similarly, Gaughan and Mader (Reference Gaughan and Mader2014) in a study conducted in Queensland Australia, reported greater RR and panting scores during the afternoon, which in turns resulted in higher body temperature. In addition, these authors concluded that there is a close relationship between RR and body temperature. This discomfort observed in the animals (higher RR), could be associated with the largest solar radiation received between 0900 h and 1800 h that averaged 683.2±26.8 W/m2. In contrast, the rest of the hours of the day averaged 142.0±16.4 W/m2.
On the other hand, ADG observed in the summer season were in line with those projected by the NRC Beef model (National Academies of Sciences Engineering and Medicine, 2016), but were lower than projected under thermoneutral conditions by the model in the winter time, where the expected ADG were 0.4 and 1.07 kg/day for treatments 1.85 times and 2.72 times MEI, respectively. However, observed ADG was reduced in 50.5% and 42.5% each. The combination of low temperatures, hair wet coat, mud in the body and mud depth in the pen could explain this difference in ADG (Mader, Reference Mader2011). Rayburn and Fox (Reference Rayburn and Fox1990), indicated that the ADG decreased more as the AT continues decreasing under 20°C. In addition, they point out that there exists a great sensibility in ADG due to WS and hair wet coat. For example, animals with hair wet coat decreased ADG in 8.2% and 46.4% when AT dropped from 20°C to 10°C and 0°C, respectively. Similarly, animals with wet hair coats and exposed to WS of 1.78 m/s showed a decrease of 44.3% in ADG. In the same context, Morrison et al. (Reference Morrison, Givens, Garrett and Bond1970) reported that ADG decreased by 14.69% when cattle were exposed to 10 min/h of artificial rainfall and also a 30.17% due to muddy conditions in the pen. In our study, mean AT and WS for all the feeding period of the winter experiment were 8.09°C±0.09°C and 2.02±0.03 m/s, whereas there were only 44 days without PP. Thus, steers had its hair coat wet at least 69.7% of days of feeding. Finally, using a similar methodology to assess mud in the animals´ body, Honeyman et al. (Reference Honeyman, Maxwell and Busby2012) found no difference in mud scores between winter and summer seasons. We did not record mud depth in the summer experiment.
In the winter study, the first measurement of mud depth was done 41 days after steers occupied the pens. Accumulated rainfall to that date was 210.4 mm, whereas the second measurement was done after 102 days of pen occupation with another 278.1 mm of accumulated rainfall. During the last 45 days, accumulated precipitation declined to 40.2 mm. Thus, mean rainfall was (5.13; 4.71; and 0.89) mm/day for each period. The accumulation of mud negatively affected animal performance, achieving lower ADG, when compared summer v. winter. On the contrary, summer performance was 3.1 times better than winter, whereas steers fed with higher MEI diet had 1.6 times better performance than steers fed with a low MEI level. The last value is in accordance with the differences in MEI provided between treatments which was a ratio of 1.5 times. This demonstrates the strong effect of environmental conditions on animal performance.
From a productive and economic point of view, the winter period proved to be the most critical. There was a great inefficiency during the winter period, as F : G ratio was 3.8 times greater in the winter than the summer. That is, steers consumed 28.8 kg of DM to produce one kg of BW, whereas in the summer they needed only 7.6 kg of DM. These differences increased when the energy level of the diet was considered. Thus, during the winter, steers fed with 1.85 times the MEI consumed 39.6 kg of DM for each kg of BW gained. Meanwhile, those fed 2.72 times MEI required 18.0 kg DM (2.2 times less feed). However, in the summer experiment both values were similar, requiring 7.14 and 8.01 kg of DM for each kg of BW gained for 1.85 and 2.72 times the MEI, respectively.
The MEI had a direct effect on the TT and ADG of steers finished during the winter period in an open feedlot. In addition, both variables were directly affected by weather conditions, particularly WS and PP (rainfall), as well as feed conversion. On the contrary, during summer period MEI level fed to steers did not affect TT neither ADG.
Acknowledgements
This work was supported by a grant from the Chilean National Fund for Science and Technology (FONDECYT, Project 11121320; Santiago, Chile).
Declaration of interest
The authors of the manuscript declare that there is no conflict of interest including financial, non-financial and relationships.
Ethics statement
The authors assert that all procedures contributing to this work comply with the ethical standards of the relevant national and institutional guides on the care and use of farm animals.
Software and data repository resources
The datasets generated in the current study are available from the corresponding author on reasonable request.