


Introduction
The Earth’s surface temperature has risen dramatically since the late 20th century Reference Solomon(Solomon and others, 2007). As glaciers react sensitively to climate, they are often considered a key indicator Reference Oerlemans(Oerlemans, 1994). Widespread glacier retreat in many parts of the world supports this (Reference MaischMaisch, 2000; Reference BolchBolch, 2007; Reference Schneider, Schnirch, Acuña, Casassa and KilianSchneider and others, 2007). These changes are documented by periodic inventories of the glaciers, but their compilation requires much time and effort. However, remote-sensing techniques have made this easier, so satellite data are now used more often for monitoring glacier extent and changes (Reference Bishop, Shroder, Hickman and CoplandBishop and others, 1998; Reference Silverio and JaquetSilverio and Jaquet, 2005; Reference Strozzi, Kouraev, Wiesmann, Wegmüller, Sharov and WernerStrozzi and others, 2008), and for establishing databases to assess these changes at a regional and global scale (Reference KollmeyerKollmeyer, 1980; Reference BishopBishop and others, 2004; Reference Raup, Racoviteanu, Khalsa, Helm, Armstrong and ArnaudRaup and others, 2007).
Examples of projects being carried out worldwide include those contributing to the World Glacier Monitoring Service (WGMS; Reference HaeberliHaeberli, 1995) and to the Global Land Ice Measurements from Space (GLIMS) project (www.glims.org) such as the national glacier inventories of China Reference Shi, Li, Ye, Liu and Wang(Shi and others, 2008) and Chile (Reference Casassa, Smith, Rivera, Araos, Schnirch and SchneiderCasassa and others, 2002). These projects aim to monitor the extent, changes and dynamics of glaciers using satellite data, and to assess causes of the observed changes and their implications for human activities and other environmental changes (Reference BishopBishop and others, 2004; Reference KargelKargel and others, 2005). The accuracy and the timeliness of an inventory depend on the availability of satellite imagery such as the Landsat Thematic Mapper (TM)/Enhanced TM (ETM), Advanced Spaceborne Thermal Emission and Reflection Radiometer (ASTER) and Système Probatoire pour l’Observation de la Terre (SPOT2/4/5); that used for the GLIMS project is mostly from the ASTER sensor.
The Tibetan Plateau has been called the World’s Roof. It is the largest and highest plateau on Earth (Fig. 1), covering 1.2 x10⁶ km2 with an average height >4000ma.s.l. Reference Zheng and Zhu(Zheng and Zhu, 2000). The plateau has many glaciers whose meltwater contributes to the source of major rivers, such as the Yellow, Yarlung Zangbo and Yangtze. Several Chinese glacier inventories have been published in the last 20 years (Reference Shi, Li, Ye, Liu and WangShi and others, 2008,Reference Shi, Liu and Kang2009), and a ‘Chinese National Glacier Information System’, based on these inventories, was established in 2004 (Reference Cao, Li, Chen and WangCao and others, 2006). While this work was all based on air photos or satellite data acquired prior to the 1980s, a new inventory supported by the latest methods and new satellite imagery became a priority.
Nianchu river basin showing the two weather stations and the glacierized southern and eastern parts. The background is a SPOT4 image from 9 December 2002.

The study reported on here is part of a new project entitled ‘National Glacier Inventory and Glacier Changes in China’, initiated in 2007. The satellite data used are from SPOT5 and the DEM was generated from 1 : 50 000 scale topographic maps with a contour interval of 20 m.
Study Area
The Nianchu river basin (28°10'–29°20' N, 88°35'–90°15' E) is a tributary of the middle reaches of the Yarlung Zangbo river, on the southern Tibetan Plateau. The basin elevation ranges from >5000ma.s.l. in the southeast to almost 4000ma.s.l. in the northwest. The glaciers are located on the southeastern edge (Fig. 1); the valley contains croplands while the rest of the basin is mostly grassland.
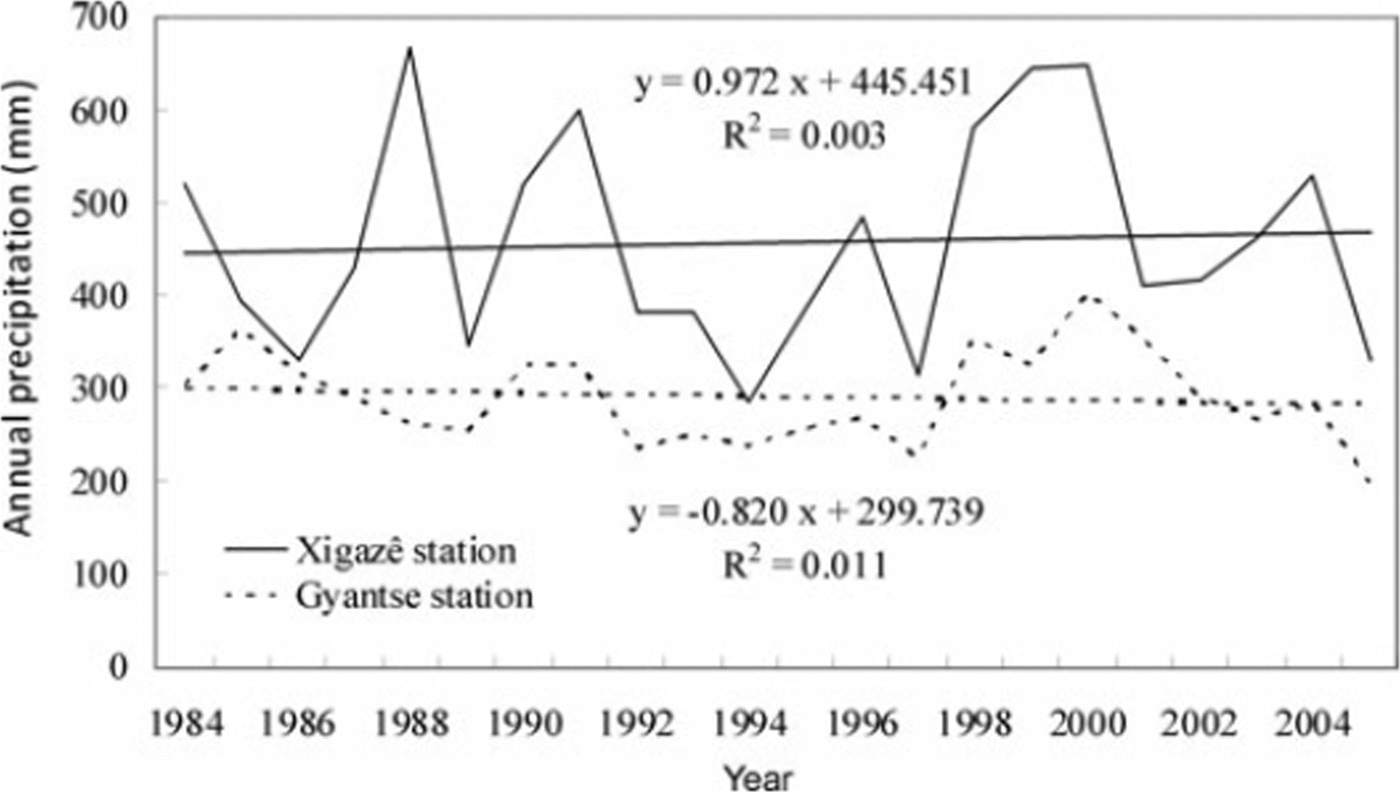
Because of the barrier created by the Himalaya, the climate of the basin is characterized by plateau semi-arid conditions with obvious humid and arid seasons. The average annual precipitation recorded at the Xigazê (3836m a.s.l.) and Gyantse (4090ma.s.l.) weather stations is only 430 and 288 mm, respectively, while the average annual air temperatures are 6.3°C and 4.7°C, respectively. At Gyantse, 94% of the total precipitation occurs between July and September.
The total glacierized area is 224 km2, about 2% of the basin area. All glaciers belong to the summer-monsoon precipitation type. The elevation of glacier tongues is high and glacier movement relatively slow.
Methods and Data
Climate
The analysis of climate change in the Nianchu basin was based on two long-term temperature and precipitation series from the Xigazê and Gyantse weather stations. As the quality of the series was not well known, it was tested for inhomogeneities both by visual checking of the graphs and by correlation analysis. Glacier variations were then related to trends in air temperature and precipitation.
Glacier inventory
The glacier inventory was compiled mainly using remote-sensing and geographical information system (GIS) techniques. The primary data sources included orthorectified SPOT5 and Landsat TM images. A high-resolution DEM was used to orthorectify the images. The complete work-flow schema/diagram is presented in Figure 2. All photogrammetric processing was carried out at the Institute of Geographic Sciences and Natural Resources Research, Chinese Academy of Sciences. ENVI version 4.3 software was used to process the images, and ArcGIS version 9.2 to edit the glacier extent, extract glacier parameters, produce the glacier inventory and analyze glacier changes.
Flow chart of glacier inventory based on satellite data.
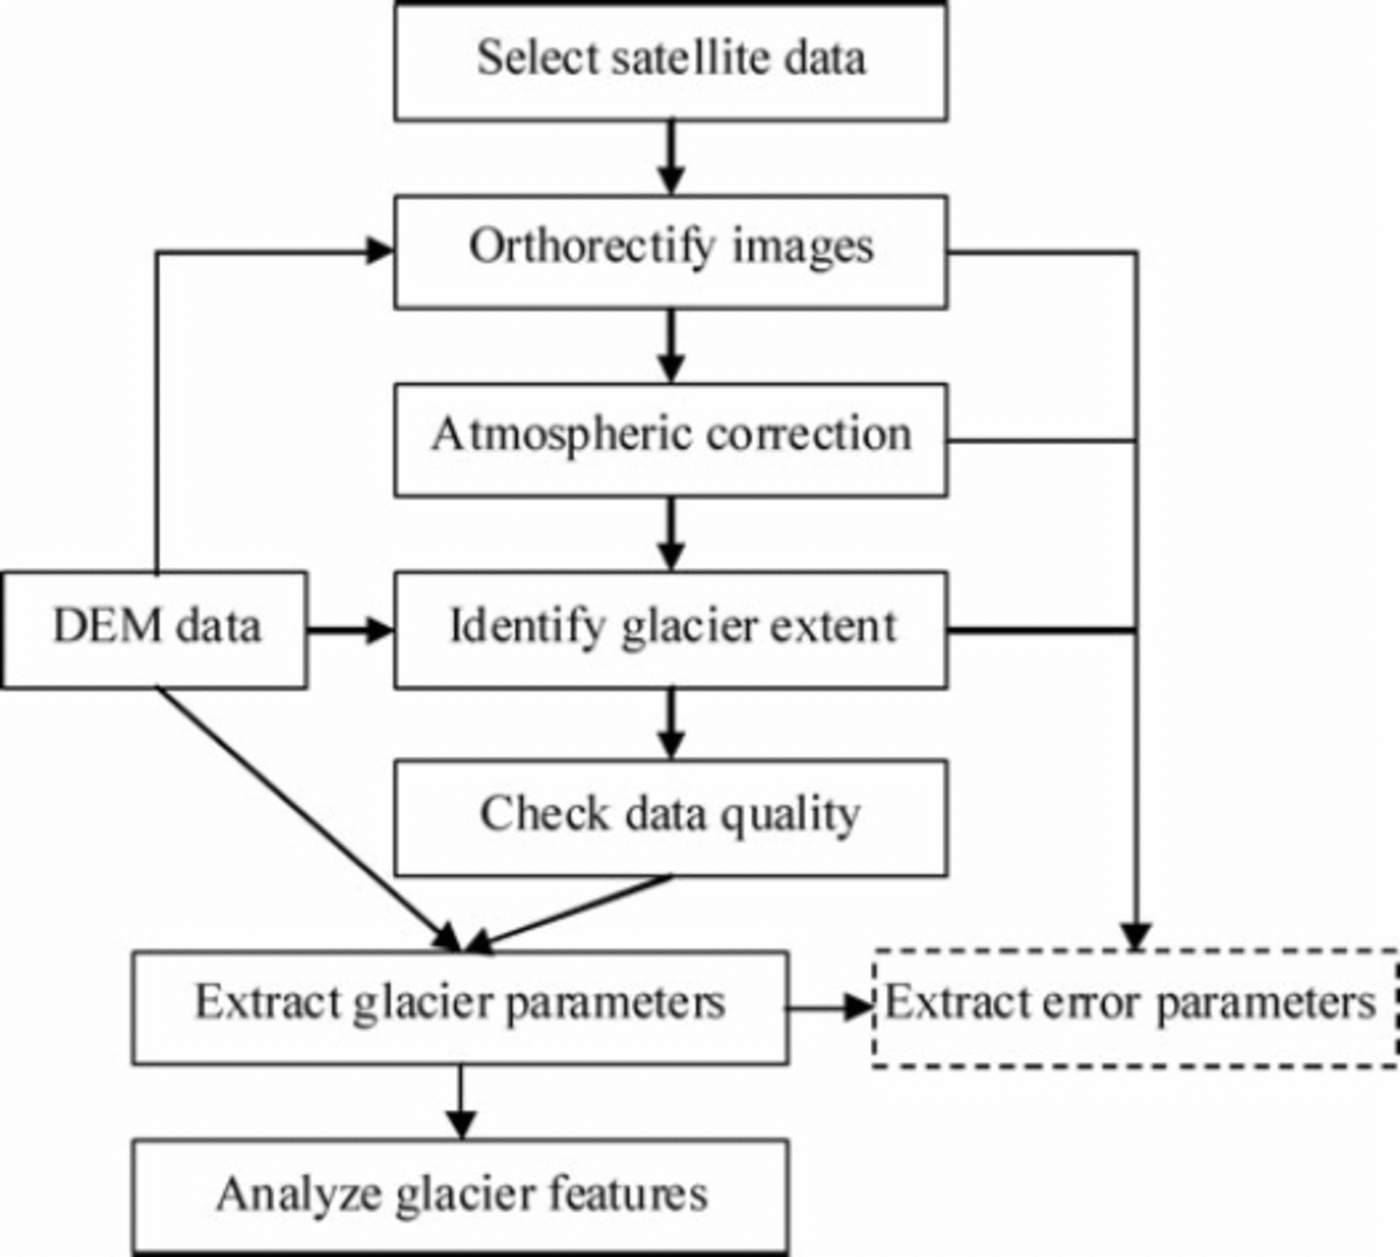
A ratio method and manual interpretation were combined to identify the glacier extent. The ratio of TM4/TM5 was used for TM/ETM images (Reference Jacobs, Simms and SimmsJacobs and others, 1997). Pixels with a ratio value >3 were interpreted as glaciers. For 2005, the outline of glaciers was derived manually from a panchromatic SPOT5 image. A preliminary glacier boundary was generated automatically from the ratio method. An interpreter then revised it, on the basis of auxiliary data (e.g. ASTER and SPOT2/4), to remove errors, i.e. snow or cloud that was similar to glacier ice, and added parts missed by the automatic interpretation, i.e. steep parts obscured by shadow that were hard to distinguish in the satellite image. The final glacier outlines were overlaid on Google Earth to check their accuracy and reliability.
The inventory of the Nianchu river basin includes five layers: glaciers, glacial lakes, rivers, central flowlines and mountain ridges. For the glacier layer, 40 parameters were registered that could be classified into five categories: glacier identity, glacier location, glacier geometry, glacier character, and reference information. For this study, the analysis of change focused mainly on the geometric parameters of glacier area and glacier length. Glacier area was calculated as the total area of a glacier including parts covered by surface debris or moraine. Glaciers <0.01km2 were not included. Length was measured along the centre line; if there were compound basins, the length was calculated as an average of each branch length rather than the longest flowline.
The six parameters registered for the glacier lake layer were ID, lake name, area, perimeter, class and elevation. Lake class was based on its relationship to the adjacent glacier. Glacier-lake elevation was calculated from the DEM.
Datasets
About 20 DEMs covering the entire glacierized area of the Nianchu basin were obtained from the China State Bureau of Surveying and Mapping. They were generated from 1 : 50 000 scale topographic maps with a contour interval of 20 m, and have a spatial resolution of 30 mx30m (Table 1).
Satellite data and DEM used in the study
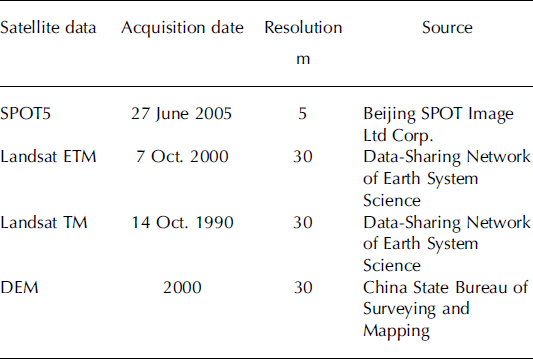
The current ice cover was mapped using a SPOT5 scene from 27 June 2005. No snow covered the glacier tongues, and few clouds occurred in the area of the glaciers. The past glacier coverage was mapped from Landsat TM/ETM recorded in 1990 and 2000 (Table 1). All the images were orthorectified with the DEMs. Eleven ground-control points were selected from the 1 : 50 000 topographic maps to orthorectify each image, based on a second-order polynomial transformation. The root-mean-square (rms) errors were 0.87, 0.75 and 0.68 pixels for SPOT5, TM and ETM images respectively.
Atmospheric corrections of the SPOT5 and TM/ETM images were based on Soudani’s method Reference Soudani, François, le Maire, le Dantec and Dufrêne(Soudani and others, 2006), which is simple and efficient. It was used in preference to a radiative transfer model (RTM) because the performance of the RTM cannot be guaranteed in the absence of simultaneous aerosol and water-vapour content measurements describing atmospheric conditions at the time of image acquisition.
Results
Temperature and precipitation trends
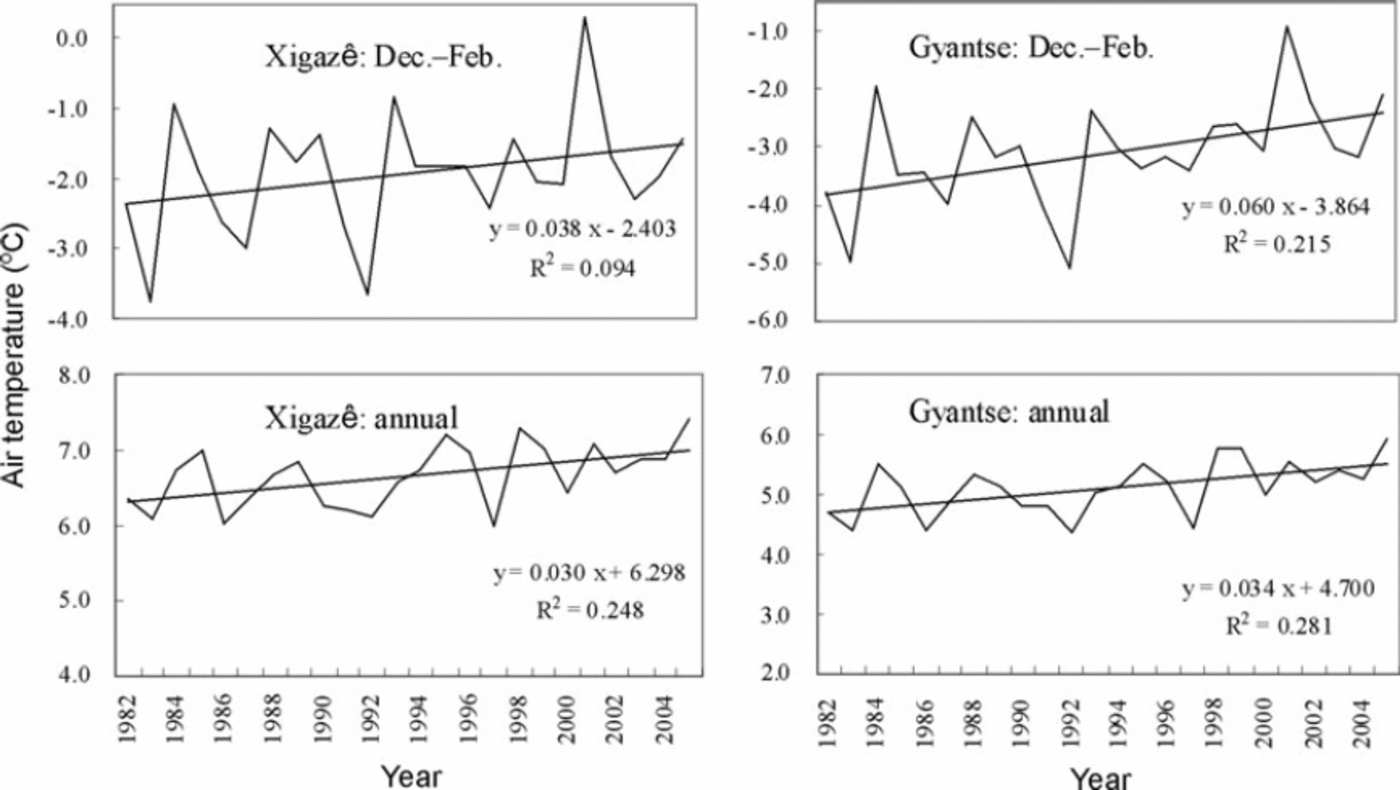
Analysis of records from Xigazê and Gyantse revealed a warming trend in temperature (Fig. 3), although with some fluctuations. Winter temperatures increased more rapidly than during other seasons, while summer temperatures remained relatively stable. Precipitation showed no obvious increasing or decreasing trend at either station (Fig. 4). Over the last 20 years, 94% and 90% of the total annual precipitation at Xigazê and Gyantse, respectively, was received in the period July–September. Trend analysis showed an obvious correlation between the two stations (P < 0.001, N = 25).
Winter and annual temperature at Xigazê and Gyantse weather stations.
Annual precipitation at Xigazê and Gyantse weather stations.
The glacier inventory
Analysis of the glacier layers showed that in 2005 there were 136 glaciers with a total area of 224 km2. Of these, 37 glaciers had an area >1 km2 and 10 glaciers exceeded 5 km2. The average glacier length was 1.85 km, with 116 glaciers <3.0km and 73 <1.0 km. Statistics on aspect showed that >70% of the glaciers were oriented to the north. Because of the semi-arid conditions on the plateau, the average altitude of the glacier termini, which were not covered by moraine, was very high, 5608ma.s.l.; snouts of the north-oriented glaciers were 75 m lower on average than those facing south. The mean glacier elevation was 5836 ma.s.l.
The lake inventory showed that glacial lakes presently cover 23.3 km2 of the basin, with 26 glacial lakes >0.01km2, 13 >0.1km2 and 4 >1 km2; their average altitude is 5178 ma.s.l. All the glacial lakes are moraine-dammed.
Front variations and glacier surface-area changes
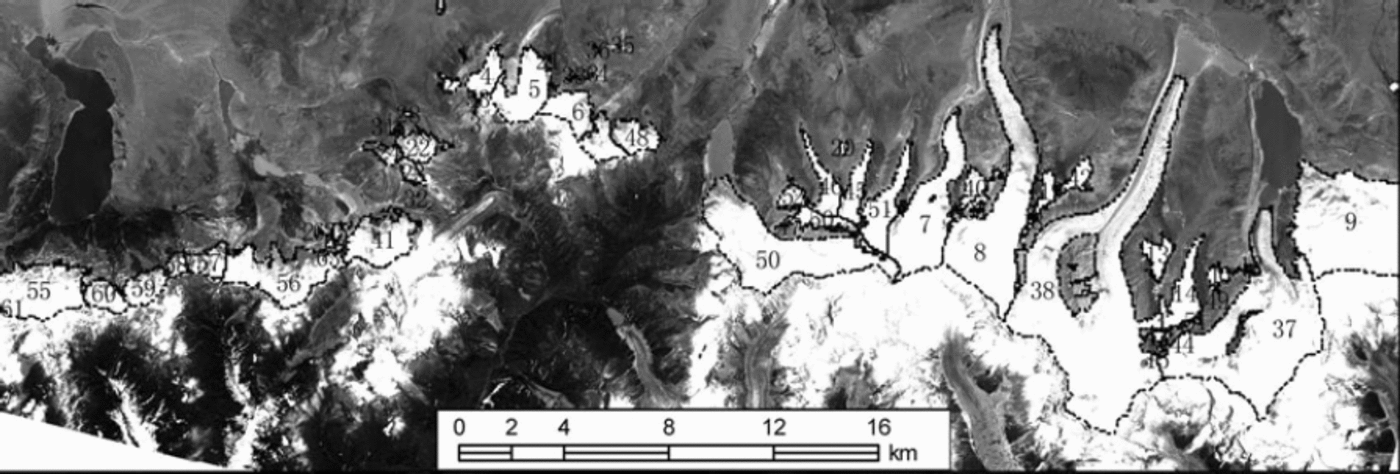
After rectification and geocoding of all available images taken in 1990, 2000 and 2005, the time series of three layers were compared to assess glacier changes. It was possible to calculate the area change automatically in ArcGIS because each glacier had a unique ID. Each length change was determined from differences measured along the central flowline. The respective numbered glacier tongues can be seen in Figure 5. Examples of the recession of two glaciers are given in Figure 6.
Orthorectified image map and glacier inventory of the southern Nianchu basin. (SPOT5 panchromatic image (27 June 2005) from Beijing SPOT Image Ltd Corp.)
Snout positions for 1990, 2000 and 2005: on left, Shimozongpu glacier No. 38; on right, Xiaquepu glacier No. 56. (SPOT5 panchromatic image (27 June 2005) from Beijing SPOT Image Ltd Corp.)
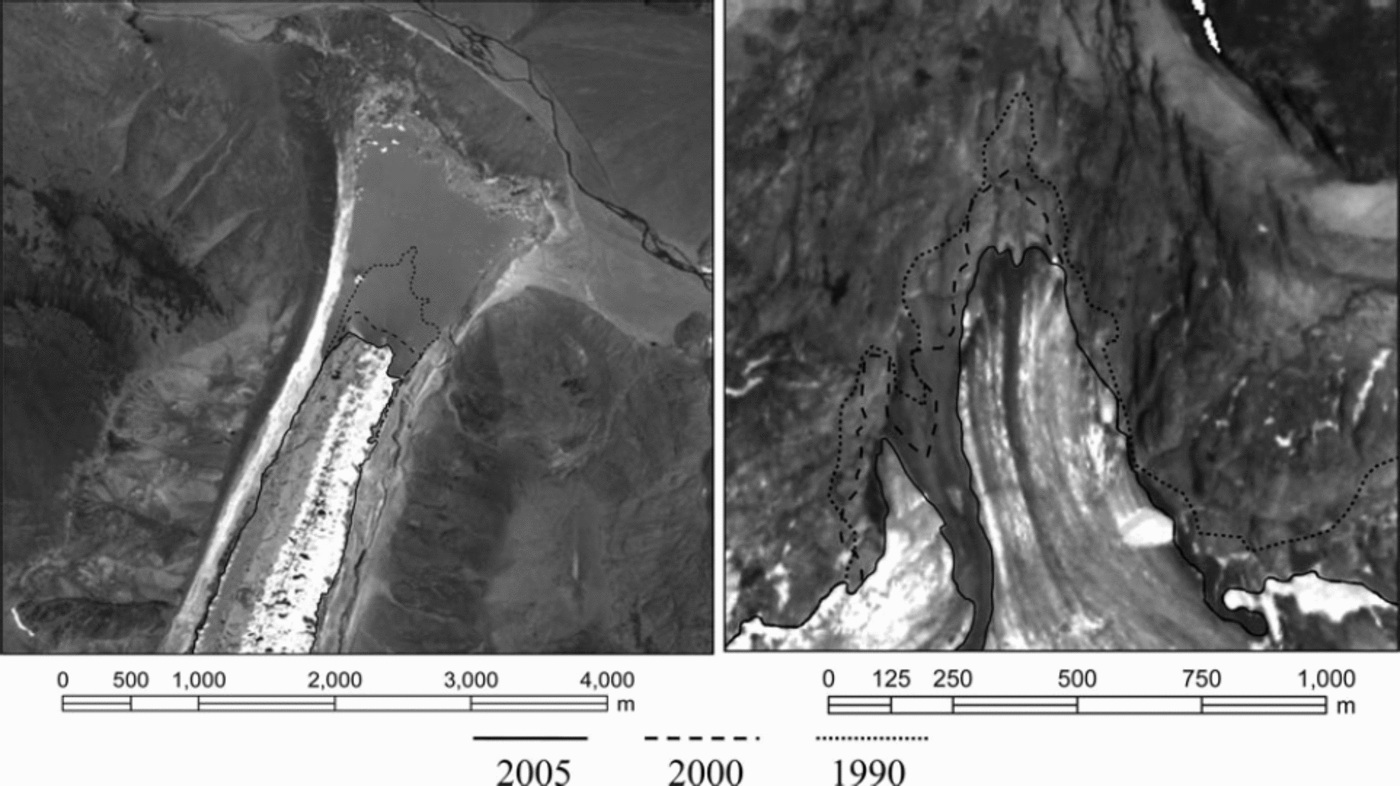
Most of the investigated glaciers have experienced retreat during the last 15 years, indicating net negative mass balance Reference Haeberli, Frauenfelder, Hoelzle and Maisch(Haeberli and others, 1999). While none have advanced, there has been no change in the position of the glacier front for some of the glaciers observed. As Figure 6 shows, the glacier fronts of Xiaquepu glacier No. 56 and Shimozongpu glacier No. 38 retreated 170 and 390 m, respectively, from 1990 to 2000, and 140 and 170m from 2000 to 2005. The average length change for them for the last 15 years was –20 and –37ma–1, respectively, or –8% and –3% (10 a)–1. The average length change rate for all glaciers in the basin for this period was –4% (10 a)–1.
The total glacierized area of the Nianchu basin was 241 km2 in 1990, 230 km2 in 2000 and 224 km2 in 2005, or –5% of the area per decade, similar to the observed length changes. There was no obvious difference in retreat rate between south- and north-oriented glaciers. Because the 2005 measurements were taken in June (before the summer monsoon) and the 1990 and 2000 measurements in October (after the monsoon accumulation season), the 1990 and 2000 glacier extents might be slightly overestimated.
The area of glacial lakes in the basin has increased during the last 15 years. Excluding Chongbayong lake, a dammed reservoir with controlled outlet, the total area of glacial lakes was 10.6km2 in 1990, 11.3 km2 in 2000 and 11.6 km2 in 2005, a mean observed increase of 7%(10 a)–1. The number of glacial lakes >0.01km2 has also increased over the same period, from 17 to 19 to 26 in 1990, 2000 and 2005, respectively.
Discussion and Conclusions
The results obtained in this inventory, of a –4% (10 a)–1 average length change and a 5%(10 a)–1 loss in area over 15 years, are similar to the changes observed in the Chenab, Parbati and Baspa basins by Reference KulkarniKulkarni and others (2007). Their investigation showed an overall reduction in glacier area of 21% (amounting to 5%(10 a)–1) from 1962 to 2004 in these Himalayan basins.
The rates of length change of Xiaquepu glacier No. 56 and Shimozongpu glacier No. 38 (–20.4 and –37.4ma–1) are similar to those observed by Reference S., Chen, Ye, Jing, Qin and RenKang and others (2007) in the Nyainqêntanglha mountain area in the summers of 1999 and 2007. Using a global positioning system (GPS), they measured five glaciers around the mountain. On the northern slopes, the retreat rates were around 10.0ma–1 for Lanong and Zhadang glaciers and 38.9ma–1 for Xibu glacier. These rates are somewhat larger than those determined in the central Himalaya by Reference Ren, Qin, Kang, Hou, Pu and JingRen and others (2004). Their repeat measurements of glacier terminus positions showed an average retreat rate in the Qomolangma (Mount Everest) region of 5.5–8.7ma–1 since the 1960s, and of 6.4ma–1 in the Xixiabangma region since the 1980s.
The 9.9% expansion in the area of glacial lakes during the last 15 years, with the addition of nine new lakes, may mainly result from the acceleration of glacier retreat. Increased meltwater may generate new lakes and lead to the expansion of existing lakes. A similar study was undertaken by Reference Chen, Cui, Yang and QiChen and others (2005) in the neighbouring Poiqu river basin where their analysis of TM/ETM data shows the number and area of glacial lakes increased by 11% and 47% from 1987 to 2001.
Annual precipitation in the Nianchu river basin has remained steady during recent decades, yet there has been a detectable rise in temperature, particularly from December to February, coinciding with a reduction in the glacierized area of the basin. It is apparent that the warming of the climate which has been experienced worldwide is also affecting glaciers in this part of the Tibetan Plateau.
Acknowledgements
This study was funded by the National Basic Task Program ‘National Glacier Inventory and Glacier Changes in China’ (2006FY110200) and National Basic Program (2005CCA05500). Thanks to L. Copland and H. Jiskoot for help in revising the manuscript, and special thanks to S. Ommanney for his significant contribution to improving the quality of the paper.



