INTRODUCTION
Phosphorus (P) is a major soil nutrient and plays a crucial role in food production (Newman Reference Newman1997; Van Vuuren et al. Reference Van Vuuren, Bouwman and Beusen2010). In grassland farming systems, P is constantly removed from the soil by plants which in turn are converted into animal products as part of the P cycle. It is necessary to replenish soil P reserves by replacing P removed in farm output with fertilizers to ensure that soils are not extensively depleted of P and to maintain productivity. Uncertainty over the amount of remaining reserves of finite phosphate rock and the negative effect of overuse of P on the environment has focused agricultural research into both increasing the efficiency of P use and reducing P losses to water (Dawson & Hilton Reference Dawson and Hilton2011).
Phosphorus fertilizer recommendations for grassland in Ireland are based on supplying sufficient P for herbage yield and to ensure the herbage P concentration is at or above 3·5 g/kg of dry matter (DM) to supply sufficient dietary P to grazing ruminants (Schulte & Herlihy Reference Schulte and Herlihy2007; Coulter & Lalor Reference Coulter and Lalor2008). Soil P concentrations are based on the Morgan's soil P extraction method (Peech & English Reference Peech and English1944) with the results categorized into four indices (1 to 4) (Table 1).
Soil phosphorus (P) Index system for grassland in Ireland (adapted from Coulter & Lalor Reference Coulter and Lalor2008)

* Build-up P fertilizer rates for grassland are 20 kg P/ha/year at Index 1, and 10 kg P/ha/year at Index 2.
† Until next soil test.
‡ Maintenance requirements of P fertilizer will depend on stocking rate, farming system (dairy or drystock cattle/sheep farms) and grassland usage (grazing or silage or hay).
High Index 4 soils are not expected to respond to P fertilizer and also have an increased risk of P loss to water (Tunney Reference Tunney2000). Reports (Plunkett Reference Plunkett and Lalor2012) have shown that there is an increase in the amount of soils being tested that are falling into the lower soil P Indices (1 and 2). Combined with the reduction in the amount of P fertilizer sales in Ireland (Lalor et al. Reference Lalor, Coulter, Quinlan and Connolly2010), this has created concerns over future agriculture productivity on low P soils and whether P fertilizer advice should be revised to ensure future agricultural productivity and to sustainably manage a finite natural resource.
Developing fertilizer advice that includes information on factors such as climate, farm type and management systems (Cox Reference Cox1994; Anderson-Cook et al. Reference Anderson-Cook, Alley, Roygard, Khosla, Noble and Doolittle2002) has been shown to increase P fertilizer efficiency and can lead to both potential savings on fertilizer use and have a positive environmental impact (Jordan-Meille et al. Reference Jordan-Meille, Rubæk, Ehlert, Genot, Hofman, Goulding, Recknagel, Provolo and Barraclough2012). The potential exists to relate soil properties to P availability (Frossard et al. Reference Frossard, Condron, Oberson, Sinaj and Fardeau2000). Schulte & Herlihy (Reference Schulte and Herlihy2007) found large variations in P fertilizer requirements between Irish soils, suggesting that P fertilizer advice differentiating only a mineral soil from a peat soil may not fully explain the variation that exists.
Managing P fertilizer applications when P is limiting and using effective P management practices can help to ensure maximum P uptake and reduced P loss (Grant et al. Reference Grant, Flaten, Tomasiewicz and Sheppard2001). In countries where animal production is based around grass consumption, increasing early and late season grass growth increases the production efficiencies of farms (O'Donovan et al. Reference O'Donovan, Lewis and O'Kiely2011). Saunders et al. (Reference Saunders, Sherrell and Gravett1987) found a higher yield response to P fertilizer during those periods of the year with the slowest growth rates. Understanding this effect and its implications for the seasonal effect of P fertilizer on herbage growth in Irish soils would allow targeted P fertilizer application at the time of greatest P demand and consequently increase P efficiency.
Detailed information on the seasonal effects of P fertilizer in grassland is lacking in Ireland, as previous studies have focused on silage systems with only two to four harvests per year. Thus, research in which measurements are made under a higher frequency of grass cuts during the year is required. Few examples exist in the literature of grassland plots that are cut more than seven times a year (Schils & Snijders Reference Schils and Snijders2004; Power et al. Reference Power, Tunney and Jeffrey2005; Schulte & Herlihy Reference Schulte and Herlihy2007). This is in contrast to typical grazing rotations, which can be grazed at intervals of between 21 and 28 days during the grazing season (Murphy et al. Reference Murphy, O'Connell, Watson, Watson and Humphreys2013).
Recent anecdotal evidence in Ireland has suggested an increase in ruminants exhibiting P deficiency symptoms. While current P fertilizer advice is formulated to supply sufficient herbage P concentration of (>3·5 g/kg DM), declining P fertilizer application rates in Ireland (Lalor et al. Reference Lalor, Coulter, Quinlan and Connolly2010) may infer declining herbage P concentration to levels that may be below dietary requirements. Reduced herbage P levels may also mean that seasonal trends in the herbage P concentration may become more apparent. Few accounts on the seasonal trend in herbage P concentration have been published. Fleming & Murphy (Reference Fleming and Murphy1968) found a decline in the herbage P concentration as the herbage matures; in contrast, work by Cotching & Burkitt (Reference Cotching and Burkitt2011) found no consistent trend in herbage P concentration during the growing season. Kavanagh et al. (Reference Kavanagh, Sheil, Wall and Lalor2014) reported significantly lower P concentration in herbage sampled from grazed swards in May and July compared with herbage sampled in February and October.
The objective of the present study was to investigate the long-term effect of P fertilizer application rate in a grass plot experiment receiving four different annual application rates of P fertilizer. Results for herbage yield, herbage mineral concentration and Morgan's soil P levels were recorded at two sites with contrasting soil types. The effect of P fertilizer on seasonal and annual DM yields, P concentrations in the herbage, soil P trends and P balances were also investigated.
MATERIALS AND METHODS
Experimental site details
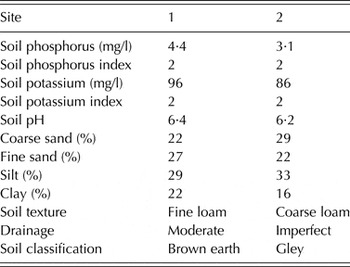
The experiment was established on the Teagasc research farm in Johnstown Castle, Wexford, Ireland, in February 1995. Two sites were selected to represent contrasting soil types (Table 2).
Initial soil properties and soil texture for both sites (soil texture was analysed in 2012)

Site one (52°17′56″N, 6°29′48″E; 59 m asl) is a fine loamy textured soil, classified as a moderately drained brown earth (World reference body (WRB) soil classification: Stagnic Cambisol (Humic Hypereutric Ruptic)) (IIUS Working Group WRB 2014). Site two (52°17′52″N, 6°29′58″E; 57 m asl) is a coarse loamy, imperfectly drained, gley soil (WRB soil classification: Stagnic Cambisol (Dystric)) (IIUS Working Group WRB 2014). The experiment was established on a grass sward dominated by Lolium perenne (perennial ryegrass) which had been reseeded within the 5 years prior to the commencement of the experiment. The area of each site was fenced off to exclude animal access and 16 plots measuring 1·5 × 9 m2 were demarcated. Initial soil P and soil pH levels together with soil texture for each site are summarized in Table 2.
Treatments and analysis
Throughout the paper all fertilizer application rates are expressed as the elemental form of the nutrient rather than the oxide form which is the official requirement in the Republic of Ireland. The experiment consisted of four different rates of P fertilizer (triple super phosphate – 16% P) which were 0 kg/ha/year (Control, P0), 15 kg/ha/year (P15), 30 kg/ha/year (P30) and 45 kg/ha/year (P45). The treatments were replicated four times at each site in a randomized block design, resulting in 16 plots per site (four blocks with four plots in each block). Phosphorus fertilizer was applied in February of each year. Nitrogen (N) (calcium ammonium nitrate) fertilizer was applied in seven equal applications of 40 kg/ha during the growing season resulting in a total application of 280 kg/ha/year. Potassium (K) (potassium chloride – 50% K) was applied twice each year with an application of 120 kg/ha in February and again in June to give an annual application rate of 240 kg/ha/year. Soil pH was maintained by applying ground limestone (7·5 t/ha) to all plots in 2007.
The herbage was harvested between six and eight times per year between late March and early November with a Haldrup plot harvester (Logstor, Denmark) set at a cutting height of 400 mm. Fresh herbage yield was measured at each harvest by recording the weight of herbage harvested from each plot. A sub-sample was taken from each plot at each harvest and used to determine DM (oven drying for 24 h at 95 °C) and herbage P concentration. Herbage yield (kg/ha DM) was calculated by multiplying the DM percentage by the fresh yield of herbage. Herbage P concentration (g/kg DM) was obtained by colorimetric analysis following hot acid digestion using sulphuric acid as outlined by Byrne (Reference Byrne1979).
Soils in all plots were sampled annually to a depth of 100 mm using a 20 mm diameter corer after the last grass harvest was collected following the sampling protocol described in Coulter & Lalor (Reference Coulter and Lalor2008). Fifteen soil cores were collected per plot and bulked together. Samples were dried at 40 °C and sieved through a 2 mm sieve. Morgan's extract (Peech & English Reference Peech and English1944 was used to measure the soil test P (STP) levels using the method described by Byrne (Reference Byrne1979). To ensure soil analysis reliability one blank and ten control soil samples were analysed per run of 89 soil samples. Soil pH was measured in a 1:2 soil-to-water ratio and the soil pH determined using a Mettler Toledo glass calomel electrode.
Missing data
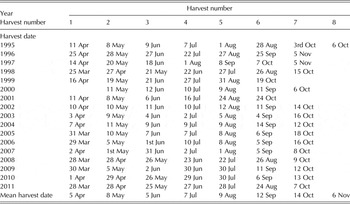
The dataset was incomplete, with herbage yield and mineral concentration unavailable for Site 1 in July 1996 due to accidental grazing. The herbage yield and mineral concentrations for the first five harvests at both sites in 2003 and the herbage mineral concentration for harvest 7 in October 2002 and October 2004 at Site 2 were also excluded due to accidental errors in sampling and handling. To account for missing data in 1996 and 2003, mean values over the other 16 years for the herbage yield and herbage P concentration were assumed. Where no herbage P concentration values are available (Harvest 7, 2002 and 2004, Site 2) the annual herbage P uptake values were taken as the mean of the other six harvests. The complete list of harvest dates is shown in Table 3.
List of harvest dates (both sites) from 1995 to 2011

Calculations and statistical analysis
The data were analysed by multiple analysis of variance using mixed models, implemented using the PROC MIXED procedure in Statistical Analysis System (SAS) version 9.3 (Cary, USA). The final model for both herbage yield and herbage P concentration included the factors of site, harvest, year, P fertilizer rate and change in STP (final STP minus initial STP), including interactions between factors. Year, harvest and P fertilizer rate were included as fixed effects. The change in STP was also initially included in the model to account for changes in the STP over the duration of the experiment.
The model for the change in STP over time also included the effects of site, harvest, year and P fertilizer rate. For the change in STP over time, the initial model included the effects of site, harvest, year and P fertilizer rate. The interactions between factors were also included. Year, harvest and P fertilizer rate were included in this model as fixed effects.
Regression analysis was carried out to model the STP levels over the duration of the experiment. A linear plus plateau model was used to analyse the P0, P15, P30 and P45 treatments for the rate of change in STP over the years of the experiment, chosen based on best fit to fit both P0 and P45. The r 2 values for the linear plus plateau model were based on the likelihood ratio. The predicted values for both models were computed in PROC GLM for linear and PROC NLMIXED for linear plus plateau model in SAS.
RESULTS
Soil and weather conditions
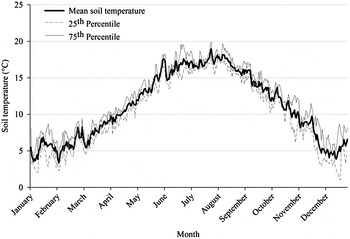
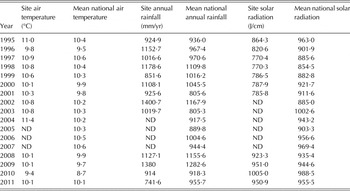
Meteorological data for air temperature, soil temperature, annual rainfall and sunshine hours were collected for the duration of the experiment. The data were collated from a meteorological station in close proximity to both field sites (Table 4 and Fig. 1). Data for the national average is the mean of all weather stations around Ireland (currently 36).
Mean daily soil temperature for the experimental site. Soil temperature data were collected from 2004 to 2011.

Annual meteorological data of the mean temperature, total rainfall and sunshine hours for the duration of the experiment

ND, no data for this parameter was collected at this station during this time.
Herbage yield
Annual herbage yield
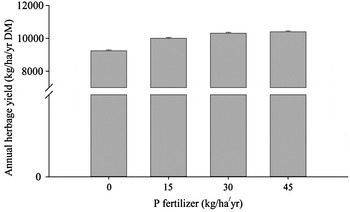
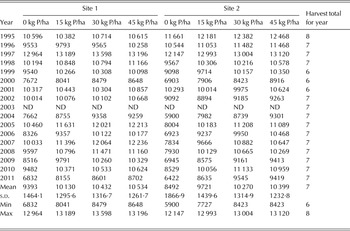
The mean annual herbage yield for P fertilizer rate is shown in Table 5. The mean annual herbage yield was affected significantly by P fertilizer (P < 0·001). There was no significant effect of site on the mean herbage yield. The effect of P fertilizer on the annual herbage yield over the two sites is shown in Fig. 2.
Effect of P fertilizer on the mean annual herbage yield at both sites.

Mean annual herbage yield (kg/ha/year DM) for each experimental site at each rate of phosphorus (P) fertilizer. The total number of harvest in each year are also included

ND, no data; s.d., standard deviation.
Seasonality of herbage yield
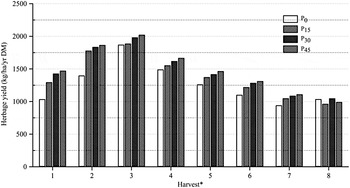
The dates when harvests were taken in each year are shown in Table 3. The mean effect of P fertilizer on the herbage yield at each harvest during the year is shown in Fig. 3. There was a consistent significant interaction (P < 0·001) between P fertilizer and month of harvest on the herbage yield; however, there was no effect of site. For the first harvest period there was a significant increase in the herbage yield (P < 0·05) from P0 to P30. However, there was no significant increase in the herbage yield with P15 compared with P0, nor was there any significant increase in the herbage yield with P45 compared with P30. The model estimated that P30 increased herbage yield by 318 kg/ha DM from P0. For the second harvest period there was a significant increase of 347 kg/ha DM in herbage yield from P0 to P15. There was no further increase in herbage yield for P30 or P45. For subsequent harvests (3, 4, 5, 6, 7 and 8 in May/June, July, August/September, September/October, October/November and November, respectively) there was no significant increase in herbage yield for any of the P fertilizer treatments.
Effect of P fertilizer on the mean herbage yield for each harvest period. *Data for harvest 8 was only collected from one harvest in 1995.

As P fertilizer increased from P0 to P15 there was a significant (P < 0·001) increase of 7·5%, or 760 kg/ha DM, in annual herbage yield. The application of P30 did not increase the herbage yield; however, there was a significant increase in the herbage yield with P45 (P < 0·05). This increase resulted in an estimated 3·8% increase in annual herbage yield from P15 and overall an 11·1% increase in annual herbage yield from P0.
Herbage phosphorus concentration
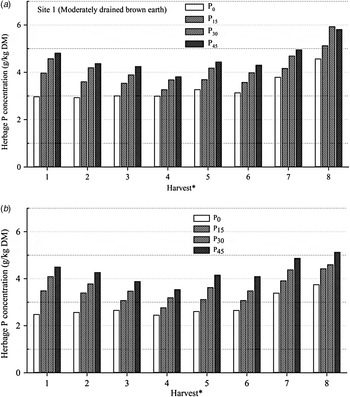
As with the herbage yield, there was significant (P < 0·001) interaction between the effects of P fertilizer and month of harvest on herbage P concentration. The interaction between herbage P concentration and harvest is shown in Fig. 4(a) for Site 1 and Fig. 4(b) for Site 2.
Effect of P fertilizer on the herbage P concentration for each harvest period at Site 1 (a) and at Site 2 (b). *Data for harvest 8 was only collected from one harvest in 1995.

In Site 1, there was a significant (P < 0·001) effect of P fertilizer on the herbage P concentration in seven out of eight harvests during the year. The greatest response to P fertilizer was seen at Harvests 1 and 2 where there was an increase in P fertilizer up to P45. In Harvest 1, there was a significant (P < 0·001) increase in herbage P concentration due to P fertilizer from P0 (2·97 g/kg DM) to P15 (3·97 g/kg DM). There was also a significant (P < 0·01) increase in herbage P concentration due to P fertilizer from P15 (3·97 g/kg DM) to P45 (4·81 g/kg DM). For Harvest 2, there was a significant (P < 0·001) increase in herbage P concentration from P0 (2·93 g/kg DM) to P15 (3·60 g/kg DM) and also a significant (P < 0·05) increase herbage P concentration from P15 (3·60 g/kg DM) to P45 (4·20 g/kg DM). For Harvest 3, there was a significant (P < 0·05) increase in herbage P concentration from P0 (3·00 g/kg DM) to P30, (3·89 g/kg DM) and a significant (P < 0·001) increase in herbage P concentration from P0 (3·00 g/kg DM) to P45 (4·24 g/kg DM). For Harvest 4, P fertilizer caused a significant (P < 0·05) increase in herbage P concentration from P0 (2·99 g/kg DM) to P30 (3·89 g/kg DM) and a significant (P < 0·05) increase in herbage P concentration from P0 (2·99 g/kg DM) to P45 (4·24 g/kg DM) In Harvests 5, 6 and 7, the response to P fertilizer was similar with significant (P < 0·001) increases in herbage P concentration from P0 to P30 and from P0 to P45, and also an increase from P15 to P45. For Harvest 8 there was no significant response to P fertilizer on the herbage P concentration.
At Site 2, as for Site 1, P fertilizer caused an increase in the herbage P concentration in seven out of eight harvests. The response to P fertilizer for Site 2 was similar to Site 1 although in general the herbage P concentration levels were lower. The greatest response to P fertilizer was seen at Harvests 1 and 2 with increases in herbage P concentration due to P fertilizer up to P45.
In Harvest 1, there was a significant (P < 0·001) increase in herbage P concentration from P0 (2·48 g/kg DM) to P15 (3·48 g/kg DM). There was also a significant (P < 0·001) increase in the herbage P concentration from P15 (3·48 g/kg DM) to P45 (4·50 g/kg DM). For Harvest 2, there was a significant (P < 0·001) increase in herbage P concentration from P0 (2·56 g/kg DM) to P15 (3·40 g/kg DM). There was also a significant (P < 0·05) increase in the herbage P concentration from P15 (3·40 g/kg DM) to P45 (4·26 g/kg DM). For Harvest 3, there was a significant (P < 0·05) increase in herbage P concentration from P0 (3·07 g/kg DM) to P30 (3·47 g/kg DM). There was also a significant (P < 0·001) increase in herbage P concentration from P0 (3·07 g/kg DM) to P45 (3·88 g/kg DM). At Harvest 4, P fertilizer caused a significant (P < 0·05) increase in herbage P concentration from P0 (2·44 g/kg DM) to P45 (3·53 g/kg DM). In Harvests 5, 6 and 7 the response to P fertilizer was similar with increases in herbage P concentration from P0 to P30 and P0 to P45, and also an increase from P15 to P45. For Harvest 8 there was no significant response to P fertilizer on the herbage P concentration.
Soil test phosphorus levels
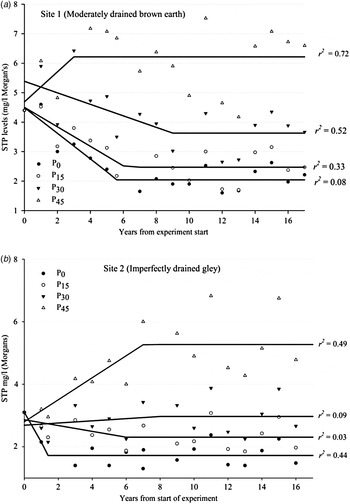
Soil test P levels were affected significantly by P fertilizer (P < 0·001) and by site (P < 0·05). The effects of different rates of P fertilizer on the STP levels over time at each site are shown in Figs 5(a) and (b) for Sites 1 and 2, respectively.
Trends in the STP values from 1995 to 2011 for each rate of P fertilizer at Site 1 (a) and at Site 2 (b). Linear plus plateau regression line was fitted using predicted values calculated in NLMIXED in SAS.

At the start of the experiment, STP levels were 4·4 mg/l at Sites 1 and 3·1 mg/l at Site 2. The mean STP levels for each site in 2011 and P fertilizer treatment are shown in Table 6. Converting the 2011 values into P Indices shows that at that time, both sites P0 and P15 were in Index 1, P30 in Index 2 and P45 in Index 3 (i.e. the optimum P index).
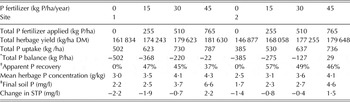
Cumulative mass phosphorus (P) balance calculations and changes in soil test P (STP) over 17 years (1995–2011) for each rate of P fertilizer and each site

DM, dry matter.
* Total P balance is calculated from subtracting the total P offtake from the total P fertilizer applied.
† Apparent P recovery is calculated as the (P uptake–P uptake for the control/(P uptake) × 100).
‡ Final soil P relates to the mean STP value (Morgan's P) in 2011.
There was a significant (P < 0·001) relationship between the STP values and P fertilizer rates from 1995 to 2011 as shown in Fig. 5. At both sites the linear plus plateau model was fitted to the STP trend to explain the decline or increase over time. In Site 1, the linear plus plateau model was significant (P < 0·05) for all rates of P fertilizer. In Site 2, the linear plus plateau model was not significant for P15 and P30 and hence had corresponding low r 2 values of 0·03 and 0·09, respectively. The linear plus plateau model at Site 1 estimated that for P0 the STP decreased until 2001 before plateauing. For P15 the model estimated a similar decrease until 2001. For P30 the model estimated a decrease until 2004, while for P45 the model estimated an increase in STP until 1998. At Site 2, for P0 the linear plus plateau model estimated that the STP declined until 1996 and until 2001 for P15. For P30 the model estimated a decrease in STP until 2003, while for P45 the model estimated an increase until 2001.
Total phosphorus offtake, apparent phosphorus recovery and cumulative phosphorus balance
The values for total P fertilizer applied, total herbage yield, total P offtake, total P balance and the apparent P recovery for each rate of P fertilizer are shown in Table 6. Values were adjusted to account for missing data from 1995 at Site 1 and for both sites in 2000.
There was a consistent increase in both the total herbage yield and total P uptake as P fertilizer application rate increased over the duration of the experiment. When the total P balance was calculated this showed that all treatments at both sites recorded a negative P balance, apart from P45 at Site 2. There was a greater negative P balance at Site 1 due to the higher herbage yield achieved at that site. The mean apparent P recovery was calculated as total P uptake minus the total P uptake for the control plots and expressed as a percentage (Syers et al. Reference Syers, Johnston and Curtin2008). This shows that at Site 1 the highest apparent P efficiency occurred for the P15 treatment (47%), while at Site 2 the P15 treatment also had the highest apparent P efficiency (57%). Both the mean herbage P concentration and the final soil P (modelled from Fig. 5) showed a consistent increase as the P fertilizer rate increase. The change in soil P, which is calculated as the initial STP level minus the modelled soil P (from Fig. 5), shows that for both sites there was a mean reduction in the STP apart from P45, which showed an increase at Site 1 of 1·9 mg/l and at Site 2 of 2·2 mg/l.
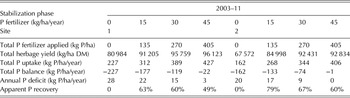
The calculations summarized in Table 6 were repeated for the data shown in Table 7 for the period 2003–11. This period represents the phase of the experiment during which the modelled change in STP at both sites (shown in Fig. 5) for all P fertilizer rates had stabilized. Similarly to Table 6, there was an increase in total herbage yield and total P uptake as the P fertilizer rate increased at both sites. The total P balance was negative at both sites with a larger negative balance at Site 1 (−22) than at Site 2 (−1) due to the higher herbage yield at Site 1. The annual P deficit was calculated based on the amount of extra P fertilizer required in addition to the trial application to maintain a P balance (0 kg P/ha). The P fertilizer requirement was higher for all P treatments at Site 1 as a result of greater P uptake. The apparent P uptake during this period was higher at both sites compared with the entire experimental period (Table 6), with the highest P recovery occurring with P15 at Site 1 (63%) and with P15 at Site 2 (79%).
Total herbage yield, phosphorus (P) uptake and P balance in each site and P fertilizer rate during the years 2003–11

DM, dry matter.
DISCUSSION
Herbage yields
The increase in herbage yield following P fertilizer application agrees with previous findings by Schulte & Herlihy (Reference Schulte and Herlihy2007) and the response in annual DM yield up to 30 kg DM/ha/year in the present experiment are in agreement with the standard grassland recommendations in Ireland (Coulter & Lalor Reference Coulter and Lalor2008). In the present experiment, early season P fertilizer application led to an increase in herbage yield of 318 and 347 kg/ha DM for the first and second harvest, respectively. This result is similar to that reported by Burkitt et al. (Reference Burkitt, Donaghy and Smethurst2010) which also mentioned a trend (although not significant) for higher herbage yield immediately following P fertilizer addition. This increase in herbage yield suggests that: (a) there is an increased demand for P fertilizer during early season growth; and/or (b) plants have a reduced ability to utilize soil P early in the season compared with late season.
To explain this response, Grant et al. (Reference Grant, Flaten, Tomasiewicz and Sheppard2001) stated in a review of early season P nutrition that at low soil temperatures, plants may have a greater requirement for the more easily obtainable fertilizer P as opposed to the P already held within the soil. Additionally soil temperature has been shown to have an important effect on nutrient availability, plant uptake and root growth (Baligar et al. Reference Baligar, Fageria and He2001). Mackay & Barber (Reference Mackay and Barber1984) found that plants overcame the effect of low soil temperature by increasing the P concentration around the root, which in turn leads to an increased P influx to the root. This makes plants more reliant on the supply of readily available fertilizer P until soil temperature increases to stimulate increased root proliferation and uptake of residual soil P.
Burkitt et al. (Reference Burkitt, Donaghy and Smethurst2010) found perennial ryegrass to have high demand during the 1 to 3 leaf stage of regrowth (early regrowth). In the present study, the mean harvest dates for the first two harvests were 7 April and 9 May with a mean soil temperature during this period ranging from 9 to 13 °C. In the present study, it appears that all experimental plots were able to access sufficient soil P to achieve full growth potential during the latter half of the season, as there was no subsequent yield response to P fertilizer after the second harvest. Therefore, in the present experiment the early response to P fertilizer suggests that soil temperature may be a critical factor. However, it is not possible to confirm this inference using the current data since all P fertilizer was applied in February each year and therefore no comparison can be made with P fertilizer applied at different times of the year.
Herbage phosphorus concentration
Smith et al. (Reference Smith, Cornforth and Henderson1985) reported a critical herbage P concentration, below which yield would be compromised, of 2·1 g/kg DM in perennial ryegrass. The optimum herbage P concentration for grazing ruminants is higher, 3·0–4·0 g/kg DM (Karn Reference Karn2001), and can vary due to factors such as maturity and whether an animal is lactating/non-lactating. Therefore the P fertilizer requirement for herbage P concentration to feed ruminants will be higher than the requirement of the grass for maximum yield. In Ireland, P fertilizer advice is formulated to build, maintain or reduce soil P levels to Index 3 (5–8 mg/l) (Coulter & Lalor Reference Coulter and Lalor2008) to ensure that the herbage P concentration is in the range of 3·0–3·5 g/kg DM (Schulte & Herlihy Reference Schulte and Herlihy2007). The results from the present study show that higher P fertilizer rates were required to reach optimum herbage P concentration than would be required for yield alone.
Similarly for herbage yield, there was a response to P fertilizer at the start of the year. However, in contrast to herbage yield, the increase in P demand to maintain herbage P concentration ensured that there was a consistent benefit of P fertilizer throughout the year for increasing herbage P concentration levels. In addition, there was also a positive correlation between the soil P and herbage P concentration, which did not occur with herbage yield. This suggests that both P fertilizer and soil P play an important role in influencing the herbage P concentration and that the higher P requirement for herbage P concentration makes it necessary for plants to rely on additional soil P mineralization to ensure sufficient soil P supply.
A trend of increasing herbage P concentration during the latter half of the year was found by Burkitt et al. (Reference Burkitt, Donaghy and Smethurst2010). However, Cotching & Burkitt (Reference Cotching and Burkitt2011) did not find a consistent trend in herbage P concentration during the season, while Fleming & Murphy (Reference Fleming and Murphy1968) found that the herbage P concentration tended to decline with grass maturity. This has possible negative implications for grazing animals that are not being fed mineral supplements. The data reported in the present paper show that without P fertilizer the herbage P concentration would be below 3·5 g/kg DM for six out of the eight harvests and, importantly, during the main period of grass conservation for silage or hay (May–June). In the present study, P fertilizer application of 45 kg P/ha/year would be needed to ensure that the herbage P concentration would be above 3·5 g/kg DM throughout the grazing year. Further work to examine the impact of timing of P fertilizer application on herbage P concentration across the growing season would be beneficial.
Soil phosphorus
Phosphorus fertilizer had an influence on the STP values, but the response varied between sites. Using the linear plus plateau model to estimate the decline or increase in STP for the duration of the experiment enabled estimates of decline in STP levels. At Site 1, the increase in STP with high P inputs was greater than at Site 2 but conversely the decrease in STP with no P fertilizer was greater at Site 2 than at Site 1. The rate of P decline has been associated with factors such as soil mineralogy, farm management and initial STP concentrations (Dodd et al. Reference Dodd, McDowell and Condron2012; Herlihy et al. Reference Herlihy, McCarthy, Breen and Moles2004). The lack of a continuing decline in STP following the withdrawal of P fertilizer may also be due to increased levels of both organic matter and clay content (Tunney et al. Reference Tunney, Kirwan, Fu, Culleton and Black2010). In the present experiment, there were differences both in initial STP levels and in soil texture, as Site 1 (STP level 4·4 mg P/l) was described as a fine loam and had a higher clay content (22% by volume), whereas Site 2 (3·1 mg P/l) was described as a coarse loam and had a lower clay content (16% by volume) and a slower increase in STP levels. Cox (Reference Cox1994) found that soils with lower clay content had greater increases in STP levels compared with soils with higher clay content. This supports the findings from the present experiment, as for Site 1 the model estimated an increased in STP of 1·8 mg P/l and of 2·2 mg P/l at Site 2.
There was no significant relationship between herbage yield and the change in STP levels over time. This was not expected as current agronomic advice is to raise soil P levels to Index 3 to ensure sufficient soil P levels. This is also contrary to most reports from the literature such as Humphreys et al. (Reference Humphreys, Tunney and Duggan2001); Cotching & Burkitt (Reference Cotching and Burkitt2011) and Poulton et al. (Reference Poulton, Johnston and White2013), but importantly, Schulte & Herlihy (Reference Schulte and Herlihy2007) found that some Index 1 soils (low STP) achieved 0·95 of the theoretical maximum yield and had a P fertilizer requirement of 0–3 kg/ha. The reason for this may be that on low P soil, plant root activity is able to mobilize and exploit residual soil P reserves more effectively than in high P soils. In contrast there was a significant relationship in the current experiment between herbage P concentration and STP levels, which agrees with Schulte & Herlihy (Reference Schulte and Herlihy2007). In the present study the main benefit of increasing the STP levels over time was the increase in herbage P concentrations, with no apparent benefit on herbage yield.
Cumulative mass phosphorus balance and phosphorus uptake
Nutrient balances are widely used to determine nutrient supply (Öborn et al. Reference Öborn, Edwards, Witter, Oenema, Ivarsson, Withers, Nilsson and Richert Stinzing2003). While their use in the present study enables an understanding of nutrient dynamic (inputs and outputs) in relation to management factors, the authors are cognisant of the artificial conditions of this trial, such as exclusion of animals from the trial area, which would have a significant impact on nutrient cycling.
The results in Table 6 show the P inputs and P outputs over the duration of the experiment. Although the artificial conditions of a field trial will mean that results cannot be applied directly to a farm scenario, nevertheless this approach does highlight the differences that can exist. Increasing P fertilizer application rate increased the total herbage yield and total P uptake at both sites. The results also show that apparent P recovery decreased as P fertilizer increased from P15 to P30 and P45. The greatest P recovery over the entire experiment was observed with P15 at both sites.
While P recovery in the current trial cannot be directly compared with P fertilizer efficiency, both are a measure of P fertilizer effectiveness: a high figure for P recovery or P efficiency implies efficient use of P by the plant (Syers et al. Reference Syers, Johnston and Curtin2008). Phosphorus fertilizer efficiency is commonly reported to be between 10 and 25% (Syers et al. Reference Syers, Johnston and Curtin2008) in the year of application. High apparent P recovery as seen in the current experiment may be due to the productive capabilities of the P0 plots have steadily been depleted over time due to the decrease in STP levels, thus resulting in an elevated P recovery values for the treatment plots. Soil test P results for 2011 are also higher at Site 1 than at Site 2, which reflects that the initial STP was higher at Site 1 and may influence values for P recovery.
The modelled trend in soil P values showed that after 2003 at both sites and for all rates of P fertilizer, an equilibrium or plateau had been reached. Using this time period (2003–11) the P balance was calculated to examine what effect this had on P balance, P uptake and P efficiency. If Fig. 5 and Table 7 are viewed together, this shows that the P balance of these soils from 2003 to 2011 was negative in all treatments. This explains why there was no increase in the STP during the linear portion of the graph from 2003 to 2011 (Figure 5), as the P fertilizer rate applied was insufficient to increase the STP.
Herlihy et al. (Reference Herlihy, McCarthy, Breen and Moles2004) found on soils that had an initial STP level of Index 1 or 2 that an annual application of 40 kg P/ha led to a decrease in STP levels, although the cumulative P balance after 4 years remained positive. The same study noted initial STP levels and soil type (soil series) as compounding factors influencing the decline in STP. The current experiment showed that after an initial period of change prior to reaching an equilibrium STP, a negative or neutral P balance did not increase soil STP levels. Thus, to increase the STP would have required a positive P balance (P surplus). The annual P deficit shows the extra amount of P fertilizer that is required to return a neutral P balance (neither surplus nor deficit). This approach is reflected in Teagasc P fertilizer advice (Coulter & Lalor Reference Coulter and Lalor2008), which suggests that on Index 1 soils an extra 20 kg P/ha should be applied while Index 2 soils require an extra 10 kg P/ha with Indices 3 and 4 having no additional P fertilizer requirement. This amount may be low considering the annual P deficits calculated in the present study. Jordan-Meille et al. (Reference Jordan-Meille, Rubæk, Ehlert, Genot, Hofman, Goulding, Recknagel, Provolo and Barraclough2012) found that some European countries applied 2–3 times the annual P offtake to the crop to replenish STP reserves in P-deficient soils. On this premise, using a factor of 2 in the present study and taking the annual P uptake from the present study for P0 at Sites 1 and 2 (28 and 20 kg P/ha/year, respectively) would result in a P fertilizer application rate during the build-up phase of 56 kg P/ha/year at Site 1 and 40 kg P/ha/year at Site 2 to maintain the STP levels.
The apparent P recovery is notably higher in Table 7 than in Table 6. In Table 7, again P15 at both sites in the present experiment recorded the greatest apparent P recovery, which also agrees with the P fertilizer requirement for herbage yield. Excluding the years prior to 2003 removes the confounding factor of soil P build-up and decline in the early years. This study shows that apparent P recovery and most likely P fertilizer use efficiency can be relatively high once the soils are in equilibrium and are receiving annual application of P fertilizer and supports findings by Johnston et al. (Reference Johnston, Poulton, Fixen and Curtin2014).
CONCLUSIONS
Phosphorus increased herbage yield but only for the first two harvests of the year, which coincided with lower soil temperatures. This suggests that there is a requirement for P fertilizer in early spring when grass growth begins and before plant roots can more actively exploit residual soil P. Further investigation would be of benefit in determining a critical temperature at which root proliferation increases and whether increasing soil P levels enables diffusion of P to plant roots at low soil temperature regardless of P fertilizer.
Consistent seasonal trends in herbage P concentration were found in the present study. As with herbage yield, there was a consistent increase in the herbage P concentration following P fertilizer application at the start of each year. Furthermore, P fertilizer was also important to maintain mid-season herbage P concentration levels, which was a critical point when low herbage P concentrations were observed.
Soil type had an influence over both STP decline and STP increase. The study identified two phases of STP movement during the duration of the experiment: (1) build-up/decline phase which in some instance could take up to 8 years and (2), an equilibrium/stabilization phase. Fertilizer P application were necessary to increase STP levels to the optimum level but need to be flexible to account for differences in factors such as soil type, management and nutrient offtake which were apparent in the present study.
The authors wish to acknowledge the continued effort of Teagasc staff at Johnstown Castle for facilitating and maintaining this long-term experiment. Special thanks to Noel Culleton for instigating the research project and John Murphy for his continued dedication to management and data collection.