INTRODUCTION
Measuring 14C/12C isotope ratios in samples with a carbon content of less than 10 μg C has become of increasing need during the last 10 years. Several laboratories put effort into developing sample preparation and accelerator mass spectrometry (AMS) measurement methods for samples in the 1 to 100 μg C range (e.g. Santos et al. Reference Santos, Moore, Southon, Griffin, Hinger and Zhang2007; Jenk et al. Reference Jenk, Szidat, Bolius, Sigl, Gäggeler, Wacker, Ruff, Barbante, Boutron and Schwikowski2009; Zhang et al. Reference Zhang, Liu, Salazar, Li, Zotter, Zhang, Shen, Schafer, Schnelle-Kreis, Prevot and Szidat2012). At the Vienna Environmental Research Accelerator (VERA), sample preparation methods for samples in the μg C range were developed, and laboratory carbon background was identified as the main limiting factor. For one specific application, the DNA of human brain cells, background during the complete sample preparation process, and AMS measurement could be reduced below 0.2 µg C (Bergmann et al. Reference Bergmann, Liebl, Bernard, Alkass, Yeung, Steier, Kutschera, Johnson, Landén, Druid, Spalding and Frisén2012). The diagnostic tools presented in Liebl et al. (Reference Liebl, Avalos Ortiz, Golser, Handle, Kutschera, Steier and Wild2010)—a residual gas analyzer (RGA) and 13C-enriched materials—were a prerequisite for developing the methods for handling more versatile kinds of samples presented in this work. These procedures have been successfully used in several applications (e.g. Singer et al. Reference Singer, Fasching, Wilhelm, Niggemann, Steier, Dittmar and Battin2012; May et al. Reference May, Wagenbach, Hoffmann, Legrand, Preunkert and Steier2013; De Clercq et al. Reference De Clercq, Heiling, Dercon, Resch, Aigner, Mayer, Mao, Elsen, Steier, Leifeld and Merckx2015) and some details of the 14C procedures are given there; however, no comprehensive publication exists so far. Sample preparation procedures were developed by means of test materials and actual sample material from applications, which is important for developing realistic procedures.
The first experience with ultra-small historical samples was gained by processing samples from an astronomical clock. The clock Planetenlaufuhr was constructed by Eberhard Baldewein, Hermann Diepel, and Hans Bucher for Elector August I of Saxony between 1563 and 1568 (Oestmann Reference Oestmann2010). A catgut string is part of the actuation system. In a scientific campaign including different kinds of material investigations, it was questioned whether the catgut in place now is original or was replaced later. The curators did not allow to sample a larger piece; only small, loose fibers (<50 µg C each) could be collected under the microscope.
SAMPLE PREPARATION OF µg SAMPLES
All sample handling was restricted to within a laminar airflow box to avoid contamination by dust particles from the laboratory atmosphere. Tweezers and microspoons were wiped with 5% NH3 before usage. All labware used, including disposable pipette tips, were blown clean with N2 inside a laminar airflow box to ensure removal of dust particles. A small tube oven was installed in this box, which allows to bake materials at up to 900°C under dust-free conditions. Our approach is based only on self-built equipment; no off-the-shelf instruments are used. This provides full control over construction materials, and thus allows rigorous cleaning (e.g. baking, submerging in acids, etc.). Additionally, the development of our procedures started by avoiding everything that could cause problems (copper oxide, zinc powder, silver powder, filters, extended storage, etc.); these ingredients were only added when they were found to be necessary.
Sample Processing Apparatus
To minimize contamination, the complete process, from the (cleaned) samples to production of graphite, is done inside the same hermetically sealed apparatus. Some construction principles (and parts) were adopted from an earlier version (Steier et al. Reference Steier, Drosg, Fedi, Kutschera, Schock, Wagenbach and Wild2006). The apparatus consists of a manifold with nine graphitization reactors, and separate sample introduction ports for each reactor. The tubing is stainless steel with Swagelok connectors, where the steel ferrules are replaced by PFA for ease of modification. PFA was preferred over PTFE because of the smaller gas permeability, but no corresponding investigations were conducted. Also, quartz vials are connected this way; however, ferrules must be replaced each time and a torque wrench has to be used to avoid breakage and to ensure tight connections. The connections are routinely tested with a helium leak detector. Valves used are mainly Swagelok plug valves (Swagelok SS-4P4T), with the standard O-rings replaced by Viton. A minimal amount of silicon grease is needed for smooth operation. Viton O-rings must never be cleaned by alcohol or acetone, as they will absorb and indefinitely exhale these substances. Servomotors were attached to most of the valves, to allow automated procedures. Vacuum is generally provided by a turbomolecular pump; larger amounts of water vapor are handled by a separate oil-free scroll pump. Depending on the sample type, lyophilization, oxidation, or hydrolysis with acid is carried out with the samples inside quartz vials connected via valves to separate ports for each reactor. The schematics of the different configurations used are shown in Figure 1.
The methods used to treat different kinds of small samples in the same kind of quartz vials: (1) sample in solution, (2) solid sample, (3) cold bath, (4) galvanic heating, (5) copper oxide wires, (6) quartz wool plugs, (7) ultraviolet (UV) lamps, (8) magnetic steerer sticks, (9) magnets.

Small Solid Samples
For μg-sized solid sample material, handling of the water-suspended samples using pipettes turned out to be advantageous. Acid-base-acid (ABA) pretreatment is carried out similar to that for large samples, but in smaller vials. For certain types of samples (e.g. aerosols on quartz filter disks), carbonates are removed by fumigation with concentrated HCl inside a closed glass vessel. To allow acid treatment in a dust-free atmosphere, we have set up an additional laminar-flow cabinet inside of an exhaust. The small amount of water accompanying the sample material is dried by (slow) evacuation without freezing.
Lyophilization of Samples in Solution
Methods for samples in solution were initially developed for processing DNA in aqueous solution (Bergmann et al. Reference Bergmann, Liebl, Bernard, Alkass, Yeung, Steier, Kutschera, Johnson, Landén, Druid, Spalding and Frisén2012) and the most extensive studies were carried out for this material (Liebl et al. Reference Liebl, Avalos Ortiz, Golser, Handle, Kutschera, Steier and Wild2010, Reference Liebl, Steier, Golser, Kutschera, Mair, Priller, Vonderhaid and Wild2013). The smallest sample, measured with an overall precision of 2.4%, was a 4.7 µg C DNA sample (2.2 µg C extracted as CO2). This example shows that significant losses occur for the smallest samples, the possible reasons for which are discussed below.
Samples are loaded to quartz vials that have been baked in laboratory atmosphere at 900°C for 2 hr beforehand (Figure 1a). The vials are closed with a PTFE plug valve and connected to the sample ports of the apparatus. The sample solutions are frozen from below by slowly tipping into liquid nitrogen, to avoid cracking of the sample tubes. Vacuum during sublimation is provided by the scroll pump connected via a dry-ice cold trap. A compressor-cooled isopropanol bath cools the frozen samples. The insertion depth into the isopropanol allows to control the sample temperature and thus the evaporation rate. Freeze-drying of 0.5 mL of aqueous solution takes place typically within 3 hr. More rapid drying resulted in significant loss of sample material. We attribute this to entrainment of small sample particles by the vapor flow (for “fluffy” samples we observed even scavenging of the whole sample). Once sublimation is complete, high vacuum from the turbomolecular pump is applied while the vials containing the dried samples are baked. The temperature and duration depends on the sample type.
The amount of carbon background contributed by the lyophilization step was investigated by adding small amounts of 13C-enriched glucose and by using the procedures described in Liebl et al. (Reference Liebl, Avalos Ortiz, Golser, Handle, Kutschera, Steier and Wild2010). A significant dependency on the water quality was observed. While 0.5 mL of fresh bidistilled water yielded 0.20±0.10 µg C, ultrapure DNase/RNase-free distilled water purchased from GIBCO® resulted in only 0.08±0.04 µg C. The latter result was only obtained when the sample shipping vials used were baked at 500°C and rinsed several times. Without rinsing, the contamination was increased to 0.25±0.06 µg C (6 to 11 samples were measured of each kind). Acidifying the water to pH 3 with HCl did not show a further reduction of the carbon background. The dried samples are combusted with the same procedure as other small solid samples.
Combustion
Copper oxide is a source of carbon contamination. Combustion of about 0.5 g of copper oxide in flame-sealed quartz vials, without any sample material, produced 0.36±0.14 μg C (four samples processed). Combustion of empty sample vials with bottled O2 (Air Liquide Austria, ≥99.5% purity) produced only 0.13±0.06 μg C (five samples processed). Therefore, combustion is carried out for µg-sized samples with gaseous oxygen, which is led through a liquid nitrogen cold trap to remove carbonaceous impurities. A pressure of about 200 mbar O2 is filled into the quartz vials holding the sample materials (2.5 cm3) (Figure 1b). The vials are sealed with modified Swagelok plug valves, where the plug is made of PTFE (PFA could not be used due to its insufficient mechanical stability). Different from the other valves in the system, Viton O-rings used in this place seem to cause carbon background of up to a few µg C. This may be caused by the fact that the valves become relatively hot during combustion. PTFE plugs need no grease to allow operation, but have to be replaced after a few dozen samples because of deformation. Combustion takes place in tube ovens directly at the apparatus at 900°C for a duration of 2 hr. This ensures complete combustion also for (small) solid pieces of graphite. Shorter combustion at lower temperature was sufficient for more fragile materials like DNA (0.5 hr at 800°C). To reduce the risk of carbon contamination, no silver is added. The combustion in vials closed by valves provides exceptionally low background (Liebl et al. Reference Liebl, Steier, Golser, Kutschera, Mair, Priller, Vonderhaid and Wild2013).
However, up to a few percent of cross-contamination between samples consecutively combusted with the same valve was observed. We think that this is caused by condensation of uncombusted sample evaporates in the valve, which is the coldest part of the combustion volume. This cross-contamination is no problem when limited precision is required and samples are of similar size and 14C content (like the DNA samples in Bergmann et al. Reference Bergmann, Liebl, Bernard, Alkass, Yeung, Steier, Kutschera, Johnson, Landén, Druid, Spalding and Frisén2012).
For larger samples (Figure 1c), about 0.1g copper oxide wires (Merck, p.a., wire 0.65 mm ×3 mm) are put between quartz wool plugs and supported by a 3-mm-diameter quartz rod above the samples. This allows to combust the copper oxide in a first step alone by lifting the tube oven such that the sample pokes out at the bottom. After removal of produced gases, copper oxide and samples are combusted together. The background achieved for this method is generally higher than with the combustion using oxygen, between 0.5 and 1.5 µg C.
For large samples, vials with copper oxide are flame-sealed and combusted offline (Figure 1d). We found a significant improvement in background when the precombustion of the quartz tubes was carried out in dust-free atmosphere. Up to 3 µg C were found for vials combusted in a small tube oven in standard laboratory environment; the same oven setup inside the laminar flow box resulted in background below 1 µg C. Nine individual tube crackers were constructed from tight-fitting stainless steel tubes with an O-ring compression-sealed connector in the middle. The Viton O-rings provide enough flexibility to crack the quartz vials without any scratching. Four-mm inner diameter vials of about 150 mm length and 1 mm wall thickness have been tested with up to 5 mg C.
UV Oxidation
This procedure was described in detail in Steier et al. (Reference Steier, Fasching, Mair, Liebl, Battin, Priller and Golser2013). The sample is oxidized by 180-nm UV light, directly in solution (Figure 1e). So far, this method was only applied in one project (Singer et al. Reference Singer, Fasching, Wilhelm, Niggemann, Steier, Dittmar and Battin2012), but it may be advantageous for other materials. It also bears the potential for a last, thorough cleaning of solid samples, while they are already inside the combustion vial. A carbon background of 1.1±0.7 µg C is observed (Steier et al. Reference Steier, Fasching, Mair, Liebl, Battin, Priller and Golser2013).
Carbonates
Carbonate samples are put into a small glass vial (5 mm outer diameter, 6 mm length) with the help of 2 µL of water. Some 0.5 mL of H3PO4 (85%) are put inside a larger diameter quartz vial (7 mm inner diameter, 200 mm length, Figure 1f). The sample is held above the liquid, supported by a magnetic steerer stick held by magnets from the outside. With a suitable adaptor for the larger diameter of these tubes, the larger vial is connected to the sample ports of the apparatus. After evacuation, the sample is submerged into the phosphoric acid, which is warmed to about 50°C with a hairdryer. The reaction completes usually within a few minutes, but solid pieces of marble may take longer than 1 hr.
A second magnetic steerer stick is held above the sample vial; it allows to push down the sample if it is stuck to the wall of the vial held by drops of the viscous acid. During the reaction, it stops bubbles of liquid ascending along the vial. Presently, larger vials than for other kinds of samples are used, but we plan to switch to the same size by using smaller steerer sticks and inner glass vials. IAEA-C1 carbonate with a mass of 45 to 160 µg C, and prepared with this method as the process blank for real samples, yielded an F14C between 3×10⁻³ and 7×10⁻³.
For all methods of sample preparation, the produced sample CO2 is frozen with liquid nitrogen inside the sample vials, and noncondensable gases are pumped off. Samples are then transferred to the reactors where the graphitization takes place, also using liquid nitrogen. During these steps, losses can take place. Adsorption to surfaces is a possible reason, and plays a larger role for smaller samples. Also, the removal of noncondensable gases is one critical point, as these losses do probably not scale with sample size.
Graphitization
Reduction to graphite is done by means of an iron catalyst (Vogel et al. Reference Vogel, Southon, Nelson and Brown1984). Graphitization reactors were constructed with a total volume of only 0.5 to 1.1 cm3 (depending on the dead volume of the pressure sensor used) by avoiding all unnecessary connecting pieces (Figure 2). They consist of a stainless steel body machined from one piece with two fittings only: one for the quartz vial for the iron catalyst and one for the pressure sensor (gas-type independent, PX72-015AV by Omega Engineering, Stamford, CT, USA). The reactor valve consists of a commercial valve plug (Swagelok SS-4P4T) mounted directly into the reactor steel body. Also, the cold trap to freeze out H2O produced during the graphitization process is machined out of the same steel body (Figure 2).
Graphitization reactor cross-section. Total reactor volume is 0.5 to 1.1 cm3 depending on the dead volume of the pressure sensor attached. The copper cold finger is cooled with dry ice and the temperature is regulated by galvanic heating. The quartz vial containing the copper holder with the iron catalyst is heated by a multitube furnace.

The same large batch of iron powder (Merck 3819, particle size 10 μm) is recombusted in laboratory atmosphere at 900°C for 4 hr before every use. About 0.5 mg of iron oxide is pressed (0.3 GPa) into a small copper holder with 1 mm inner diameter, 1 mm depth, 1.8 mm outer diameter, and 4 mm length. Different geometries were investigated in Liebl et al. (Reference Liebl, Steier, Golser, Kutschera, Mair, Priller, Vonderhaid and Wild2013), without any significant improvement of the performance. The holder is inserted into small quartz vials (2 mm inner diameter, 1 mm wall thickness, and 40 mm length), attached to the graphitization reactors of the apparatus, and baked at 915°C under vacuum. Reduction to elemental iron takes place in a H2 atmosphere of 850 mbar (Linde Gas Austria, ≥99.9999% purity) within 2 hr at 915°C. The H2 is renewed every 15 min, and for the majority of the cases no H2 pressure drop between renewing intervals is observed anymore after 1 hr. The high temperature of 915°C is used because it significantly reduces carbon contamination; a possible explanation for this effect may be oxidation of carbon residues in the iron by water from the iron oxide reduction. SEM images of the catalyst showed a reduced surface area for reduction at 915°C due to partial melting, compared to a lower reduction temperature of 600°C (Figure 3); however, no negative influence on the graphitization reaction was observed.
SEM images of vacuum and H2 baked iron catalyst without graphite (a, c, d) and with graphite (b). Vacuum baking was carried out at 815°C for 30 min, H2 baking was done at different temperatures for 2 hr for all samples. (d) shows pressed iron powder which was H2 baked at 300°C, (c) and (a) show pressed iron oxide powder reduced to iron at (c) 600°C and (a) 915°C. Graphite produced on an iron catalyst prepared at an H2 baking temperature of 815°C is seen in (b).

After preparation of the iron catalyst, the CO2 produced from the samples is cryogenically transferred from the sample vials to the reactors. During this step, the sample vial is kept at the dry-ice temperature to hold back H2O. The CO2 amount is measured manometrically and H2 is added. We use 2.5 times the pressure of sample CO2 plus a constant addition of 50 mbar, but we have not yet carried out systematic investigations on this topic.
The fastest initial reaction rate is observed for the highest catalyst temperature tested, i.e. 915°C. In our understanding (and based on investigations by Nemec et al. Reference Nemec, Wacker and Gäggeler2010), in a first phase CO2 is reduced to CO. However, after 1 hr the reaction stopped completely for small samples of about 10 μg C; larger samples proceeded, but at slow pace. By changing the catalyst temperature after the initial phase to 615°C, the reaction did continue and typically completed within 2 hr (Figure 4). We think that during this second phase CO is reduced to graphite. Changing the temperature during the reaction resulted in faster graphite formation and a more reliable graphitization reaction than achieved with any constant catalyst temperature. A total number of 50 samples were graphitized with different temperatures to support these findings. To understand the mechanism, for some of these test samples the catalyst temperature was again increased after the second phase had been completed at 615°C. The result was a pressure rise, which we interpret as a reversal of the second phase, i.e. C is again oxidized to CO with residual H2O. Also, the formation of CH4 in the presence of excess H2 may become relevant (see Nemec et al. Reference Nemec, Wacker and Gäggeler2010).
Typical pressure trends during graphitization reactions at different catalyst temperatures; within 10% deviation all three samples use the same amount of Fe catalyst (about 0.5 mg FeO reduced to Fe) and CO2 sample pressure equaling about 50 μg C. Catalyst temperatures were (A) 915°C during the first 45 min, then 600°C; (B) constant 915°C; and (C) constant 715°C. The dashed horizontal line indicates 90% completion of the graphitization process.

Graphitization reactions for small samples are strongly dependent on the partial pressure of H2O (Liebl et al. Reference Liebl, Avalos Ortiz, Golser, Handle, Kutschera, Steier and Wild2010; Nemec et al. Reference Nemec, Wacker and Gäggeler2010). Usually, cooling the water traps with dry ice (to a measured temperature of about –60°C) is sufficient to let the graphitization reaction run to completion. However, if the reaction stops prematurely (i.e. the observed pressure drop inside the graphitization reactor is significantly below three times the sample CO2 pressure), liquid nitrogen can be applied to the cold fingers instead of dry ice (Liebl et al. Reference Liebl, Avalos Ortiz, Golser, Handle, Kutschera, Steier and Wild2010). This was necessary only for a few very small samples of less than 2 μg C in CO2 and forced the graphitization reaction to continue until completion. This observation fits our model of the process because a reduction of the water partial pressure will also push the equilibrium of the second phase towards solid C. It can only work because in the second phase there is no more CO2, which would freeze out in the water trap at liquid nitrogen temperature.
Still, for samples below 10 µg C, the reaction did not start as reliably as for larger ones. Therefore, also the temperature of the cold trap in the first step was investigated. The apparatus allows to increase the temperature of the cold trap by electric heating above the cold bath temperature (dry ice). For 13 CO2 samples with about 10 µg C graphitized, all five samples with a cold trap temperature below –50°C and the two samples prepared above –16°C showed longer reaction times or insufficient pressure drops. Four out of six samples using –40°C and the two prepared at –28°C performed well. We selected –28°C as the cold trap temperature used in the first phase routinely.
We do not have a robust explanation why a higher temperature and higher water partial pressure in the first phase leads to a faster and more reliable reaction; a cleaning process of the catalyst, if degraded by reactive gases from the sample transfer, may play a role.
Notably, the copper holders for the catalyst lead to a slower and less reproducible reaction than observed for iron oxide without any holder. However, the handling of the small amounts of iron is very difficult and prone to sample loss, even if the iron is pressed to small pellets prior to use. Copper holders with graphitized samples are stored inside the reactor vials (or sometimes polyethylene tubes) until measurement. No effects coming from storage over 2 months were observed. To fit into the sample magazine, the copper sample holders are pressed into aluminum cathodes suitable for the MCSNICS ion source at VERA. During this step, also the graphite is compacted (3 GPa) by a disposable, smooth, stainless steel pin. AMS measurements at VERA are carried out as in Steier et al. (Reference Steier, Dellinger, Kutschera, Priller, Rom and Wild2004); no modification of the procedures is required for small samples.
Carbon Background in Graphitization and Graphite Handling
Carbon contamination in the final AMS target may originate from all steps of sample preparation and plays a major role when measuring 14C in μg-sized carbon samples. Process blanks and standards of similar size to the real samples have to be prepared for every batch, which allows to partly correct the influence of the laboratory background. However, these process blanks provide little insight into the origin of the carbon contamination; systematic investigations of the individual steps of the process are required to allow a further reduction. Part of these investigations, based on 13C-enriched materials and a residual gas analyzer (RGA), was described in Liebl et al. (Reference Liebl, Avalos Ortiz, Golser, Handle, Kutschera, Steier and Wild2010), and for the case of DNA, in Bergmann et al. (Reference Bergmann, Liebl, Bernard, Alkass, Yeung, Steier, Kutschera, Johnson, Landén, Druid, Spalding and Frisén2012). Only for DNA samples, the whole procedure was thoroughly studied, and an exceptionally low overall background below 0.2 µg C was reached. Development for other materials is ongoing and some results were quoted above. The graphitization process and the further handling of the graphite (i.e. pressing into sample holders, storage, and introduction into the ion source) is involved for all kinds of samples, and therefore of special importance. Unpublished investigations are described in the following.
Modern Background in Graphitization
Modern carbon contamination introduced during graphitization and AMS measurement was investigated using nominally 14C-free carbon CO2 from a gas bottle (Figure 5). From the results of 14C measurements of very large samples, the F14C of this gas was assumed to be 2×10⁻⁴. The data are best described by a contamination with 31±30 ng modern carbon. Below 10 µg C, there seem to be frequent outliers with elevated F14C. These samples typically also show larger uncertainties, which are caused either by low ion currents or, in other cases, bad reproducibility. An upper limit of 0.1 μg C for the total carbon contamination during graphitization was obtained from graphitizing 13C-enriched CO2. This limit is determined by the measurement precision of 13CO2/12CO2 measured with the RGA used.
Results from 14C AMS measurements of graphitized 14C-free carbon CO2. AMS raw data and results corrected for a “modern” carbon contamination of 31±30 ng C are shown.

The modern contamination introduced by the iron catalyst was further investigated by oxidizing three pellets of iron with oxygen inside the graphitization tubes instead of the usual procedure in air. Graphitization of 14C-free CO2 corresponding to ~5 µg C yielded an average modern contamination of 19±5 ng, while three controls prepared in air yielded 35±10 ng.
Handling and Pressing in Air
To explore the potential contamination from laboratory air, test samples were prepared inside an argon glove box. The gas regeneration system was equipped with an activated charcoal trap to remove volatile organic compounds, and a tube filled with NaOH to trap CO2. The CO2 concentration in the working gas was cryogenically determined to be below 5 ppm. Catalyst preparation (in a closed quartz vial under oxygen), sample handling, and graphite AMS target preparation were carried out in the glove box, and also the graphitization reactor assemblies were detached from the apparatus and only opened under argon. An air-tight container for the sample wheel and a plastic glove bag around the ion source allowed to transfer and to mount the sample magazine into the AMS ion source under argon.
Geological graphite allows 14C background measurements without graphitization. Graphite chips (~3 mg) from inside a 1-kg block (Kropfmühl AG, Kropfmühl, Germany) were pressed directly into AMS target holders. The five samples prepared inside the glove box yielded the lowest 14C/12C ratio observed at VERA so far: F14C=6.3×10⁻⁵ to 1.1×10⁻⁴; this is similar to the lowest measured 14C ratios ever published, by Taylor and Southon (Reference Taylor and Southon2007), on natural diamonds (F14C=5×10⁻⁵ to 3×10⁻⁴). Three samples prepared at VERA in laboratory air were about two times higher (F14C=1.3×10⁻⁴ to 2.9×10⁻⁴) than the samples prepared under argon. One of these samples was powdered in air; however, it yielded the middle value of the samples: 1.7×10⁻⁴, corresponding to a contamination with ~0.5 µg modern C. Fully processed blank samples with a size of 1 mg typically show a F14C>1×10⁻³; thus, the contamination from graphite handling in air is negligible. It is, however, difficult to extrapolate these findings to µg C samples, for which 0.5 µg contamination would be significant.
To assess the influence of laboratory air on µg C samples, six samples of 13C-DNA with nominally 2.17 µg 13C were processed in the glove box (but unfortunately not with the final procedures) and investigated with the methods presented in Liebl et al. (Reference Liebl, Avalos Ortiz, Golser, Handle, Kutschera, Steier and Wild2010). The contamination found ranged from 0.19 to 0.63 µg C, with a median of 0.45 µg C. Three samples prepared with the same procedures at the same time outside the glovebox yielded 0.34, 0.58, and one outlier with 5.4 µg C. Though the data are sparse, we see no indication for a significant background reduction when contact with laboratory air is avoided: this suggests that contamination coming from other sources contributes most of the carbon background.
Radiocarbon Dating the Catgut String of an Astronomical Clock
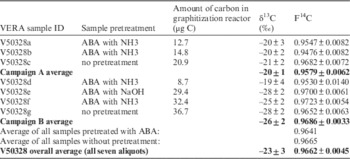
Several small pieces of catgut from the Planetenuhr with an estimated total amount of about 190 μg C were 14C dated with the new procedures for microgram samples. To test the reproducibility of the dating method and to exclude the possibility of undetected contamination, the pieces were prepared independently using different cleaning/pretreatment methods (Table 1). Pieces of sample material were processed without pretreatment and with the ABA method. Initial treatment used 0.5 mL of 1M HCl kept at 60°C for 45 min, with a transfer into 0.5 mL of 0.1M NaOH at 60°C during 30 min. The pH value and duration of the base treatment were varied for the further aliquots because the sample material dissolved. Alternative treatments were 0.5 mL of 0.01M NaOH for 30 min at 60°C or 0.5 mL 25% NH3 for 15 to 35 hr at room temperature. Subsequently, samples were put into 0.5 mL of 1M HCl for 30 min before being rinsed with water (<0.1 mL).
Results of 14C AMS measurements at VERA on small aliquots of a catgut sample from an astronomical clock built by Eberhard Baldewein between 1563 and 1568. All averages are weighted; the uncertainty of the mean is shown.

From a total number of nine small pieces, seven samples were pretreated successfully. Subsamples were measured in two independent measurement campaigns to assess systematic uncertainties. The agreement of the results with and without pretreatment suggests that no contamination of the untreated original sample material was present. AMS results were normalized to IAEA-C3 standard material, which was processed in parallel to the catgut samples and blank-corrected for 14C-free graphite, which also underwent the same sample preparation procedure. As the samples were expected to be close to F14C=1, the “modern” background is of minor importance, and only one size-matched 14C-free graphite sample (19 µg C) was processed, yielding F14C=0.0053±0.0005. Four IAEA-C3 samples with 6 to 54 µg C showed no clear trend of F14C with size; we therefore refrained from applying a size-dependent correction. The 14C content of the catgut sample was determined to be F14C=0.9662±0.0045 (Table 1), which is in agreement with the known age of the clock. By calibration with IntCal13 (Reimer et al. Reference Reimer, Bard, Bayliss, Beck, Blackwell, Bronk Ramsey, Buck, Cheng, Edwards, Friedrich, Grootes, Guilderson, Haflidason, Hajdas, Hatté, Heaton, Hoffmann, Hogg, Hughen, Kaiser, Kromer, Manning, Niu, Reimer, Richards, Scott, Southon, Staff, Turney and van der Plicht2013), this results in a 90% probability that the sample is older than cal AD 1670. This result supports the assumption that the string is original and was not replaced later. However, while the set has an acceptable χ2 of 1.4, the smaller samples below 20 µg C appear slightly older; if only the four samples above 20 µg (V50328c,e,f,g) are combined, the F14C increases to 0.9693±0.0031, corresponding to a probability of about 25% for an origin after cal AD1670. A size-dependent correction may lead to slightly increased precision, but would require a more thorough investigation to proof the validity.
CONCLUSIONS
Reducing carbon contamination incorporated into 14C AMS targets during sample preparation is a key issue when working with µg-sized carbon samples. An argon glove box cannot improve the background presently, and the conventional procedure of preparing the samples inside a laminar air flow box is sufficient.
A significant fraction of the background (~1 µg C) seems to enter during the sample extraction, be it combustion, hydrolysis, or UV oxidation. Only the thorough optimization of the procedures for certain kinds of samples seems to allow to go substantially below this level, as was the case for the lyophilization and combustion of DNA in solution (0.15 μg C found for processing 13C-enriched DNA, Liebl et al. Reference Liebl, Avalos Ortiz, Golser, Handle, Kutschera, Steier and Wild2010). The correction of the background limits the precision for small samples.
The in situ preparation of the iron catalyst used for reduction of CO2 allowed to decrease the amount of contamination during graphitization to a negligible level. The background of modern carbon during graphitization could be reduced to ~30 ng. The reliability for small samples was improved by optimizing the temperature of both the catalyst and the water trap.
By splitting a small sample from the astronomical clock Planetenuhr in even smaller samples, the agreement of the results allowed to exclude an influence of contamination. While the combined result reaches the precision of a typical archaeological measurement, the shape of the calibration curve did not allow to exclude that the investigated catgut string was replaced after the construction in the 16th century.
ACKNOWLEDGMENTS
We thank Christian Neelmeijer for organizing the sampling of the Planetenuhr. Jakob Liebl was supported by a University of Vienna research fellowship 2010 for carrying out his contribution to this work. The support of Kirsty Spalding (Karolinska Institute) for the DNA studies is gratefully acknowledged. A large number of graphitizations were carried out by pupil apprentices; we acknowledge especially the contributions of Marie-Christine Röhsner, Kirill Streltsov, and Kilian Sandholzer.