Implications
The Quarter Horse breed is renowned for its functional versatility, presenting abilities in several sporting activities. Among these activities, horse racing has the highest economic importance to the equine industry. Racing generates income, in the form of prizes and betting, but it is also a high-cost activity to train and maintain racing horses. The search for recent signatures of selection in the racing Quarter Horse, artificial or natural, allowed the identification of genes and DNA polymorphisms that might be useful as markers associated to racing performance. Association and validation studies will be required to confirm the relation of these markers with racing performance.
Introduction
Quarter Horses were the first breed to be developed in America and emerged in the United States in the 17th century. Selection of this breed for different purposes (Evans, Reference Evans1996) led to the formation of lines, including racing and cutting horses. The racing line explores the sprinting ability of the animals over short distances, whereas the cutting line is used in functional tests, exploring abilities such as agility, obedience and cow sense, which are important for the management of bovines on cattle ranches.
During domestication and breed formation, domestic animals have undergone natural and artificial selection. As a consequence, a genomic region containing multiple alleles or haplotypes could have become the only or most prominent region in the population, a situation known as positive selection. The identification of regions of the genome undergoing selection is of major interest and can be done exclusively by analysis of genomic patterns without the need for phenotypic information. Once identified and mapped, it is possible to annotate the biological function of these genomic regions and, consequently, to better understand how selection acts on complex traits of interest.
The main methods used for the identification of genomic regions undergoing positive selection include the long-range haplotype (LRH) test for the identification of these regions within populations, and the fixation index (F ST), which considers multiple populations. The LRH test, which detects recent positive selection by analyzing haplotype structure in random individuals of a population and relies on the relationship between the frequency of an allele and the extent of linkage disequilibrium (LD) between that allele and the loci that surround it, uses extended haplotype homozygosity (EHH) statistic. This analysis is based on contrasts between an extended core haplotype exhibiting high frequency and homozygosity and other core haplotypes at the same locus (Sabeti et al., Reference Sabeti, Reich, Higgins, Levine, Richter, Schaffner, Gabriel, Platko, Patterson, McDonald, Ackerman, Campbell, Altshuler, Cooperk, Kwiatkowski, Ward and Lander2002). On the other hand, the F ST measures genetic differentiation to identify signatures of selection. This statistical method assumes that variable selective forces favor different gene variants in different regions of the genome. As a consequence, differences in allele frequencies between populations may be more extreme in regions that harbor these variants (Qanbari et al., Reference Qanbari, Gianola, Hayes, Schenkel, Miller, Moore, Thaller and Simianer2011). The method screens patterns of variation over many loci and considers those located in the tail of the empirical distribution of F ST as outliers (Akey et al., Reference Akey, Zhang, Zhang, Jin and Shriver2002), with higher values indicating divergent selection and lower values indicating balancing selection.
In view of the above considerations, the objective of the present study was to identify genomic regions divergently selected in the racing line of Quarter Horses in relation to the cutting line using single nucleotide polymorphism (SNP) genotypic arrays. For this purpose, relative extended haplotype homozygosity (REHH) statistic, an extension of EHH analysis, was applied only to the racing line and the F ST was used for the analysis of racing and cutting animals. Annotation of genes underlying these genomic regions was made to identify those that could have been important during formation of the racing line and that could be used for the development of tools to increase selection efficiency.
Material and methods
Animals, SNP genotyping and data preparation
Whole blood samples (5 ml) were collected of 188 Quarter Horses of both sexes and registered at the Brazilian Association of Quarter Horse Breeders. Of these, 120 animals belonged to the racing line and 68 to the cutting line. Animals of the racing line, including 18 males and 102 females born between 1985 and 2007 to 48 stallions and 107 mares, were from five properties in the State of São Paulo, Brazil. Animals of the cutting line, including 26 males and 42 females born between 1991 and 2009 to 44 stallions and 64 mares, were from three properties of the State of São Paulo. The presence of full siblings was avoided in the two lines. All animal procedures used in the experiment were in accordance with the Brazilian legislation for animal welfare.
Genomic DNA was extracted from blood cells using the Illustra Blood GenomicPrep Mini Spin kit (GE Healthcare, Little Chalfont, Buckinghamshire, UK). The DNA concentration in the samples was adjusted to 40 to 60 ng/µl. Genotyping was performed with the Equine SNP50 BeadChip (Illumina Inc., USA) using the HiScan system (Illumina Inc.).
Quality control of the genotype data for individuals (188) and SNPs (54 602) was performed using the Genome Studio 2011.1 program (Illumina Inc.). Quality control of genotype data for individuals led to the exclusion of four animals of the cutting line because they presented a call rate of <0.95 (95%). With respect to SNPs, those located on the X chromosome with low genotyping accuracy (cluster separation <0.3; call frequency <0.9; P-value <1×10⁻³ for Hardy–Weinberg equilibrium) and a minor allele frequency <0.05 were removed. Thus, the final data set consisted of 184 individuals (120 racing and 64 cutting) and 42 058 and 40 787 autosomal SNPs from the whole sample of animals and from the sample of animals of the racing line, respectively.
Analysis within the racing line
After quality control filtering of SNPs, only the data set of the racing line, that is, 40 787 SNPs, was used for application of the LRH test. The FastPHASE software, configured with standard parameters, was used for haplotype reconstruction and inference on the linkage phases of SNPs on each Equus caballus autosomes chromosomes (ECA).
Since recombination rates can vary markedly across different regions of the genome, it is possible that higher EHH values are due to low recombination rates in a given region and not necessarily to recent positive selection. In this respect, REHH statistic corrects the observed EHH value at one core haplotype for the average level of EHH values for all relevant core haplotypes of the same chromosome. The Sweep 1.1 software program (Sabeti et al., Reference Sabeti, Reich, Higgins, Levine, Richter, Schaffner, Gabriel, Platko, Patterson, McDonald, Ackerman, Campbell, Altshuler, Cooperk, Kwiatkowski, Ward and Lander2002) was used for the detection of putative selection signatures in the core regions as defined by REHH analysis. This program implements the algorithm proposed by Gabriel et al. (Reference Gabriel, Schaffner, Nguyen, Moore, Roy, Blumenstiel, Higgins, DeFelice, Lochner, Faggart, Liu-Cordero, Rotimi, Adeyemo, Cooper, Ward, Lander, Daly and Altshuler2002), which defines a pair of SNPs to be in strong LD if the upper 95% confidence interval of D′ is between 0.7 and 0.98. It was specified that each core region should contain a minimum of 3 and a maximum of 20 SNPs. According to Qanbari et al. (Reference Qanbari, Pimentel, Tetens, Thaller, Lichtner, Sharifi and Simianer2010), core regions are defined as regions of interest in the genome characterized by strong LD between SNPs and that involve a set of core haplotypes. The EHH test was applied at a distance of 1 cm on both sides of the core region and to determine the significance of REHH values, that is, EHH values corrected for each ECA, the Sweep 1.1 program divides the haplotypes into 20 classes of frequency and compares the REHH value for each haplotype with other equally frequent haplotypes. The REHH values were log-transformed (−Log10) to achieve a normal distribution. Next, probability distributions, means, standard deviations and P-values were obtained and also transformed to −Log10 (P). Therefore, core haplotypes with extreme P-values in the distribution, that is, −Log10 (P) higher than 2 (P<0.01), were considered to be significant. However, according to Glick et al. (Reference Glick, Shirak, Uliel, Zeron, Ezra, Seroussi, Ron and Weller2012), REHH can serve as evidence of recent selection only for haplotypes present at relatively high frequency in the population. As a consequence, only core haplotypes with a frequency ⩾0.25 were considered to be relevant, since inferior values could be indicative of recombination events (Sabeti et al., Reference Sabeti, Reich, Higgins, Levine, Richter, Schaffner, Gabriel, Platko, Patterson, McDonald, Ackerman, Campbell, Altshuler, Cooperk, Kwiatkowski, Ward and Lander2002).
Analysis between the racing and cutting lines
Parameter θ=F ST was estimated for the final set of SNPs that passed the quality control criteria (considering all individuals; 42 058 SNPs) using the Bayesian method proposed by Gianola et al. (Reference Gianola, Simianer and Qanbari2010). This method is a two-step procedure that provides clusters of θ values. The first step consists of a simple Bayesian structure to remove samples from the posterior distribution of θ parameters without constructing Markov chains. This step, which uses Jeffrey’s rule (Bernardo and Smith, Reference Bernardo and Smith1994) assigns a weakly informative prior of β distribution (1/2,1/2) to allele frequencies and does not make assumptions about evolutionary models. The second step of the procedure consists of clustering a set of estimates of posterior means of θ=F ST from multilocus analysis into data-driven groups, considering that θ values derived from the same distribution or from different distributions resulting from heterogeneity of adjacent stochastic processes. The cluster structure was given by fitting a sequence of finite mixture models of posterior means of θ=F ST values for each locus, clustering loci according to their similarity in θ values. The models were compared using Akaike’s information criterion (AIC; Akaike, Reference Akaike1974), which is a measure of the relative quality of a statistical model for a given set of data and those with lower AIC values were preferred. The parameters of the model were estimated by the maximum likelihood method using the expectation–maximization algorithm implemented in the FlexMix package (Leisch, Reference Leisch2004) of the R Project. If the values of θ arise from different evolutionary or artificial processes, one would expect to observe a mixture of distributions that lead to clusters representative of the types of mechanisms operating; there may be various clusters harboring SNPs that underwent different processes of selection. For each SNP of each cluster, the conditional probability that θ belongs to this cluster was calculated. The SNPs of a cluster with higher θ values and a higher probability of belonging to this cluster probably reflect footprints of positive selection. Therefore, SNPs with high θ values and a conditional probability of belonging to the cluster ⩾95% were defined as selection signatures.
Gene annotation
For annotation of genes in genomic regions selected divergently in racing line of Quarter Horses in relation to cutting line, core regions with relevant haplotypes (i.e. regions with significant REHH values at P<0.01 and a haplotype frequency ⩾0.25) extended 1 Mb to both sides, which coincided with loci (SNPs) that belonged to a cluster with high θ=F ST values and with a conditional probability of belonging to this cluster ⩾95%, were selected. The genes corresponding to the genomic regions containing signatures of positive selection by the two statistical methods (REHH and F ST) and criteria used were identified based on the latest assembly of the horse genome sequence (EquCab2.0) using the NCBI Map Viewer tool (National Center for Biotechnology Information (NCBI), 2013). On the basis of the list of genes identified, a second list was generated that contained only genes with known function. These genes were annotated regarding the biological processes in which they participated using the Gene Ontology database and considering the species Homo sapiens. Genes whose protein products participate in biological processes related to important traits in the racing line of Quarter Horses were highlighted.
Results and discussion
Analysis within the racing line
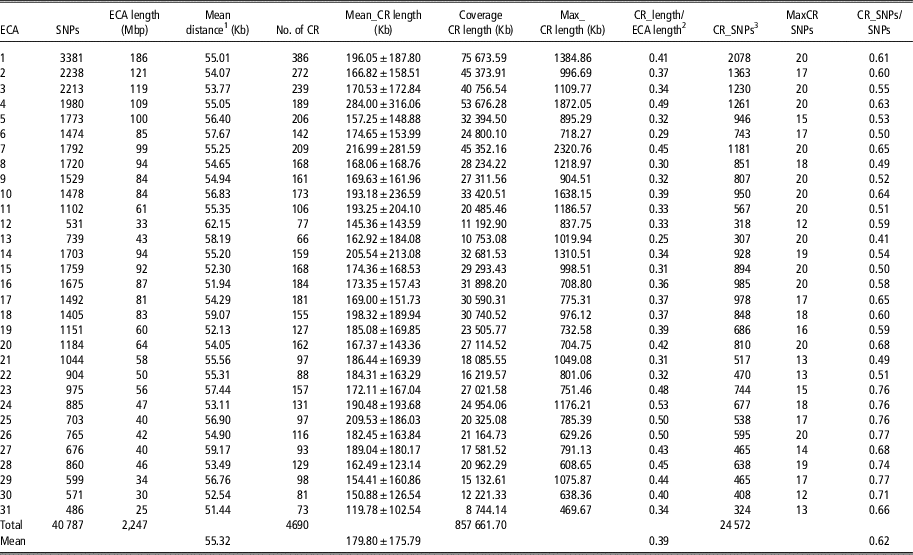
A summary of informative SNPs and core regions established after REHH analysis, using Sweep 1.1 software program (Sabeti et al., Reference Sabeti, Reich, Higgins, Levine, Richter, Schaffner, Gabriel, Platko, Patterson, McDonald, Ackerman, Campbell, Altshuler, Cooperk, Kwiatkowski, Ward and Lander2002), are provided in Table 1. This table also shows the proportion of ECA length covered by core regions in relation to the total length of each ECA, as well as the number of SNPs forming core regions in relation to the total number of informative SNPs.
Descriptive statistics of informative SNPs and CR in Quarter Horses of the racing line

ECA=Equus caballus autosomes chromosomes; SNP=single nucleotide polymorphism; CR=core regions.
1 Mean distance between SNPs.
2 The proportion of total core region lengths on ECA length.
3 Number of SNPs forming core regions.
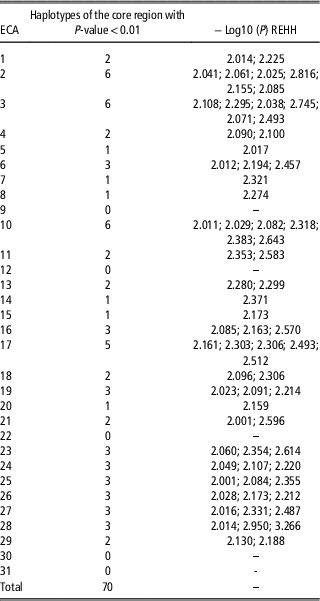
For the 4690 core regions identified, 34 258 EHH tests (mean of 7.31 tests per core region) were performed. Table 2 shows the LRH statistics, including the outliers for each ECA. Among the 12 340 tests applied to core haplotypes with a frequency ⩾0.25, 70 regions presented peak outliers at a threshold of 0.01, indicating that these regions might be under recent selection. These regions were present in larger numbers on ECA 2, 3, 10 and 17. According to Myles et al. (Reference Myles, Tang, Somel, Green, Kelso and Stoneking2008), alleles that are subject to selection present higher EHH (REHH) values than alleles of similar frequency that have not undergone selection. Other haplotypes present on the chromosomes in which selection signatures were identified had a shorter extent of homozygosity, demonstrating high recombination during the formation of the line. Therefore, the long runs of homozygosity observed in these regions are unlikely to be due to low recombination rates, but rather reflect selection pressures.
Statistical results of the application of the LRH test to the genome of Quarter Horses of the racing line
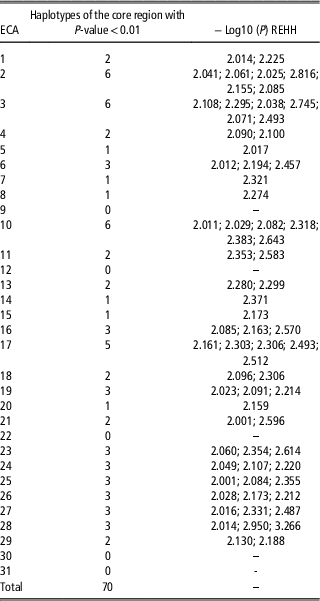
LRH=long-range haplotype; ECA=Equus caballus autosomes chromosomes.
Qanbari et al. (Reference Qanbari, Pimentel, Tetens, Thaller, Lichtner, Sharifi and Simianer2010) used SNPs of the Illumina Bovine SNP50 BeadChip and the REHH test to evaluate LD and the decay of haplotype homozygosity in some candidate regions harboring major genes related to milk production and quality in Holstein–Friesian cattle. In general, the authors found high values of LD and slow decay of haplotype homozygosity, indicating the validity of the approach for the identification of selection signatures. Glick et al. (Reference Glick, Shirak, Uliel, Zeron, Ezra, Seroussi, Ron and Weller2012) used the LRH test together with direct analysis of changes in haplotype frequencies over time to provide evidence of selection in a population of Holstein–Israeli cattle. The positive correlation of 0.34 between the two approaches demonstrated that the LRH test was able to detect haplotypes that suffered significant and recent changes in their frequency, indicating signatures of selection. Using EHH statistics to identify genome-wide selection signatures in Holstein–Friesian cattle, Qanbari et al. (Reference Qanbari, Pimentel, Tetens, Thaller, Lichtner, Sharifi and Simianer2010) found 161 regions (P<0.01) that showed signs of recent positive selection. The larger number of regions indicative of positive selection identified by these authors, who used an SNP chip of the same density and the same significance criteria for the REHH test as in the present study, suggests more diverse (for different economically important traits) and intense selection in dairy cattle when compared with Quarter Horse racing, one of the most recently domesticated large animal species (Aberle and Distl, Reference Aberle and Distl2004). According to Glick et al. (Reference Glick, Shirak, Uliel, Zeron, Ezra, Seroussi, Ron and Weller2012), an increase of selection intensity should result in changes in the number of loci that respond to selection and faster changes in haplotype frequencies which, in turn, increase REHH values.
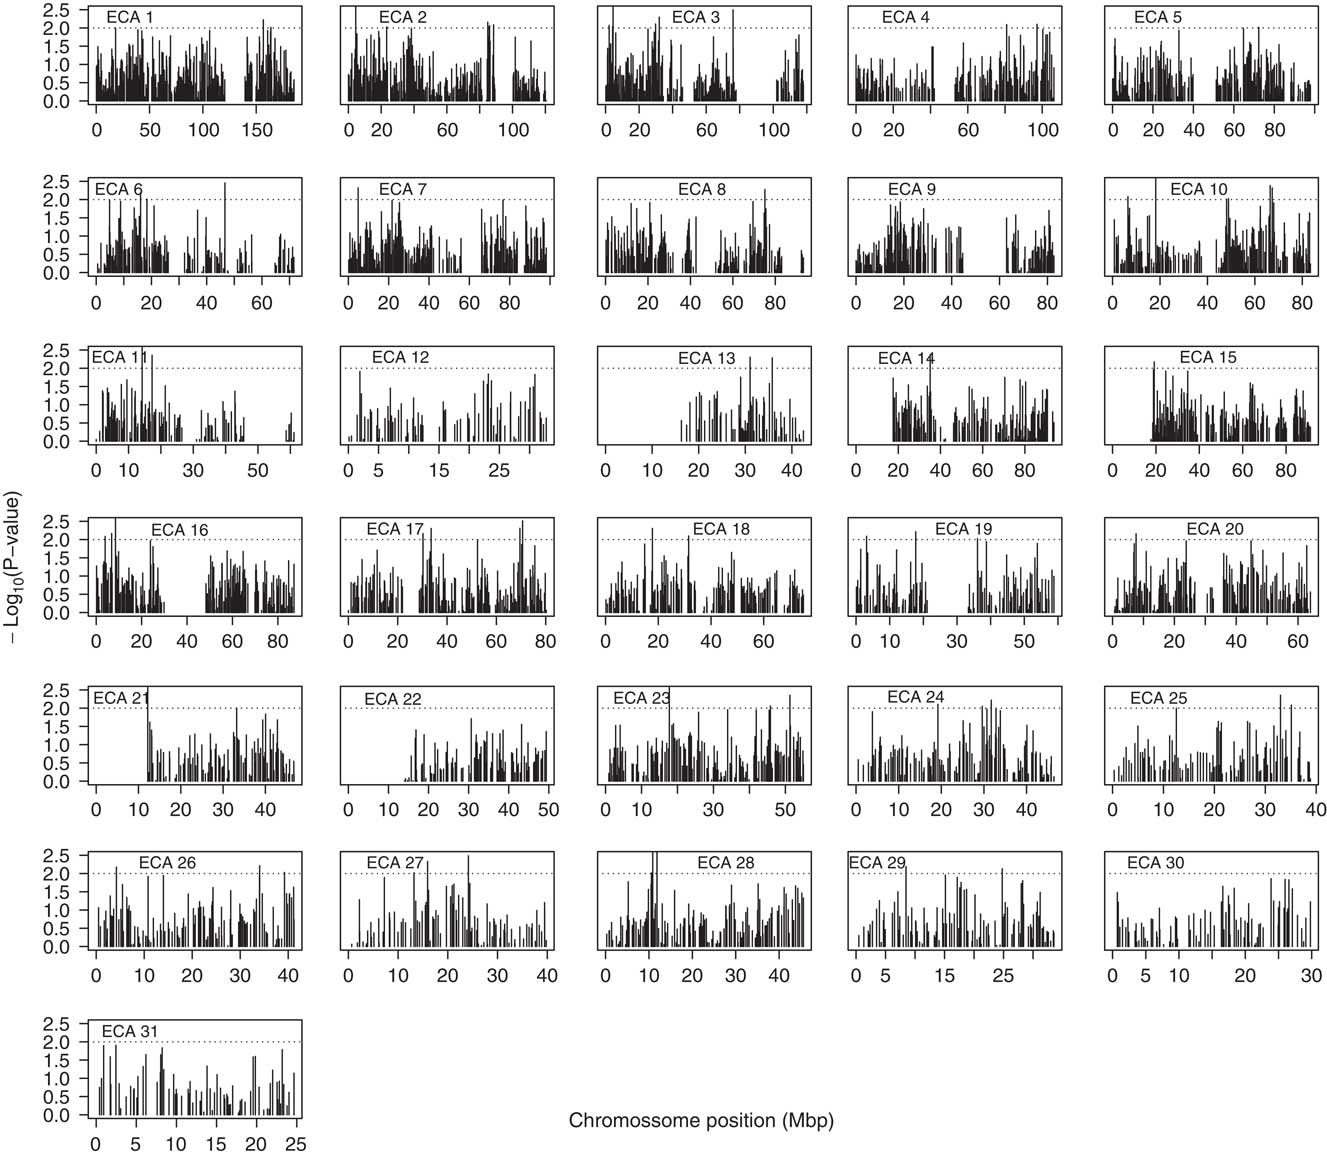
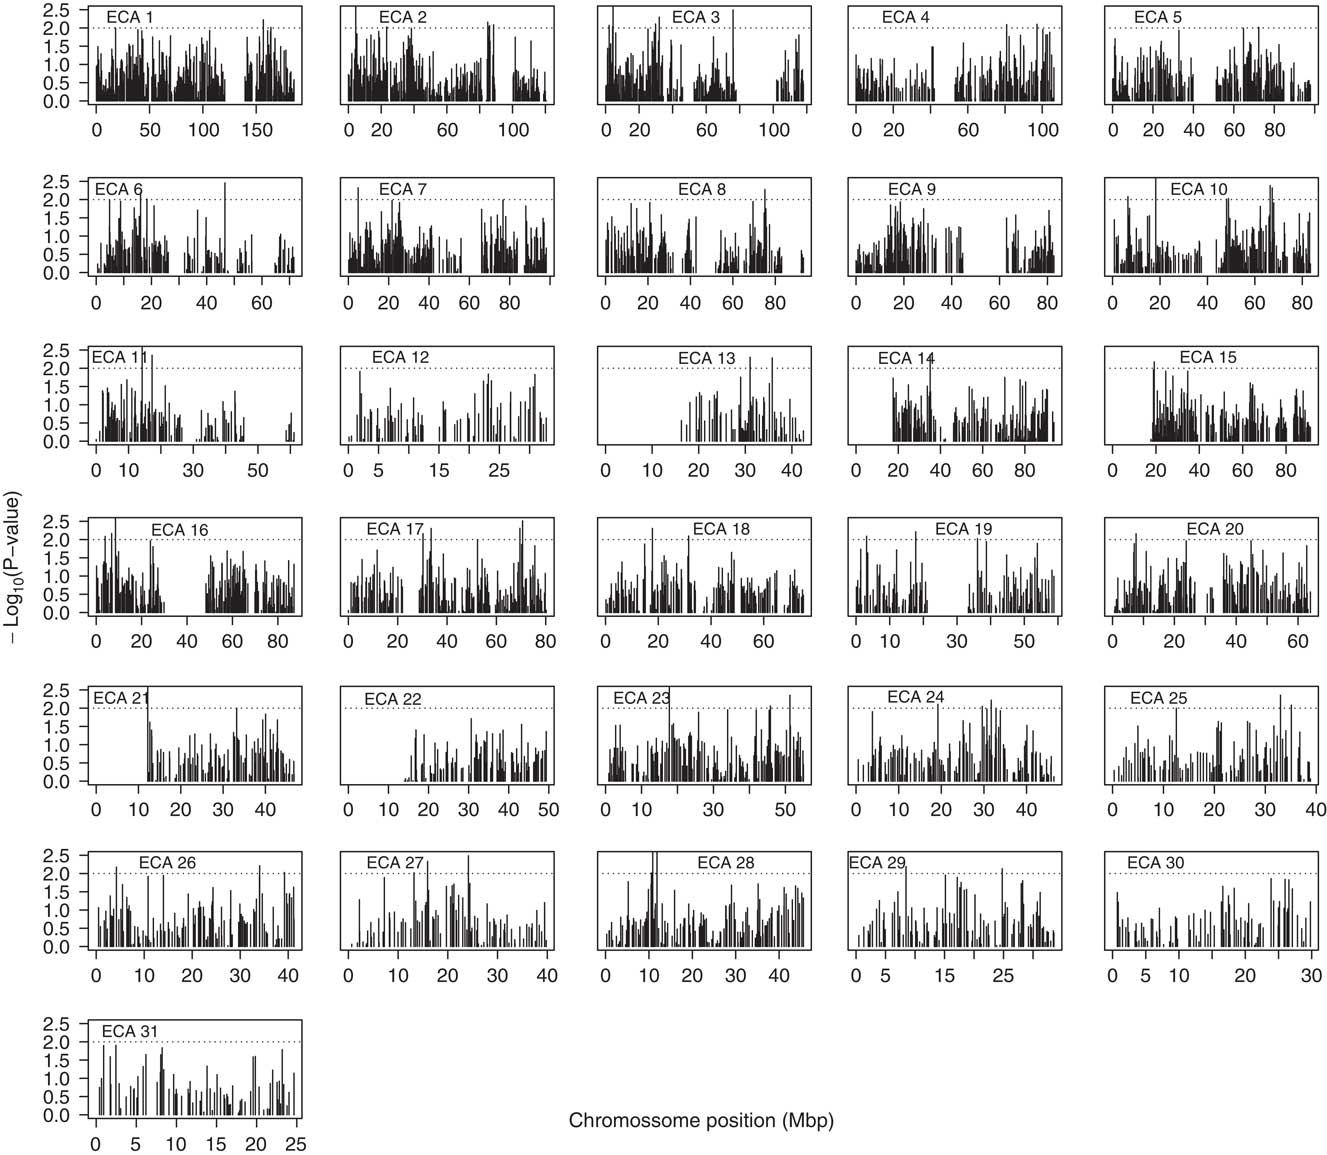
For better visualization of the distribution of putative selection signatures across the genome, the transformed P-values of the REHH test were plotted against the position of the haplotypes on the ECA (Figure 1). It can be noticed that the signatures were not distributed uniformly across the genome, with the absence of significant selection signatures on ECA 9, 12, 22, 30 and 31.
Map of putative selection signatures in the genome of Quarter Horses of the racing line identified by REHH analysis. Only haplotypes with a frequency ⩾25% were considered. Dashed lines indicate P<0.01.
Analysis between the racing and cutting lines
The mean value of parameter θ=F ST (±standard deviation) estimated for the 42 058 informative SNPs, considering both lines, was 0.0342 (±0.0403), with θ ranging from 0.0025 to 0.3556. The global F ST value obtained by Petersen et al. (Reference Petersen, Mickelson, Cleary and McCue2014), who used genome-wide SNP data from Quarter Horses represented by six performance groups (halter, western pleasure, reining, working cow, cutting and racing) to examine genetic diversity within the breed, was 0.035. With the exception of the working cow and cutting horses, pairwise F ST values show significant population structure among the six performance groups with the highest divergence observed between the cutting and racing (0.074). It is possible to speculate that this observed difference, 0.074 v. 0.0342 (present data), is due to a possible stronger selection in these lines of Quarter Horses in the United States than in Brazil.
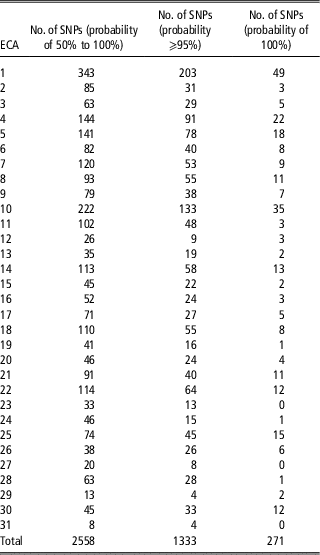
The AIC favored the finite mixture model with seven clusters for the 42 058 loci (SNPs), since this model with seven clusters obtained the lowest AIC value. According to Gianola et al. (Reference Gianola, Simianer and Qanbari2010), the expectation is that these clusters are representative of different processes that occurred in the populations, such as positive and/or negative directional selection, balancing selection and neutrality. In the absence of directional selection, all F ST values are expected to derive from the same stochastic evolutionary process and therefore share the same distribution. If, however, the differentiation of a breed or line is not only based on genetic drift, but directional selection is active and operates differently in different genomic regions, a higher degree of differentiation is expected for some regions when compared with the average differentiation caused by genetic drift. In the present study, cluster 4 comprising 2558 loci presented higher θ values (large differentiation), reflecting potential selection signatures. Of these, 1333 and 271 loci showed a conditional probability of belonging to this cluster, ⩾95% and 100%, respectively (Table 3). The θ value for the 1333 loci ranged from 0.1383 to 0.3556, with the 15 highest values (0.3013 to 0.3556) being found on ECA 1, 2, 4, 5, 8, 9, 10, 16, 21 and 30.
Number of SNPs identified by F ST analysis with probabilities of 50% to 100%, ⩾95% and 100% of belonging to cluster 4, clustered according to their similarity in θ values

SNP=single nucleotide polymorphism; ECA=Equus caballus autosomes chromosomes.
Annotation of genes in genomic regions divergently selected in the racing line in relation to cutting line
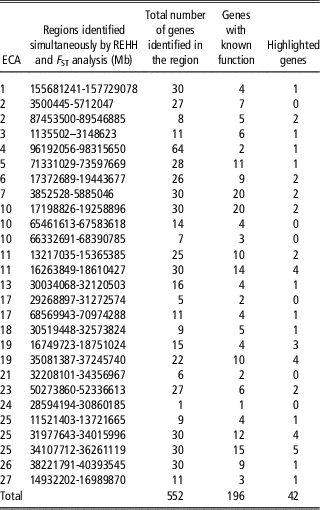
To identify regions of the genome divergently selected in the racing line in relation to cutting line, 70 core regions with relevant haplotypes obtained by REHH analysis, which coincided with 1333 loci (SNPs) identified by F ST analysis, were used. Thus, 27 regions distributed on ECA 1, 2, 3, 4, 5, 6, 7, 10, 11, 13, 17, 18, 19, 21, 23, 24, 25, 26 and 27 were considered (Table 4). According to Walsh (Reference Walsh2010), investigators have applied different tests as enrichment procedure to correct for demographic events, with regions presenting significant results based on a series of statistics being strong evidence of selection signatures.
Genomic regions identified simultaneously by REHH and F ST analysis in Quarter Horse racing, total number of genes identified in these regions, genes with known function and possible candidate genes related to performance in the line

REHH=relative extended haplotype homozygosity; ECA=Equus caballus autosomes chromosomes.
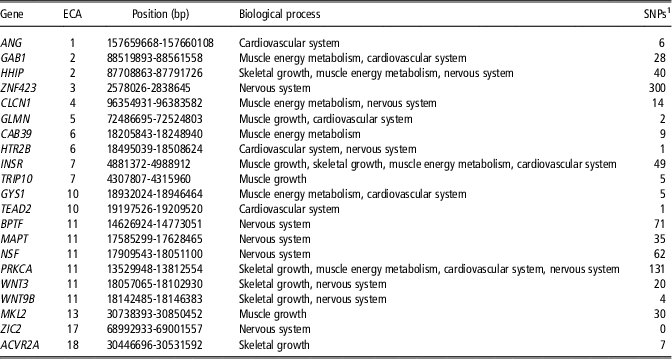
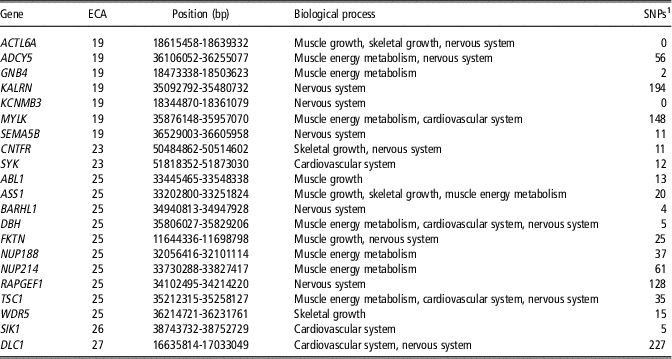
Using the coinciding regions, the equine genome sequence (EquCab2.0) was searched for functional annotation of genes in order to identify those that might have been important during formation of the racing line and are therefore related to athletic phenotypes aimed at speed and performance. According to Evans (Reference Evans2007), the evaluation of the roles of several body systems as causes of limited performance in horses is reasonable and should include the pulmonary, cardiovascular and neuromuscular systems, in addition to anaerobic and aerobic mechanisms of energy supply. In this respect, of a list of 552 genes identified, 196 were genes with known function, which were annotated with the biological processes in which they participate. Genes involved in muscle growth (8), skeletal growth (10), muscle energy metabolism (15), cardiovascular system (14) and nervous system (23) were identified. Taken together, 42 genes were candidates since their protein products participate in biological processes related to important traits in the racing line (Tables 5 and 6). Of the 552 genes identified, 49 had SNPs from a core region. Of these, 17 showed known functions and three are on the list of candidates (GAB1, INSR and ADCY5).
Genes related to biological processes of the muscular, skeletal, cardiovascular and nervous systems and muscle energy metabolism located on ECA 1, 2, 3, 4, 5, 6, 7, 10, 11, 13, 17 and 18 near selection signatures in the genome of Quarter Horses of the racing line and the number of SNPs identified in these genes

ECA=Equus caballus autosomes chromosomes; SNP=single nucleotide polymorphism; NCBI=National Center for Biotechnology Information.
1 Source: NCBI (2013).
Genes related to biological processes of the muscular, skeletal, cardiovascular and nervous systems and muscle energy metabolism located on ECA 19, 23, 25, 26 and 27 near selection signatures in the genome of Quarter Horses of the racing line and the number of SNPs identified in these genes

ECA=Equus caballus autosomes chromosomes; SNP=single nucleotide polymorphism; NCBI=National Center for Biotechnology Information.
1 Source: NCBI (2013).
Although the breed was formally recognized in 1940 with the establishment of the American Quarter Horse Association in United State of America, according to Evans (Reference Evans1996), the first recorded races of these animals were held in 1674. Individuals used for racing are typically taller and leaner for short bursts of speed and with phenotypes similar to those of Thoroughbreds (Scott, Reference Scott2008). Cutting animals began to be selected only in 1898 for participation in cutting events, looking for cow sense, that is, the perception of the reaction of cattle. This type was smaller, more compact, robust and strong (Evans, Reference Evans1996; Scott, Reference Scott2008). In agreement with these data, Meira et al. (Reference Meira, Curi, JAIIV, Corrêa, Oliveira and Mota2013) identified significant differences between racing and cutting Quarter Horses in terms of morphological traits. The authors observed that racing animals were heavier and taller and presented greater body lengths and perimeters than cutting horses.
The temperament of a horse determines its success in a specific sport discipline or at a given type of work (Mills, Reference Mills1998), since it is the combination of appropriate temperament and physical traits that forms a winning athlete. Therefore, throughout history individuals have searched for horses with certain temperamental characteristics suitable for their intended use (Mills, Reference Mills1998) and, to increase the prevalence of preferred temperamental characteristics in the population, the trait is commonly included as a breeding objective. These efforts resulted in the creation of breeds and lines that differ in temperament. Energetic horse breeds, such as racing animals, are more reactive, whereas cold blood breeds, such as most pulling and cutting horses, are quiet and calmer. Quarter Horses vary widely in conformation and temperamental characteristics. The slim and hot-tempered type, which often has a Thoroughbred influence, is appropriate for racing. These characteristics are not suitable for cutting horses which should be obedient, easier to control (especially during lateral movements), serene and much more compact, that is, smaller withers height and greater shoulder width (B. Langlois, personal communication).
Although different physical and behavioral attributes would be necessary for different types of competitive horses, the success in competitions mainly depends on the metabolic capacity of the animal to convert chemical into mechanical energy. Components of these energy processes include supply of glucose and oxygen by the cardiovascular system and the rate, efficiency and interaction of aerobic and anaerobic metabolism in muscles. According to Freeman (Reference Freeman2013), horses perform different types of physical exercise, ranging from predominantly aerobic to predominantly anaerobic. Quarter Horse races are mainly anaerobic, whereas some arena performance classes, such as cutting and reining, modalities performed by the cutting line of Quarter Horses, intercalate short bouts of anaerobic exercise with longer periods of aerobic activity (Freeman, Reference Freeman2013).
The superiority of the cardiovascular system of Thoroughbred horses, which are skilled runners, is related to the fact that the size of the heart per unit body weight is proportionally greater when compared with other large mammals (Gunn, Reference Gunn1989). Analysis of the pedigrees of Quarter Horses shows that the influence of Thoroughbreds is so marked that it permits to follow the so-called ‘large-heart gene’. The main objective of the integration of the cardiovascular and respiratory systems is the transfer of oxygen from the upper airways to skeletal muscle mitochondria and the removal of residual products, such as carbon dioxide, in the opposite direction. Therefore, the adequate maintenance of capillary vessels that transport blood to and from the muscle is of the utmost importance for performance. According to Henckel (Reference Henckel1983), physical exercise can induce angiogenesis (capillarization) in the muscles of horses.
Among the genes identified near selection signatures in the racing line of Quarter Horses that are related to the biological processes of growth, muscle energy metabolism and nervous and cardiovascular systems, the following genes will be discussed: FKTN, INSR, GYS1, CLCN1, MYLK, SYK, ANG, CNTFR and HTR2B. According to NCBI (2013), the number of SNPs mapped in these genes is 25, 49, 5, 14, 148, 12, 6, 11 and 1, respectively, considering the species E. caballus (Tables 5 and 6). Of these genes, ANG, CNTFR, GYS1 and MYLK are considered candidates for performance and health-related fitness phenotypes in humans (Bray et al., Reference Bray, Hagberg, Pérusse, Rankinen, Roth, Wolfarth and Bouchard2009).
Many of the genes highlighted and discussed below are implied in diseases or disorders in humans and horses, however, it should be noted that different nucleotide changes occurring in these genes may result in milder phenotypes that do not cause physical incapacity, or even phenotypes favorable to the development of higher athletic potential. Thus, these putative different gene forms would be under selective pressures.
In humans, mutations in FKTN (fukutin) are associated with altered glycosylation of α-dystroglycan, causing Fukuyama congenital muscular dystrophy. This condition is characterized by delayed motor development, muscle weakness, loss of muscle mass and hypotonia, and is associated with central nervous system anomalies and ocular disorders (Murakami et al., Reference Murakami, Hayashi, Noguchi, Ogawa, Nonaka, Tanabe, Ogino, Takada, Eriguchi, Kotooka, Campbell, Osawa and Nishino2006).
Mutations in the INSR (insulin receptor) human gene cause a spectrum of hereditary insulin resistance syndromes that can lead, for example, to growth retardation (Kim et al., Reference Kim, Cho, Yeau, Park, Sohn, Kwon, Kim, Ki and Jin2012). According to Suagee et al. (Reference Suagee, Corl, Wearn, Crisman, Hulver, Geor and McCutcheon2011), insulin resistance in horses is associated with obesity, an increased risk of laminitis, osteochondrosis and rhabdomyolysis, in addition to defective glucose transport in skeletal muscle and adipose tissue. The most important implication of insulin resistance in horses is laminitis, a disease affecting the locomotor system of the animal, with consequent low performance in any type of activity.
Mutations in the GYS1 (glycogen synthase 1) are associated with polysaccharide storage myopathy (PSSM), a disease characterized by high concentrations of glycogen and glucose-6-phosphate in skeletal muscle and abnormal accumulation of amylase-resistant complex polysaccharide (Aleman, Reference Aleman2008). Animals diagnosed with PSSM are reluctant to exercise and present poor performance, rhabdomyolysis, weakness, gait abnormalities, and muscle atrophy and stiffness (Aleman, Reference Aleman2008; Barrey, Reference Barrey2010). A nucleotide polymorphism in GYS1, identified by McCue et al. (Reference McCue, Valberg, Miller, Wade, DiMauro, Akman and Mickelson2008), causes the substitution of a guanine with adenine and changes the amino acid arginine to histidine (Arg309His) in affected Quarter Horses. Stanley et al. (Reference Stanley, McCue, Valberg, Mickelson, Mayhew, Mcgowan, Hahn, Patterson-Kane and Piercy2009) investigated whether this mutation in GYS1 occurs in horses from the United Kingdom with histopathological evidence of PSSM and rhabdomyolysis. Among 47 horses with rhabdomyolysis or poor performance, 21% carried the mutation in GYS1 and 25% of the breeds with this mutation were Quarter Horses, Appaloosa or related breeds. According to McCoy et al. (Reference McCoy, Schaefer, Petersen, Morrell, Slamka, Mickelson, Valberg and McCue2014), the region surrounding the Arg309His mutation exhibits several signatures of selection, including high-derived allele frequency and lack of haplotype diversity surrounding the mutation. However, to these authors, the persistence of the GYS1 mutation in the Quarter Horse population cannot be attributed to selection but is likely the result of founder effect and a recent population expansion. In the present study, it is also possible to speculate that the potential for this locus has high REHH and divergent F ST due to drift is high given the two sample design.
In humans, mutations in CLCN1 (chloride channel, voltage-sensitive 1) cause two forms of muscle diseases with different patterns of inheritance (NCBI, 2013), which are characterized by slow muscle relaxation after voluntary contraction or electrical stimulation, stiffness and muscle weakness. The main function of chloride channels is to stabilize the cells’ electrical charge, permitting normal muscle contraction. In a case study of a New Forest pony, Wijinberg et al. (Reference Wijnberg, Owczarek-Lipska, Sacchetto, Mascarello, Pascoli, Grunberg, van der Kolk and Drogemuller2012) reported a missense mutation in the CLCN1 gene that was associated with a phenotype of hereditary recessive myotonia. According to Nollet and Deprez (Reference Nollet and Deprez2005), horses with this syndrome show gait abnormalities and stiffness after birth and these symptoms get worse after a period of rest.
In a study of MYLK (myosin light chain kinase) genotypes in 157 predominantly Caucasian men and women, Clarkson et al. (Reference Clarkson, Hoffman, Zambraski, Gordish-Dressman, Kearns, Hubal, Harmon and Devaney2005) demonstrated an association between individuals homozygous for the rare alleles 49T and 3788A and an increase of creatine kinase and myoglobin when compared with the wild-type genotypes. In addition, elevated concentrations of creatine kinase and myoglobin were strongly associated with the T allele of the MYLK gene. The A allele was associated with a loss of post-exercise strength, with both polymorphisms probably increasing the risk of rhabdomyolysis and acute kidney failure. In view of these findings, the MYLK gene has been indicated as a functional candidate gene for physical performance in both humans (Bray et al., Reference Bray, Hagberg, Pérusse, Rankinen, Roth, Wolfarth and Bouchard2009) and horses (Schröder et al., Reference Schröder, Klostermann and Distl2011).
The SYK (spleen tyrosine kinase) has been implicated in different functions, including the morphogenesis of endothelial cells and maintenance of vascular integrity in vivo (Yanagi et al., Reference Yanagi, Inatome, Ding, Kitaguchi, Tybulewicz and Yamamura2001). Recently, Kazerounian et al. (Reference Kazerounian, Duquette, Reyes, Lawler, Song, Perruzzi, Primo, Khosravi-Far, Bussolino, Rabinovitz and Lawler2011) confirmed the participation of SYK in angiogenesis in human cell cultures. Missense variants in the ANG gene (angiogenin, ribonuclease, RNase A family, 5), an angiogenic factor that is expressed in ventral horn neurons and upregulated by hypoxia, were detected in patients with amyotrophic lateral sclerosis from Ireland/Scotland, North America, Italy, France, Holland and Germany (Fernandez-Santiago et al., Reference Fernandez-Santiago, Hoenig, Lichtner, Sperfeld, Sharma, Sperfeld, Sharma, Berg, Weichenrieder, Illig, Eger, Meyer, Anneser, Münch, Zierz, Gasser and Ludolph2009). This disease causes muscle weakness accompanied by hardening of the muscles (sclerosis), first on one side of the body (lateral), muscle atrophy (amyotrophic), cramps, tremor, abnormal reflexes, spasms and loss of sensation.
SNPs in CNTFR (ciliary neurotrophic factor receptor) may be associated with variations in muscle strength, as well as early onset of eating disorders (NCBI, 2013). De Mars et al. (Reference De Mars, Windelinckx, Beunen, Delecluse, Lefevre and Thomis2007) examined multiple polymorphisms at both the CNTF and the CNTF receptor (CNTFR) loci in a study of 493 middle-aged and older men and women with measures of knee flexor and extensor strength. T-allele carriers of the C-1703T CNTFR polymorphism exhibited higher strength levels for multiple measures compared with CC homozygotes, including all knee flexor torque values. In middle-aged women, A-allele carriers at the T1069A CNTFR locus exhibited lower concentric knee flexor peak torque at multiple speeds and isometric torque at 120 compared with T/T homozygotes.
The HTR2B (5-hydroxytryptamine (serotonin) receptor 2B, G protein-coupled) gene encodes one of the several different 5-hydroxytryptamine (serotonin) receptors, which belong to the G protein-coupled receptor 1 family. Serotonin receptors mediate many of the central and peripheral physiological functions of serotonin, including the regulation of cardiovascular function and impulsive behavior (NCBI, 2013), that is, an action executed without delay, reflection, voluntary direction or obvious control in response to a stimulus. Family- and population-based analysis in humans of a minor allele, which blocks the expression of the protein, and knockout studies in rats suggest a relationship between this gene and impulsivity (Bevilacqua et al., Reference Bevilacqua, Doly, Kaprio, Yuan, Tikkanen, Paunio, Zhou, Wedenoja, Maroteaux, Diaz, Belmer, Hodgkinson, Dell’Osso, Suvisaari, Coccaro, Rose, Peltonen, Virkkunen and Goldman2010).
Conclusions
The combined use of high-density SNP genotyping arrays and REHH and F ST statistics permitted the identification of regions in the horse genome that were divergently selected in racing Quarter Horses in relation to cutting. Gene annotation in these regions was used to identify genes that could have been important during formation of the racing line and that are related to racing performance. These genes should be used in the future in association studies on Quarter Horse racing for the development of tools to increase selection efficiency. In these studies, gene SNPs responsible for amino acid exchange, located at microRNA binding sites or related to other functional modifications will be privileged.
Acknowledgments
The authors thank the horse farms for providing the Quarter Horses and the financial support of Fapesp and Capes. They also thank the invaluable contribution of the late Professor Dr Marcílio Dias Silveira da Mota.