


Introduction
The water within temperate ice can occupy three possible locations: open fractures or closed voids, conduits and interstitial spaces between ice grains (Reference Fountain and WalderFountain and Walder, 1998). These features can play a role in water flux to the bed, through either routing or storage of surface melt. Surface melt generation has long been linked to the sliding activity of glaciers (Reference WillisWillis, 1995; Reference Fountain and WalderFountain and Walder, 1998), and more recently to the outlet glaciers of the Greenland ice sheet (Reference Zwally, Abdalat, Herrin, Larso, Sab and SteffenZwally and others, 2002). Additionally, water and how it is stored significantly impacts ice rheology (Reference DuvalDuval, 1977). There-fore, understanding the spatial distribution of water within glaciers has important implications for glacier dynamics.
The velocity of radar wave propagation in glaciers is highly sensitive to the presence of liquid water because of the large velocity contrast between ice (v = 0.168mns–1) and water (v = 0.032 mns–1). This strong sensitivity allows us to estimate the relative proportions of ice and water via a dielectric mixing model (Reference Macheret, Moskalevsk and VasilenkMacheret and others, 1993; Reference MooreMoore and others, 1999; Reference Murray, Stuar, Fr, Gambl and CrabtreeMurray and others, 2000; Reference Bradford and HarperBradford and Harper, 2005).
Common-midpoint (CMP) analysis is often used to estimate radar velocity in glacier ice (Reference Blindow and ThyssenBlindow and Thyssen, 1986; Reference Macheret, Moskalevsk and VasilenkMacheret and others, 1993; Reference Murray, Gooc and StuartMurray and others, 1997, 2000; Reference Copland and SharpCopland and Sharp, 2000). In the CMP method, data are acquired over a range of source–receiver offsets while maintaining a common midpoint. The root-mean-square (RMS) radar velocity above a given reflector is then estimated by fitting the normal-moveout (NMO) equation (Reference YilmazYilmaz, 2001) to the travel-time vs offset curve. Actual propagation velocities between reflectors, or interval velocities, are then estimated from the RMS velocities using Dix inversion (Reference DixDix, 1955). However, the NMO approach with Dix inversion can result in substantial uncertainty (Reference Barrett, Murra and ClarBarrett and others, 2007; Reference Murray, Boot and RippinMurray and others, 2007). Of course the inherent limitations of NMO analysis and Dix inversion have long been recognized. The Dix interval velocities are highly sensitive to RMS velocity errors and can become unstable, even when the RMS errors are relatively small. Additionally, the inherent NMO assumptions of planar, flat-lying reflectors and small lateral and vertical velocity gradients are often violated. Within the body of a temperate glacier, planar reflections are rarely observed, while diffractions from pointlike scatterers, typically from macro-scale water bodies, are common (Reference Watts and EnglandWatts and England, 1976; Reference Jacobel and AndersonJacobel and Anderson, 1987; Reference BamberBamber, 1988). NMO analysis of these diffracted signals can lead to large errors in the RMS velocity estimate (Reference Bradford and HarperBradford and Harper, 2005). This error can be corrected using dip-moveout processing (Reference DeregowskiDeregowski, 1986), but this requires high-density CMP sampling.
We can avoid the NMO approach by measuring radar velocity directly from the scattering hyperbolae observed in common-offset sections. In a polythermal glacier, Reference MooreMoore and others (1999) estimated englacial velocities by fitting hyperbolic curves directly to diffraction travel times measured in common-offset georadar sections. Reference Bradford and HarperBradford and Harper (2005) applied common-offset migration velocity analysis to investigate a temperate glacier. This method integrates both diffractions and bed coherence to estimate velocity structure. Both of these methods are limited by the distribution of scattering diffractions. Diffractions may not be present or may not have a distribution suitable to adequately detail the velocity structure for a particular application.
A second method estimates the interval velocity structure from multi-offset data using travel-time inversion methods. Reference Harper and BradfordHarper and Bradford (2003) applied the method of Reference Zelt and SmithZelt and Smith (1992) to snowpack velocity structure; the analysis incorporated travel-time picks of both the direct wave and reflections. However, travel-time inversion methods are user-intensive and require detailed travel-time picking which can be impractical for large and/or complex datasets. Further, identifying coherent reflection events may be difficult if the wavefield is complex, as is typical within the body of a temperate glacier.
A third alternative to NMO analysis is pre-stack depth migration (PSDM) velocity analysis. PSDM is currently recognized as the most accurate method of imaging reflection data, and advances in computational efficiency have made it practical (see Leading Edge special issues on migration: May 2001; December 2002; June 2005). The method requires continuous multi-fold data acquisition, which is now feasible with multichannel georadar systems. A few authors have explored the potential of PSDM in the analysis of georadar data (Reference Leparoux, Giber and CôtLeparoux and others, 2001; Reference Pipan, Fort, Dal Mor, Suga and FinettPipan and others, 2003). Reference BradfordBradford (2006) reviewed PSDM with reflection tomography for georadar velocity analysis and imaging. Reference BradfordBradford (2008) showed that the method is capable of resolving spatial velocity heterogeneity on the order of one to three wavelengths at the dominant signal frequency.
We use multi-fold georadar data and Reference StorkStork’s (1992) method of reflection tomography in the PSDM domain to improve the accuracy of velocity estimates from surface georadar measurements on Bench Glacier, Alaska, USA. Our objective is to compute the liquid-water-content distribution along a multi-kilometer profile. We improve the water-content estimates assuming a three-phase system (water, air, ice) and the complex refractive index method (CRIM) (Reference Wharton, Haze, Ra and BestWharton and others, 1980). Further, we incorporate a depth-dependent estimate of the air-bubble volume within the glacier ice.
Methodology
Velocity analysis
PSDM operates on continuous multi-fold data prior to stacking and is not subject to the assumptions of NMO analysis. The output of PSDM is a set of common-image-point (CIP) gathers in depth. A CIP gather is similar to a CMP gather, but is defined only in the post-migration domain. Reflection events in a correctly migrated CIP gather originate from a common reflection point. In a CMP, this is only true for planar, flat-lying reflections. Traces in the CIP gathers are stacked to suppress noise and produce a final subsurface image.
PSDM depends strongly on the depth velocity model, so accurate velocity estimation is critical. When the data are migrated with the correct velocity model, a reflection in the CIP gather is imaged at a depth that is independent of offset (Fig. 1a). If the velocity model is wrong, reflectors are not flat-lying, and this apparent offset-dependent depth is defined as residual moveout (RMO). RMO shows increasing depth with offset if the velocity above the reflector is too high, or decreasing depth with offset if the velocity is too low.
(a) Sensitivity of PSDM to velocity errors illustrated with a simple two-layer model; and (b) processing flow for reflection tomography in the PSDM domain. The flow on the upper left is a standard CMP processing flow with the primary objective of producing a starting velocity model for PSDM. The PSDM flow can be iterated if necessary to minimize RMO.

We use Reference StorkStork’s (1992) method of reflection tomography, which seeks to minimize RMO in CIP gathers in the post-migration domain. The method takes advantage of reflector coherence and continuity in the post-migrated domain, thereby improving the processor’s ability to interpret coherent reflecting horizons, particularly in a complex subsurface setting. A processing flow to apply the method is illustrated in Figure 1b. Pre-processing steps include a typical NMO processing sequence with a prime objective of producing a starting velocity model. PSDM is then applied with the starting velocity model, and RMO of the output is measured using semblance along user-specified horizons. The velocity model is updated via tomographic inversion, with the objective of minimizing RMO. The process may be continued iteratively until the RMO is reduced to an acceptable level.
Water-Content Estimation
With an accurate velocity estimate, we may then use any one of a number of petrophysical transforms to estimate the liquid-water content. Here we wish to include the air bubbles in our calculation, which may comprise 10% or more of the ice volume near the upper surface of the glacier (Reference Bradford and HarperBradford and Harper, 2005; Reference West, Rippi, Murra, Made and HubbardWest and others, 2007), so we must choose a mixing relation that can incorporate the three-phase system (ice, water, air). We utilize the CRIM equation which is easily formulated to include any arbitrary number of components. The CRIM equation is justified theoretically by assuming that the propagation within each component is proportional to its volumetric concentration. Assuming zero conductivity and that magnetic permeability is equal to that of free space, we solve the CRIM equation for liquid-water content to obtain

where θ is the component’s volume fraction, v is the electromagnetic wave velocity within that component, and subscripts ‘w’, ‘i’ and ‘a’ refer to the water, ice and air phases respectively. Lack of a subscript indicates a bulk system property.
The water content depends on two unknowns: the bulk velocity and the air fraction. The bulk velocity is the measured parameter, but we need an independent estimate of the air fraction. We first assume that the mass of air trapped in bubbles is constant throughout the glacier and is defined by specifying the volume at the upper surface of the ice. For mountain glaciers with maximum thickness on the order of 200 m or less, ideal gas behavior is an appropriate assumption. The volume of air will vary as a function of pressure and temperature. In a temperate glacier, the ice is following the pressure–temperature equilibrium curve and therefore the temperature may also be written as a function of pressure given by

where T is the ice temperature, T 0 = 273.15 K, ±0 is the rate of change of the melting point with pressure for air-saturated water (Reference Paterson and W.S.BPaterson, 1994), and P is pressure. We then write the volumetric concentration of air as a function of pressure
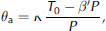
where K is the gas constant divided by a unit volume computed at the glacier surface (atmospheric pressure).
We next assume that pressure is hydrostatic and ignore deviatoric stresses related to the flow field. The assumption that flow stress is insignificant is not generally valid, but quantification would require detailed modeling of any particular glacier system. Rather, we include this as a significant contributor to our air volume uncertainty. Because air has a much higher velocity than water, the water-content calculation has only a weak dependence on air content, particularly below air volumetric concentrations of around 5%.
The hydrostatic pressure, Pz , depends on the bulk ice density, which also is a function of θ a. We can write the pressure as the sum of discrete volume elements
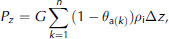
where G is gravitational acceleration, ρ i is the density of ice (0.917 g cm–3) and Δz is the depth step which we set to 1 m in our calculation. Combining Equations (3) and (4), we can write the volumetric air content at any particular depth as

We construct our depth-dependent mixing equation by inserting Equation (5) into Equation (1).
Equation (5) requires an estimate of air-bubble volume at the glacier surface. Reference West, Rippi, Murra, Made and HubbardWest and others (2007) suggest that trapped air bubbles may occupy as much as 15–20% of the ice volume in the upper layers. Radar velocity measurements by Reference Bradford and HarperBradford and Harper (2005) indicate up to 16% air content in the upper layer of Bench Glacier. Here we use the commonly assumed density of 0.825 g cm–3 (10% air bubbles) for the surface of glacier ice. This value is roughly consistent with our observations on Bench Glacier.
Assuming θ a = 0.1 at the surface, Equation (5) yields the curve shown in Figure 2. θ a decreases rapidly from 10% at z = 0 to <5% at 10 m. This is consistent with Reference West, Rippi, Murra, Made and HubbardWest and others’ (2007) suggestion that air content is <5% below the upper few meters of the glacier. The rate of bubble compression decreases substantially below 40 m, with bubbles occupying just under 1% of the volume at 200m depth. Equation (5) yields a curve that is consistent with the borehole video observations of Reference Harper and HumphreyHarper and Humphrey (1995) in the ablation zone on Worthington Glacier located ~20 km from Bench Glacier at a similar elevation. There, they inferred a significant decrease in bubble content with increasing depth.
Vertical distribution of air volume vs ice depth computed assuming ideal gas behavior and hydrostatic pressure.
Uncertainty Analysis
There are four significant sources of uncertainty in our water-content estimate: (1) measured radar velocity, (2) calculated air volume, (3) azimuthal anisotropy in the velocity distribution and (4) the accuracy of the CRIM equation. Of these, we can make reasonable quantitative estimates of (1), (2) and (3). We expect that the CRIM equation will not accurately account for the geometry of water and air inclusions, but do expect the CRIM estimated water-content trend to be valid, even if there is some small shift in the magnitude of water-content values.
The accuracy of the velocity measurement is scale-dependent; as the measurement is averaged over larger spatial scales, the accuracy improves. To estimate the uncertainty in our velocity estimate, we first look to the controlled experiment conducted by Reference Bradford and ClementBradford and Clement (2006) at the Boise Hydrogeophysical Research Site. Using a geometry similar (relative to target depth) to that used in this study, they showed that Stork’s method of reflection tomography is capable of measuring georadar velocities to within about 2%, when averaged vertically over a few wavelengths. When averaged laterally, over several wavelengths, the uncertainty improves to about 1%.
We are interested in large-scale changes in bulk water content. We therefore apply 150m horizontal and 25m vertical smoothing operators during the tomographic inversion. For our 25 MHz signal, these operators result in smoothing of about 30 wavelengths laterally and 5 wavelengths vertically. At this scale of observation, we believe we can safely assume an uncertainty in our velocity estimates of 2%.
We have measured azimuthal velocity anisotropy on Bench Glacier (Reference Nichols, Bradfor, Harpe and MikesellNichols and others, 2007), but the degree varies both axially and in the cross-glacier direction and therefore is not easily quantified without three-dimensional acquisition. We expect that the primary sources of azimuthal anisotropy are subvertically oriented, planar voids that are filled with water and have a preferred azimuthal orientation. From our previous measurements, we believe that this anisotropy adds ±1% to our velocity uncertainty estimate.
As discussed above, the uncertainty in our air-content estimate is substantial and it is important here to recognize that our velocity measurement averages not only over air bubbles, but also over other air-filled void space such as crevasses. Fortunately, the water-content calculation is not strongly dependent on the air volume, especially when θ a < 0.05, as it is over most of the glacier thickness. We assume an uncertainty of ± 50% in θ a, which will encompass a broad range of possible scenarios and encompasses the range of values estimated from radar velocity measurements on Bench Glacier.
With estimated uncertainties as given above, we calculate the uncertainty in water content as follows:

where σ v and σ a are the water-content uncertainties caused by velocity and air volume respectively. We compute these contributions from the partial derivatives with respect to each parameter, yielding

and

where δv/v = 0.03 and δθ a = 0.5θ a.
Field Study
Bench Glacier, Chugach Mountains, Alaska, (Fig. 3) is a temperate valley glacier with no tributaries, an unusually simple geometry and a low and a relatively uniform slope. It is 8 km long, and gradually increases in width from approximately 600 m near the terminus to nearly 1.5 km at the upper accumulation zone. The surface slope averages 10˚ along the length of the glacier; there are two nearly flat reaches, and one small icefall which separates the accumulation and ablation zones. Previous borehole drilling and preliminary radar measurements show the glacier has a parabolic cross-section, and the ice thickness over most of the glacier is on the order of 150–200 m. Borehole video and bed penetration tests suggest the glacier, at least in many locations, has a ‘hard bed’ (i.e. widespread/thick till is not present).
Map of the Bench Glacier surface, with the location of the radar profile running along the length of the glacier shown in yellow. For reference, the profile discussed by Reference Bradford and HarperBradford and Harper (2005) is indicated. Inset is map of Alaska indicating the study site. The profile lies within the ablation zone which begins at the base of the icefall. Contours are 50 m.
In previous radar imaging, Reference Bradford and HarperBradford and Harper (2005) discovered two distinct layers within the ablation zone of the glacier: an upper layer defined by a notable lack of scattering diffractions and radar velocity greater than that of crystalline ice, and an underlying layer defined by numerous scatterers and radar velocity lower than that of crystalline ice. The upper, radar-transparent layer is areally extensive, reaches from the surface to a typical depth of 20–50 m, and pinches out near the midpoint of the ablation zone without reappearing in the lower part of the glacier. Radar velocity in the transparent layer ranges from 0.168 to 0.174 mns–1 with a mean of 0.170mns–1. Velocities greater than 0.168 mns–1 require that the ice contain some volume of air, which may be present in small features such as bubbles or larger features such as fractures or englacial voids. The lower layer is typical of radar observations made on temperate glaciers. Its velocities of 0.150–0.164mns–1 indicate water substantially greater than the few hundredths of a percent volumetric concentration present at ice grain boundaries (Reference West, Rippi, Murra, Made and HubbardWest and others, 2007). The majority of the water is therefore likely within voids having dimensions on
the order of a few centimeters up to several meters. Such voids are necessary to explain the scattering that is typical of temperate ice (Reference Brown, Harpe, Bradfor and HumphreyBrown and others, 2006).
In previous work, Reference Bradford and HarperBradford and Harper’s (2005) estimates of radar velocity in the first 100m of ice thickness were primarily constrained by diffraction hyperbolae. Based on sensitivity analysis, they concluded that the results were accurate to within about 2%. Their velocity in the deeper portion of the glacier was primarily constrained by coherence along the bed reflection, which we estimate has an uncertainty on the order of 5–10%. Here we reduce the uncertainty in our velocity estimate and better constrain the large-scale water distribution.
Data Acquisition
We acquired a total of 3.5 km of two-dimensional (2-D) multi-offset georadar data along a 3500 m long profile that runs along the axis of the glacier from just below the icefall to just short of the terminus (Fig. 3). The profile was entirely contained within, and covers the majority of, the ablation zone. We conducted the work during early June when shallow snow cover (1.5–2 m) enabled easy snow-machine access to the entire glacier surface. We utilized a Sensors and Software pulseEKKO PRO system with multichannel adapter with one 25 MHz transmitter and three 25 MHz receivers (Fig. 4). The set of four antennas were towed via snow machine, and the data were acquired in a total of five passes along the profile, with a different offset range on each pass. We acquired alternating passes traveling in opposite directions. Traces were acquired continuously while moving at a rate of 5–10km h–1 using an odometer wheel trigger. The odometer wheel was studded with screws to minimize slip. A set of four traces was acquired for a single transmitter/receiver pair every 0.5 m, and all three source/receiver pairs were sampled every 1.5 m. In assigning geometry for multi-fold data processing, we binned the data into 1.5m CMP bins so that the full offset range was included within each CMP bin.
Photograph of the multichannel georadar system used for multi-offset data acquisition. In this first-pass configuration, the source/receiver offsets were 5, 10 and 15 m. Four additional passes were completed with variable offsets to complete a dataset with offset ranging from 5 to 150 m.
We used a geodetic-grade differentially corrected global positioning system (GPS), time-calibrated to the radar system to accurately measure source and receiver locations. We mounted the GPS antennas on the transmitting-antenna sled and center receiving-antenna sled (Fig. 4). From past experience with this system, we believe that our positions are accurate to within about 10 cm in the horizontal and vertical directions. We used a 5 m receiver spacing for the 5–30m offset range, 10 m spacing for the 30–90m offset range, and 20m spacing for the 90–150m offset range. This geometry provided good coverage of shallow reflectors while maintaining adequate offset for good velocity control to the bed.
Data Processing
We applied a time-zero correction, bandpass-filter (6–12–50–100 pass band), CMP stacking at ice velocity (0.168mns–1) to produce a time-domain image, and PSDM with reflection tomography to produce a depth-domain image and velocity model. Our time-zero correction compensates for the slightly different length fiber-optic cables that connect each receiver to the control unit and utilizes the direct airwave and transmitter/receiver offset to compute the channel-dependent, time-zero correction. We utilized a Kirchhoff PSDM algorithm that computes the Green’s function and topography-corrected migrated data from a specified elevation datum. The reflection tomography algorithm also utilized travel times and a gridded velocity model that were referenced to the true source and receiver elevations.
Results
We first applied PSDM with a constant velocity (0.168mns–1). Then we computed RMO along the bed reflection and along a set of discontinuous reflectors that define the base of the radar-transparent zone (Fig. 5). These RMO values were then input to the tomographic inversion algorithm, which produced the final velocity model (Fig. 6).
(a) CMP stack using a constant velocity of 0.168mns–1 for the NMO correction; and (b) PSDM image. The bed reflection is clearly evident in both images. The radar-transparent zone is most clearly seen in the CMP stack. We used an aggressive stretch mute for the PSDM image, which eliminated the upper part of the section but minimized stretch-related errors in the RMO analysis.
(a) Final velocity model from reflection tomography; (b) estimated liquid-water content; and (c) water-content uncertainty. The volumetric water content in the radar-transparent zone is 0.0–0.005 within our uncertainty limits. This, coupled with a higher percentage of air in the ice volume, leads to higher radar velocities. Volumetric water content in the deeper, radar-scattering layer varies from 0.01 to 0.025, and causes an abrupt decrease in radar velocity. Water-content uncertainty is greatest near the surface (~0.0085) where air volume uncertainty dominates. Deeper in the glacier, velocity uncertainty is dominant and water-content uncertainty decreases to ~0.007. The uncertainty estimates are well below the reported water content within the deep scattering zone.
The CMP and PSDM stacks clearly image the glacier bed and boundary between the transparent and scattering layers (Fig. 5). We find that velocities (Fig. 6a) within the radar-transparent zone average 0.170 mns–1 but range from 0.168 to 0.174mns–1. This is consistent with our assumption of a significant volume of air-filled void space in this part of the glacier and is similar to previous measurements made by Reference Bradford and HarperBradford and Harper (2005). In the radar-scattering layer, the maximum measured velocity is 0.164 mns–1, and the average velocity is 0.160 mns–1. The decrease from high to low velocity is relatively abrupt, and it is clear that the transition from high to low velocity corresponds to the transition from radar-transparent ice to the zone of strong radar scattering.
The volumetric water-content estimates (Fig. 6b) are inversely correlated with the velocity and show low water content in the radar-transparent zone where all estimates fall within ±0.005 of zero. Negative values result when our estimated air volume is too low. Water-content uncertainty (Fig. 6b) varies between 0.0068 and 0.0087, with the highest uncertainty at the glacier surface where uncertainty in the air fraction dominates the calculation. Therefore, within estimated uncertainty, the water content is effectively zero within the radar-transparent zone. Within the scattering layer, water-content estimates fall between 0.010 and 0.025. In this high-water-content zone, the air volume is very low, and the water-volume uncertainty estimate is dominated by velocity uncertainty.
Discussion and Conclusions
It is important to consider the potential for error due to out-of-plane effects that are manifest in our 2-D data. Since there are scatterers distributed throughout the glacier volume, our data necessarily include scattered energy that originates from outside the plane of the profiles. However, because of the radiation pattern of the linear dipole antennas, the data are inherently aperture-limited. Using the simplified beam model of Reference Annan and CoswaAnnan and Cosway (1992), we find that within the upper 40m where scatterers are rare, significant energy recorded in our profiles will originate from within 14m of the profile plane. We do not expect this to have a significant impact on our velocity estimates.
Our measurements within the radar-transparent layer indicate that θ w ≈0–0.005 within error bounds. We recognize that there is necessarily a small amount of water present at grain boundaries, but this volume is likely below the uncertainty threshold in our measurement. The lateral and vertical variability in the water-content estimate can be explained by either variability in the air-bubble distribution, or a small amount of water present in a laterally variable system of larger voids. It is clear, however, that the volume of water present in the transparent layer is very small. This is in contrast to the lower scattering layer where the estimated water content is well above that of the transparent layer, and the difference lies outside of our uncertainty bounds. In both the cross-glacier and axial profiles, we see that the majority of the scattering layer is comprised of ice that contains 1–1.5% liquid water. Within this background water content, there are zones, with lateral dimensions of hundreds of metres, that have significantly higher water content between 1.5 and 2.5% (e.g. 1000–1400m along the axial profile; Fig. 6). The mechanism for this variability is not immediately evident, but the high-water-content zones may occur where greater void space is created through fracturing within the englacial system, and a plausible interpretation is that regions of higher water content are present within zones of extensional strain or zones of decreased compression. The water content decreases markedly at the location along the axial profile at around 1500 m where the transparent layer thins to near zero thickness.
The water-content values we measured in this study are markedly lower (<2.5%) than those we have previously reported (<5%) (Reference Bradford and HarperBradford and Harper, 2005). While seasonal variability is a possible explanation for this discrepancy, we consider the results of this multi-offset study substantially better constrained. Reference Bradford and HarperBradford and Harper’s (2005) velocities for the deeper part of the glacier were based primarily on bed coherence with an estimated uncertainty of 5–10%. The velocity estimation methods given here can sample the velocity distribution with arbitrarily high density (subject to the data resolution) and do not depend on the presence or distribution of scattering hyperbolae. These advantages coupled with PSDM and reflection tomography reduce the velocity uncertainty to <2%. We therefore consider the results given of the current study a more reliable indicator of large-scale water content within the glacier.
Acknowledgements
The material is based upon work supported by the US National Science Foundation under grant ARC-0454717. Boise State University acknowledges support of this research by Landmark Graphics Corporation via the Landmark University Grant Program. We thank S. Arcone and K. Matsuoka for constructive reviews of the manuscript.



