1. Introduction
The Banwy River section in eastern mid-Wales has been the subject of detailed biostratigraphical studies on its graptolites (Loydell & Cave Reference Loydell and Cave1996; see for locality map) and chitinozoans (Mullins & Loydell Reference Mullins and Loydell2001). It is unique in Great Britain in exposing a continuous section through all of the upper Telychian and lower Sheinwoodian graptolite biozones. Because of the generally excellent biostratigraphical control, it is an ideal section upon which to undertake carbon isotope studies.
The present paper discusses the δ13Corg record from the upper spiralis Biozone (Telychian) through to the top of the section, in the upper Sheinwoodian. Comparison is made with carbon isotope curves from the East Baltic that also have excellent graptolite biostratigraphical control.
2. Methods, including new graptolite records from the section
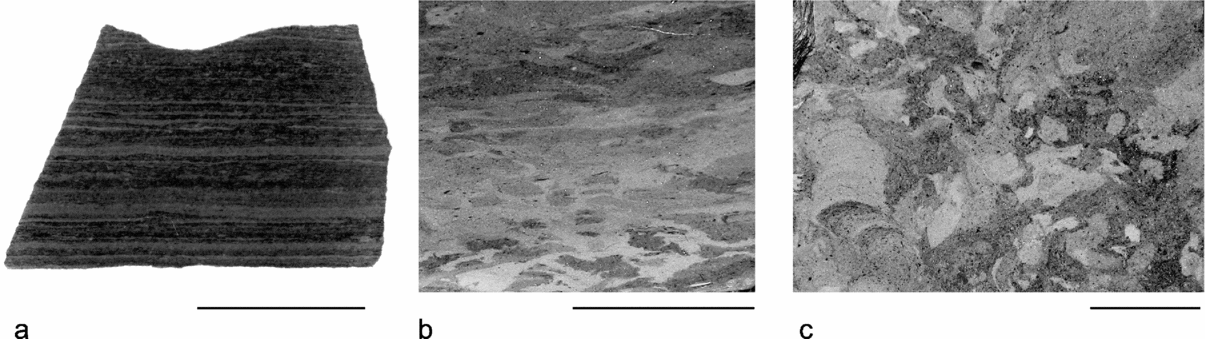
The analysed samples from the upper spiralis Biozone through to lowermost riccartonensis Biozone were collected as part of Loydell & Cave's (1996) field work. The higher samples (above C+30; C=a conspicuous nodular horizon in the river bank, used as a marker bed) were collected in June 2006 by DKL at stratigraphical intervals of 1 m. For consistency, this study focuses on analyses of laminated hemipelagites (Fig. 1a). These occur interbedded with bioturbated strata within the Tarannon Shales Formation and Banwy Burrowed Member of the Nant-ysgollon Shales Formation; above the Banwy Burrowed Member the remainder of the Nant-ysgollon Shales Formation is dominated by laminated hemipelagites; bioturbated strata occur only within the upper centrifugus and middle and upper murchisoni biozones. Three bioturbated horizons (Fig. 1b–c) have been analysed by us; these are plotted separately (open circles in Figs 2–3) and are discussed in Section 5.b. Strong thermal alteration is indicated by the dark brown colour of acritarchs extracted from the section (Mullins & Loydell Reference Mullins and Loydell2001). The higher part of the Banwy River section is characterized by strata that generally fracture at a variety of angles, but rarely parallel to bedding. This makes collection of identifiable graptolites difficult and very time-consuming. Monograptus riccartonensis Lapworth was found at C+47 m indicating that the riccartonensis Biozone must continue up to at least this level. Above this, identifiable graptolites were encountered at two levels only: at C+59 m, where the presence of Cyrtograptus rigidus indicates a level above the riccartonensis Biozone, and at the top of the section where a diverse assemblage including Monograptus flexilis Elles occurs (as recorded by Loydell & Cave Reference Loydell and Cave1996).
Polished lithological specimens of (a) laminated hemipelagite from the Nant-ysgollon Shales Formation (Bed C+4 m); (b, c) bioturbated mudstone from the Banwy Burrowed Member (Bed X+8.5 m); (a) and (b) were cut perpendicular to bedding, (c) parallel to bedding. Scale bars represent 10 mm.

In total 45 samples were analysed for organic carbon isotopes and TOC. Hand specimens were cut and rock powder was prepared from a few grams of fresh sample. A few milligrams of rock powder were taken for total organic carbon (TOC) and total organic carbon isotope analyses. Before analyses, rock powders were decarbonatized with 10% HCl at 40 °C for several hours, then washed and dried. About 20 mg of rock powder were used for TOC and about 10 mg for isotope analyses. Samples were combusted in a Fisons 1108 elemental analyser coupled on-line to a Finnigan Mat 251 mass spectrometer via a ConFlo interface. As reference material, NBS 22 (Gulf oil, with δ13C value −29.75‰) and acetanilid (Analytical Microanalysis, UK) were measured. Accuracy and precision were controlled by replicate measurements of laboratory standards and were better than ±0.1‰ (1 σ) for total carbon isotope analyses and better than ±0.02% (1 σ) for total organic carbon content.
3. The Banwy river section δ13Corg and TOC records
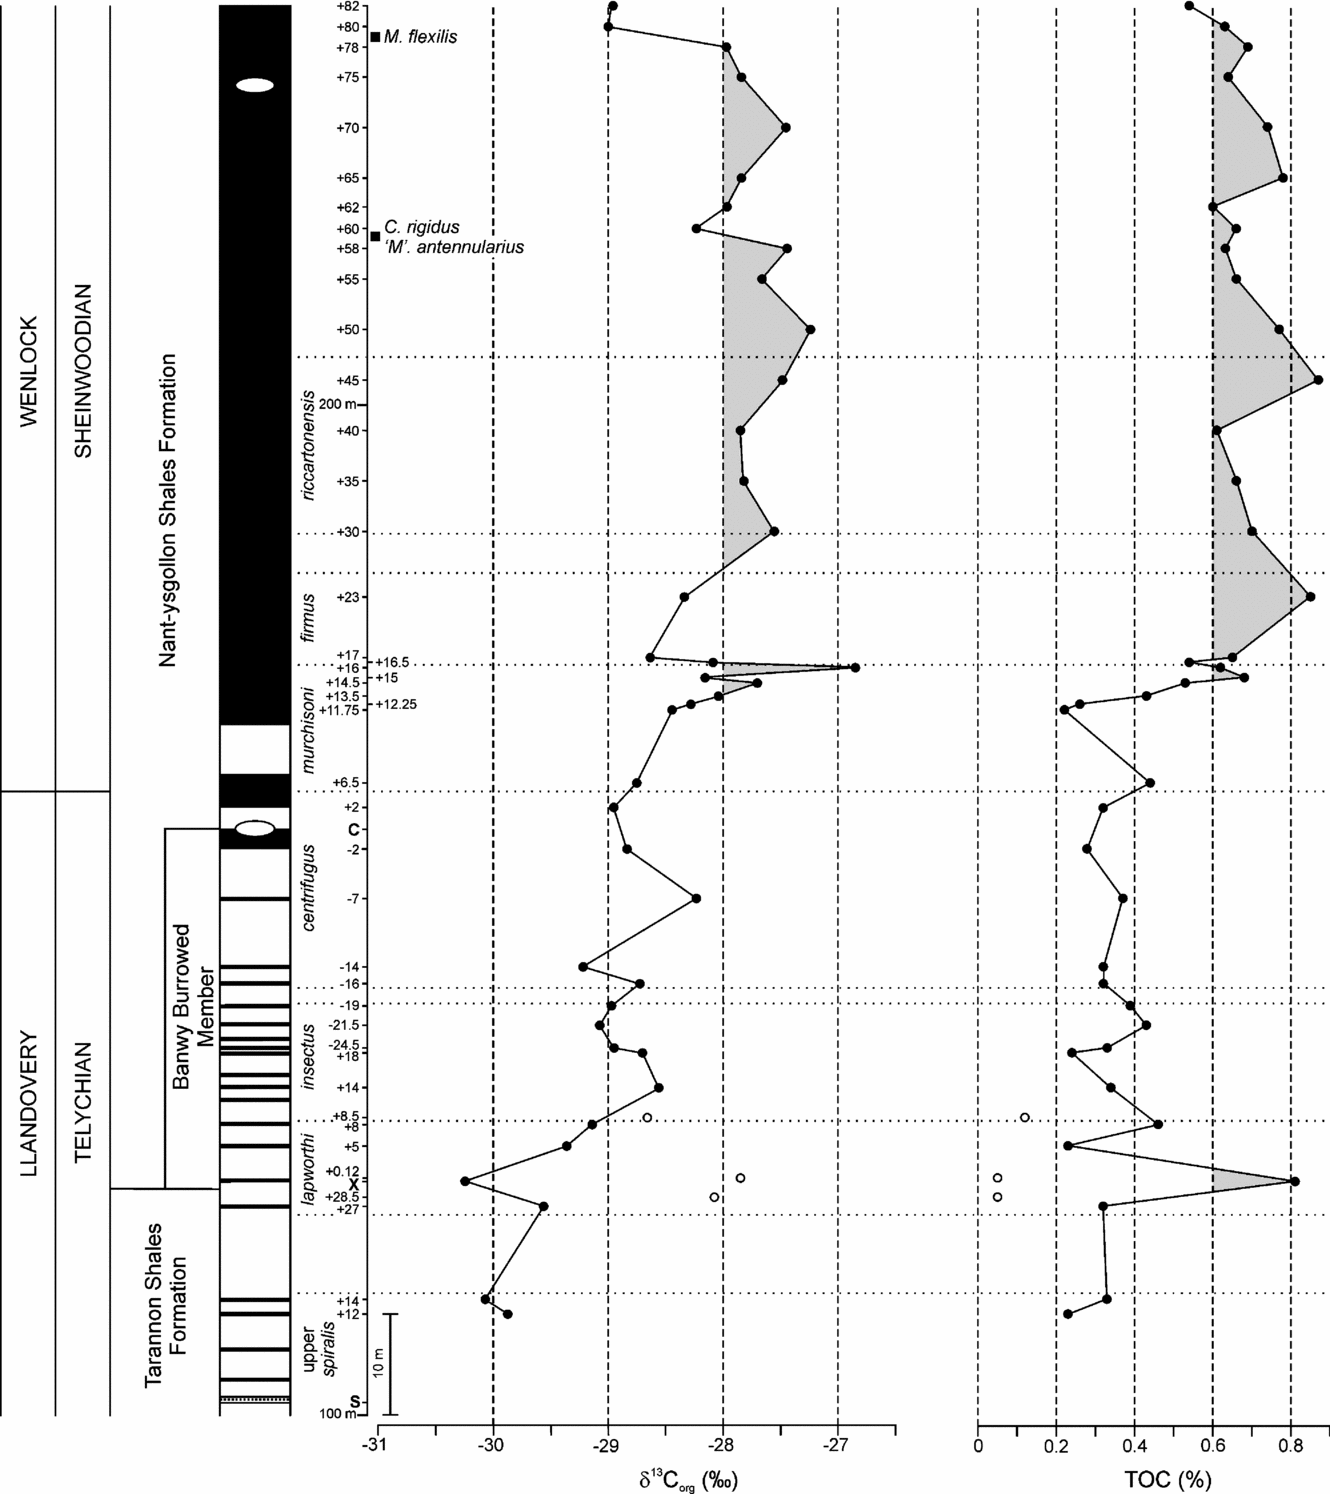
Figure 2 summarizes the results of the δ13Corg and TOC analyses of the Banwy samples. The results from laminated hemipelagites and from bioturbated strata are plotted and discussed separately.
3.a. The δ13Corg record from laminated hemipelagites
The upper spiralis and lower lapworthi biozones are characterized by very low δ13Corg values, in the range −30.24‰ to −29.58‰, with the lowest value in the lower lapworthi Biozone. This is followed by a sharp rise in values through the upper lapworthi Biozone, a high of −28.56‰ occurring in the lower insectus Biozone. Following a slight fall to −28.95‰ in the middle insectus Biozone, with one exception (in the middle centrifugus Biozone), the next ten values fall within a narrow range of values (−29.21‰ to −28.71‰), through to the lower murchisoni Biozone. A significant rise in the upper murchisoni Biozone culminates in the highest value recorded in the section (−26.86‰) in the highest sample from this biozone. A decline to values which are still higher than most of those of the middle insectus to lower murchisoni Biozone interval characterizes the firmus Biozone. The transition into the riccartonensis Biozone marks the beginning of a considerable thickness (48 m) of section with high δ13Corg values, mostly above −28.00‰ (range −27.23‰ to −28.22‰). The highest part of the section, which yields Monograptus flexilis Elles, records a sharp decline in δ13Corg values.
3.b. Total organic carbon (TOC) and its relationship to δ13Corg
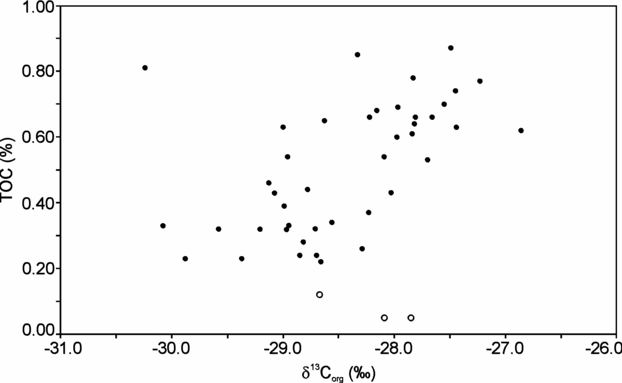
The lowest TOC values (0.05–0.12%) occur in the lapworthi Biozone. All three samples were from bioturbated levels and are shown as open circles on Figures 2 and 3. With the exception of a single high (relative to other samples) TOC value in the lapworthi Biozone, the samples fall into two groups: those with relatively low TOC values (below 0.5%, and mostly below 0.4%) in the lower part of the section (upper spiralis to upper murchisoni biozones) and those with relatively high TOC values (above 0.6%) in the upper part. Although there is not an entirely consistent relationship between δ13Corg and TOC (Fig. 3), it is clear that, with the exception of the single high lapworthi Biozone TOC value, the highest TOC values occur through the same stratigraphical interval as the highest δ13Corg values (Fig. 2).
The δ13Corg and TOC records through the upper Telychian and Sheinwoodian of the Banwy River section. S, X and C represent marker horizons (see Loydell & Cave, Reference Loydell and Cave1996). Shaded areas are above −28‰ δ13Corg and above 0.6% TOC. In the lithologies column, black represents laminated hemipelagite; white represents bioturbated mudstones (see Loydell & Cave, Reference Loydell and Cave1996, for details). Open circles are bioturbated samples. Black circles are laminated hemipelagites.

Plot of TOC (%) against δ13Corg (‰). Open circles are bioturbated samples. Black circles are laminated hemipelagites.

4. Correlation
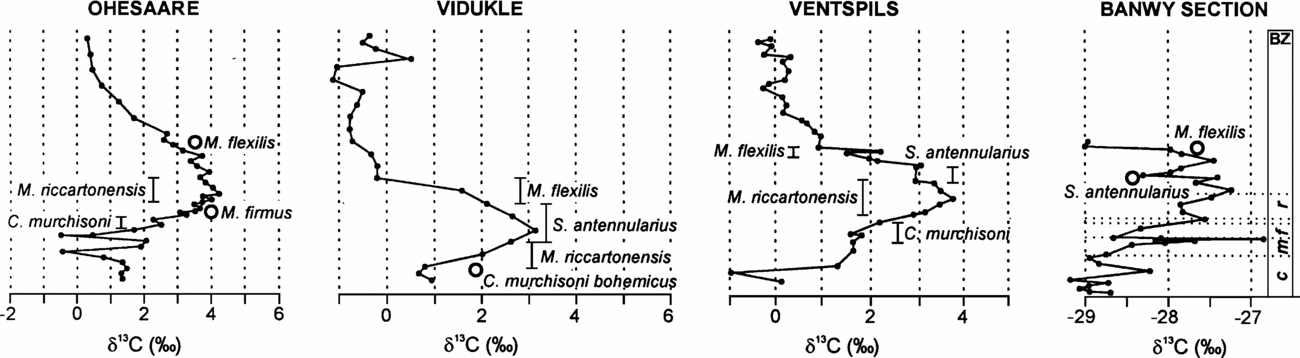
The most remarkable correlation is that between the Banwy River carbon isotope record and those from the East Baltic region, recently summarized by Kaljo & Martma (Reference Kaljo and Martma2006). As with the Banwy River section, precise graptolite biostratigraphical correlation is possible in the East Baltic cores studied, enabling the timing of positive δ13C excursions to be accurately constrained.
Uppermost Telychian strata are not present in Latvia and Estonia; there is an unconformity at this level resulting from the low eustatic sea-levels at this time (Loydell, Reference Loydell1998). In the lower Sheinwoodian, however, a thick sequence of graptolitic strata enables accurate relative dating of the onset of the early Sheinwoodian positive δ13C excursion to the upper murchisoni Biozone (Fig. 4). High δ13C values are maintained through the riccartonensis Biozone until the end of the excursion which is dated by Monograptus flexilis Elles (Fig. 4). Thus the timings of the beginning and end of the early Sheinwoodian positive δ13C excursion are identical in the Banwy section and the East Baltic.
δ13Ccarb curves from three cores in the East Baltic region (from Kaljo & Martma Reference Kaljo and Martma2006) compared with the Banwy River δ13Corg curve. c=centrifugus; m=murchisoni; f=firmus; r=riccartonensis; BZ=biozone. For the East Baltic cores, stratigraphical ranges (bars) and occurrences (circles) of key biostratigraphical taxa are given; for the Banwy River section, biozonal boundaries are indicated for the centrifugus–riccartonensis biozones and the occurrences of two key taxa from higher in the Sheinwoodian are shown by open circles.

A Sheinwoodian positive δ13C excursion has been recognized from many other regions, e.g. Australia (Andrew et al. Reference Andrew, Hamilton, Mawson, Talent and Whitford1994), Gotland (Munnecke, Samtleben & Bickert, Reference Munnecke, Samtleben and Bickert2003), the American mid-continent (Cramer & Saltzman, Reference Cramer and Saltzman2005) and Arctic Canada (Noble et al. Reference Noble, Zimmerman, Holmden and Lenz2005), but these studies lack the graptolite biostratigraphical control of the Banwy and East Baltic sections.
5 Discussion
5.a. Carbon burial and positive δ13C excursions
There has been considerable debate (summarized by Melchin & Holmden, Reference Melchin and Holmden2006a) as to the cause of positive δ13C excursions in the Hirnantian and Silurian. Data from the Hirnantian in particular (Melchin & Holmden, Reference Melchin and Holmden2006b) do not support enhanced global carbon burial as being a cause of positive δ13C excursions, leading to the proposal that increased carbonate weathering at times of low sea-level was responsible (Noble et al. Reference Noble, Zimmerman, Holmden and Lenz2005; Melchin & Holmden, Reference Melchin and Holmden2006a, Reference Melchin and Holmden2006b).
The Banwy data, however, provide support for the carbon burial hypothesis. The highest δ13C and TOC values all occur within the same interval, from the upper murchisoni Biozone through to nearly the top of the section (Fig. 1). It is interesting to note that Kump et al. (Reference Kump, Arthur, Patzkowsky, Gibbs, Pinkus and Sheehan1999, cited by Noble et al. Reference Noble, Zimmerman, Holmden and Lenz2005, p. 1427) determined that a 50% to 75% increase in organic carbon burial would have been needed to generate the Hirnantian positive δ13C excursion. In the Banwy River section average TOC approximately doubles between the lower and upper parts of the section. Kaljo, Kiipli & Martma (Reference Kaljo, Kiipli and Martma1997, p. 221) also recorded an ‘increased content’ of organic carbon in the riccartonensis Zone of the Ohesaare core, Estonia (4–6% TOC) and Priekule core, Latvia (3–7% TOC), demonstrating that increased carbon burial was a widespread phenomenon at this time. It will be interesting to see whether future studies demonstrate similar increases in TOC in strata recording the early Sheinwoodian positive δ13C excursion.
The global sea-level curve for the early Silurian (Loydell, Reference Loydell1998) shows falling sea-level through the late murchisoni–riccartonensis zones. It is thus possible that enhanced carbon burial resulted from a higher sedimentation rate associated with regression. Carbonate weathering would also have increased at this time and thus a combination of increased carbon burial and carbonate weathering may be responsible for the positive δ13C excursion.
5.b. Bioturbation, TOC and δ13C
The samples collected by Loydell & Cave (Reference Loydell and Cave1996) were almost exclusively laminated hemipelagites (Fig. 1a), selected because these would yield the graptolites required for their biostratigraphical work. Between the sampled horizons, in both the Tarannon Shales Formation and Banwy Burrowed Member of the Nant-ysgollon Shales Formation, the strata were bioturbated and paler in colour (Fig. 1b, c). Three of these bioturbated samples were analysed for their δ13C and TOC (indicated by open circles on Figs 2 and 3). In all three, TOC was much lower (0.05–0.12%) than in the laminated hemipelagites. These analyses have been plotted separately to reflect the possibility that the isotopic composition does not represent a primary signal, but one modified by biostratinomic or diagenetic processes. As there are no other published δ13C data from the uppermost Telychian it is difficult to known whether the dramatic fluctuations in δ13Corg (e.g. from −30.24‰ to −27.85‰ over a stratigraphical thickness of 120 mm) are typical of this interval. It would be very interesting indeed to conduct a carbon isotope study through the upper Telychian and lower Sheinwoodian in Bohemia, where lithological changes are less pronounced and sections are consistently graptolitic, thus enabling more closely spaced sampling through the upper spiralis to insectus Biozone interval. In the Banwy River section there is a significant thickness of non-graptolitic strata between the upper spiralis and lapworthi biozones, reducing the stratigraphical precision possible in this part of the upper Telychian.
The Banwy hemipelagite data suggest a positive excursion commencing in the late lapworthi Biozone with peak δ13Corg values in the lower insectus Biozone. This would coincide with the low eustatic sea-levels recognized by Loydell (Reference Loydell1998). Including all of the δ13Corg data (i.e. hemipelagites plus bioturbated strata) would generate a complex record, with high δ13Corg values (−28.09‰ and −27.85‰) just below and just above the base of the Banwy Burrowed Member, but separated by the lowest δ13Corg value (−30.24‰) in the section. The coincidence of these major changes in δ13Corg values with a lithological change would suggest a common cause. Based on the graptolites present in bed S+27 m and bed X, both clearly belong in the lower half of the lapworthi Biozone. From what level they are from within this interval is impossible to judge in the absence of graptolites from between S+14 and S+27 m.
conclusion. Conclusions
The δ13Corg record from the Banwy River section, Wales shows the widely recorded early Sheinwoodian positive δ13C excursion. This can be correlated precisely, using graptolites, with the East Baltic δ13C record. Increased TOC coincident with the positive δ13C excursion suggests that increased carbon burial may have been responsible for generating the isotope excursion. More studies on the δ13C record through the uppermost Telychian are required, particularly in Bohemia. In the Banwy River data it is unclear whether bioturbated strata with low TOC are recording a primary geochemical signal or one modified by biostratinomic or diagenetic processes.
Acknowledgements
Richard Cave, Tony Butcher and Bob Loveridge helped with collecting the samples. Geoff Long prepared the polished lithological sections. Tony Butcher drafted the figures. Part of the fieldwork was enabled by an N.E.R.C. Small Grant (Ref. GR9/1129). Mike Melchin and Jim Marshall provided constructive criticisms of the submitted manuscript.