INTRODUCTION
Organic olive groves account for c. 0·19 of the total organic surface area in Spain. In Andalusia, this crop represents 0·38 of the surface area devoted to agriculture and its presence on the region's farmland has increased over time, from 9083 ha in 1996 to nearly 47 000 ha registered in 2010 (CAP 2011). This type of olive-growing system constitutes an economic opportunity for certain rural areas that, generally speaking, are not very productive and supplies a different quality of product that is subject to ever-increasing demand in Europe (El-Hage Scialabba & Hattam Reference El-Hage Scialabba and Hattam2002). Support from the European Union has contributed towards the growth of this system by including this farming activity in the group of agricultural production methods that favour the fulfilment of agro-environmental goals (Regulation 2078/1992, European Commission 1992).
Organic olive groves in Andalusia are generally located in mountain regions with steep slopes and acidic and shallow soil with little organic matter. Two of the most significant problems in organic olive-growing systems are the high rates of erosion and the fact that the olive growers cannot use synthetic fertilizers. As a result, maintaining the natural fertility of the soil has become a key factor (Rembialkowska Reference Rembialkowska2004; Rosati & Aumaitre Reference Rosati and Aumaitre2004).
In this sense, implementing plant cover as part of a sustainable system may help a great deal, as this raises the levels of organic matter and, therefore, the mineral nitrogen (N) available for olive growth (Wells et al. Reference Wells, Chan and Cornish2000), together with other nutrients. Furthermore, according to Korsaeth & Eltun (Reference Korsaeth and Eltun2000), in order for a farming system to be sustainable, it must not only have a suitable level of N in the soil, but also minimize the losses through run-offs and leaching, underlining the fact that crop rotations handled organically struggle to maintain their output if the soil is continually tilled.
One of the most inert plant covers is pruning residues, which have several benefits for the soil they are applied to. Pruning residues decompose and humidify slowly, due to their high proportion of cellulose and lignin, a medium–low content of moisture and a high carbon (C)/N ratio, which ensures soil protection over time (Ordóñez et al. Reference Ordóñez, González, Pastor and de Andalucía2007). The application of pruning residues to the areas between the lines of perennial crops has been backed by the Government and recommended by specialists, mainly due to soil protection and the extra organic matter this practice produces.
In order to develop this type of system, there must be awareness of the quality and evolution of the residues generated by an agricultural system to be able to establish strategies for handling them. The decomposition of plant residues is a vital process in ecosystems, as it influences the supply of organic matter in the soil and the release of nutrients for plant uptake (Prescott Reference Prescott2005).
Many studies of decomposition analyse the relationship between the chemical characteristics of plant residues and the loss of weight from the matter decomposing, while fewer studies assess the effect of interactions between the residue quality and speed of decomposition on the underlying soil (Sariyildiz & Anderson Reference Sariyildiz and Anderson2003; Semmartin Reference Semmartin2006).
Moreover, the chemical composition of the residues, the decomposition rate and the subsequent release of nutrients are regulated by the weather, the biodiversity of microbial communities, the physical and chemical degradation, the quantity of plant residues applied and the application frequency (Carrera et al. Reference Carrera, Vargas, Campanella, Bertiller, Sain and Mazzarino2005; Austin & Vivanco Reference Austin and Vivanco2006; Gallo et al. Reference Gallo, Sinsabaugh and Cabaniss2006).
In the case of most crops, growers reject the idea of quantifying the nutrients that are produced by residual biomass decomposition and as a result overuse inputs, which has repercussions for the environmental and economic sustainability of the system. However, some residues provide permanent biomass that gradually releases nutrients as they decompose, with a subsequent effect on soil fertility. Ordóñez et al. (Reference Ordóñez, Ramos, González, Pastor, Giráldez, López-Rodríguez and Quemada2001) assessed the impact of constantly maintaining olive tree pruning residues as plant cover for a period of 6 months, observing significant improvements in the characteristics of the soil.
Few papers have been found to specify the effects of applying olive tree pruning residues on the properties of soil and fewer still have provided quantitative data on the amount of such organic residues, generated by the olive grove itself that is required to reap the benefits of improving soil fertility.
The goal of the current research was to assess the decomposition dynamics of various doses and sizes of plant residues by measuring the developments that take place in their composition and their capacity to release N, phosphorus (P) and potassium (K) for the soil of an organic olive grove.
MATERIALS AND METHODS
Field trials and experiment design
The current study was performed at the IFAPA centre ‘Alameda del Obispo’ in Córdoba, Spain (37°51′N and 4°47′W; 117 m a.s.l.). The organic olive orchard has ‘picual’ olive trees 40 years old and a plantation frame of 8×8 m.
The climate in the area where the experiment was performed is typically Mediterranean, characterized by xeric humidity according to the standards established in Soil Taxonomy (Soil Survey Staff 1998). This climate entails a cold and wet period in the autumn and winter months, which account for 0·80 of rainfall and a very warm and dry period in spring and summer. The temperature regime is thermic, i.e. annual average temperature is 15–22 °C. The soil is a Calcixerept Inceptisol, according to Soil Survey Staff (1999). Table 1 shows soil physicochemical characteristics of the experimental area. The experiment was conducted over a period of two growing seasons (2009/10 and 2010/11), which corresponds to the time between two prunings.
Physicochemical characteristics of olive grove soil used in the trial

CO3−2, carbonates; CEC, cation exchange capacity; OM, organic matter.
In order to perform the trial, different olive trees on the farm were pruned and the residues obtained per tree were weighed, differentiating the fine wood (light pruning from the cleaning of the orchard, with a diameter ⩽8 cm), from the thick wood (renewal pruning>8 cm in diameter), and applied to the soil.
In order to include the various chopping options currently available to farmers, two types of chopping were distinguished depending on the size of the residues, namely field treatments with self-fed and hand-fed chopping machines. Therefore, two treatments were adopted, namely treatment I (fine residues) and treatment II (fine and thick residues).
During pruning, the residues from two rows are usually accumulated on every alternate inter-row, i.e. only half of the inter-rows in a plot are covered, reducing the work of chopping and scattering machinery. For that reason, another two treatments were adopted: treatment III (fine residues) and IV (fine and thick residues) having twice the amount of residues of treatments I and II.
The doses per unit of surface area were adopted in accordance with the average pruning output of ten olive trees and the distance between olive trees considering a residue application strip (cover strip) width of 2 m: 42·4 (s.e.=4·43) kg fine pruning per tree/(8 m between olive tree×2 m of cover strip width)=2·65 kg fine pruning/m2; 17·9 (s.e.=2·42) kg thick pruning per tree/(8 m between olive×2 m of cover strip width)=1·12 kg thick pruning/m2.
Table 2 shows the different doses of residues used and nutrients added in the study and a control treatment of spontaneous weeds where no residues were applied.
Doses of olive pruning residues applied to the soil in kg/m2 (wet weight) and nutrient content applied in the prunings in kg/ha (dry matter)

Fine: ⩽8 cm in diameter; thick: >8 cm in diameter.
Control subplots were characterized by species and biomass of spontaneous weeds. The control treatment had 1848 kg/ha of spontaneous weeds at the beginning of the experiment. The main annual species of weeds were Bromus madritensis, Bromus hodeaceus, Avena barbata and Hordeum leporinum. In spring and summer, Medicago sativa, Convolvulus arvensis, Cyperus rotundus and Crepis vesicaria had also grown, adding c. 400 kg/ha of weed biomass.
The experimental design was a randomized complete block with six replications. The experimental unit was a subplot of 28 m2; it consisted of the distance between three trees, leaving 2 m between subplots (14 m), per cover width of 2 m.
Sampling
Because of the high C/N ratio of pruning residues, which limited decomposition, sampling was performed on a quarterly basis. The residue mass was estimated from the prunings collected in a 0·25 m2 metal frame from the soil, which served to delimit the sampling area and was placed at all the points selected. The residue collected was sent to the laboratory, where it was washed with distilled water to prevent contamination in the subsequent analysis and placed in an oven at 65 °C until it reached a constant weight and it was possible to estimate the amount of dry matter.
At the end of the second year, soil sampling at depths of 5, 10, 20 and 40 cm was performed to assess the effect of applying the pruning residues. The soil samples were taken with an Edelman auger. A cylinder of known volume was used to measure bulk density. Soil samples were air-dried and sieved through a 2 mm mesh sieve for subsequent analysis.
Analysis of samples
Residue and soil samples were analysed for total N content using a LECO (TRUSPEC, CNS; St. Joseph, MI, USA) elemental analyser. Total P content in residues was determined by colorimetry and total K by atomic absorption spectrophotometry, both after converting the sample into ash and dissolving it in 100 ml hydrochloric acid (HCl) 0·1 N. Available P in soil was measured by colorimetry and exchangeable K by atomic absorption spectrophotometry after extracting with NaHCO3 0·5 M and CH3COONH4, respectively (Sparks et al. Reference Sparks, Page, Helmke, Loeppert, Soltanpour, Tabatabai, Johnston and Sumner1996).
Nitrogen, phosphorous and potassium release
The release rate of N, P and K from the different pruning residue treatments was estimated. It was calculated as the difference between the content of each element in the residues when they were applied to the soil, and a comparison sample of a specific date, according to Eqn (1):
 $${\rm Released}\,{\rm nutrient}_{\rm t} = Y_0 - Y_{\rm t} $$
where Y t is the amount of nutrient remaining in the residue at time t (kg/ha) and Y 0 the amount of this nutrient remaining in residues following application to the soil (kg/ha).
In order to describe the reduction of the remaining amount of considered nutrient (N, P, K) in residue, two models were fitted by means of non-linear regression. The first was the simple negative exponential model (Olson Reference Olson1963), which is described by Eqn (2):
 $$Y_{\rm t} = Y_0 \,{\rm exp(} - k\,t{\rm )} + \varepsilon $$
where Y t is the amount of nutrient remaining at time t, Y 0 is the estimated nutrient pool at t=0, k (1/day) is the nutrient release rate constant, t is the time (in days after application) and ε is the random error.
The second was a double exponential decay model, Eqn (3) (Bunnell & Tait Reference Bunnell, Tait, Holding, Heal, MacLean and Flanagan1974), which takes into account the fractions of easy and difficult decomposition. The corresponding equation is as follows:
 $$Y_{\rm t} = Y_0 L\,{\rm exp(} - k_{\rm 1} \,t{\rm )} + Y_{\rm 0} (1 - L)\,{\rm exp(} - k_{\rm 2} \,t{\rm )}$$
where Y t (kg/ha) is the remaining amount of the considered element (N, P, K) at time t; Y 0 (kg/ha) the quantity of that element remaining at the beginning (t=0 days); L is the Labile fraction and 1−L the difficult decomposition fraction; k 1 and k 2 (1/days) are the decay constants of the labile and recalcitrant fraction, respectively and t (days) is the time considered. In order to select the models, the determination coefficient (R 2) was used as an indicator of goodness of fit.
Soil nitrogen, phosphorous and potassium
The amount of N, P and K in soil was calculated according to Eqn (4):
 $${{X\left( {\displaystyle{{{\rm kg}} \over {{\rm ha}}}} \right)= \!\% X\left( {\displaystyle{{{\rm kg}_X} \over {{\rm 100}\,{\rm kg}_{{\rm soil}}}}} \right){\rm \times} \rho _{\rm b} \left( {\displaystyle{{{\rm kg}_{{\rm soil}}} \over {{\rm m}^{\rm 3}}}} \right){\rm \times} D({\rm m}){\rm \times 10}^{\rm 4} \left( {\displaystyle{{{\rm m}^{\rm 2}} \over {{\rm ha}}}} \right)}}$$
where X is the nutrient, ρ b is the bulk density of soil and D is the depth of soil.
For each treatment (T) the content of N, P and K accumulated at a given depth (D) was calculated using Eqn (5):
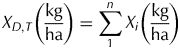 $${X_{D,T} \left( {\displaystyle{{{\rm kg}} \over {{\rm ha}}}} \right) = \sum\limits_{\rm 1}^n {X_i} \left( {\displaystyle{{{\rm kg}} \over {{\rm ha}}}} \right)}$$
where i is the number of depth intervals sampled, three intervals at depth of 0–20 cm (0–5, 5–10 and 10–20 cm) and one interval at depth of 20–40 cm.
The increase in N, P and K content in soil for the different treatments with respect to the control was obtained according to Eqn (6):
 $${\Delta X_{D,T} \left( {\displaystyle{{{\rm kg}} \over {{\rm ha}}}} \right) = X_{D,T} \left( {\displaystyle{{{\rm kg}} \over {{\rm ha}}}} \right) - X_{D,{\kern 1pt} {\rm Control}} \left( {\displaystyle{{{\rm kg}} \over {{\rm ha}}}} \right)}$$
and the percentage increase over the control was calculated as follows:
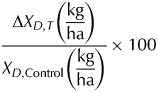 $$\displaystyle{{\Delta X_{D,T} \left( {\displaystyle{{{\rm kg}} \over {{\rm ha}}}} \right)} \over {X_{D{\rm, Control}} \left( {\displaystyle{{{\rm kg}} \over {{\rm ha}}}} \right)}} \times 100$$
Data analysis
Weather in the local area was monitored during the 2-year study, assessing rainfall and maximum and minimum daily temperature data. The data were taken from a weather station located 500 m from the experimental plot, which belongs to the network of agricultural weather stations (RIA) of the Andalusia Regional Ministry of Agriculture, Fisheries and the Environment (Spain).
The residual amounts of nutrients analysed at each moment in time were calculated using the product of the dry matter of the residues by the concentration of the element on the day of sampling. The amounts of N, P and K remaining (kg/ha) at each sampling were regressed in time using the non-linear regression model procedure of SPSS 15.0. The double exponential model was fitted to the data using the non-linear regression model provided by the Statistix 9.0 program.
In order to determine the association between the behaviour of the dry matter of the residues and the nutrients analysed, the Pearson linear correlation coefficients between the variable biomass (kg/ha), N, P and K content (kg/ha) and C/N, N/P, N/K and P/K were calculated. This relationship was measured for all samplings. Statistix 9.0 software program was used for statistical analysis.
The ANOVA statistical test was employed to nutrients in residues and soil and with a comparison of means (Tukey's test P⩽0·05).
RESULTS
Dry matter evolution
The Mediterranean climate in the south of Spain, with long periods of drought and irregular rainfall distribution, affected both the quantity and evolution of the residues left on the soil surface.
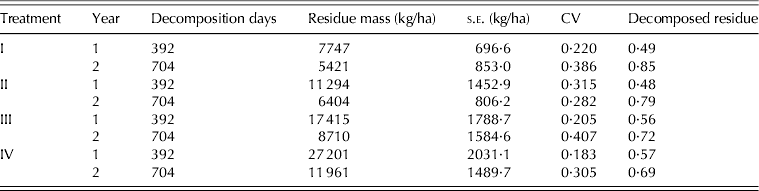
Table 3 shows how the pruning residue mass in each of the pruning residue treatments evolved over time every year. A detailed study of decomposition of pruning residues is shown in Repullo et al. (Reference Repullo, Carbonell, Hidalgo, Rodríguez-Lizana and Ordóñez2012).
Annual evolution of average of remaining pruning residue mass (dry matter), standard error (s.e.), coefficient of variation (CV), decomposition days and proportion of decomposed residue from the beginning of experiment for the different treatments used
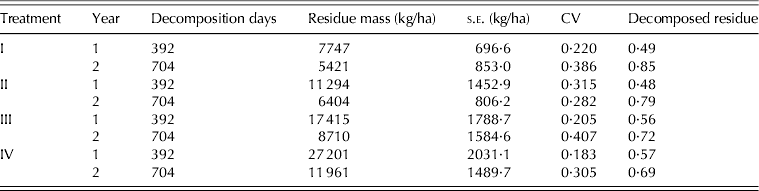
As can be appreciated, the s.e. of the data decreases as the days of decomposition elapse, being greater in year 2 than in year 1, except for treatment I. However, coefficient of variation increased such as the decomposition proceeded.
Nitrogen, phosphorous and potassium release
Apart from protection, the residues also provided the soil with nutrients. However, this property depends on the quantity and composition of the residue mass and how easily it decomposes.
As regards the three nutrients considered, N was present in the greatest proportion in pruning residues, recording 760 g/kg, compared to 170 and 470 g/kg in the case of P and K, respectively.
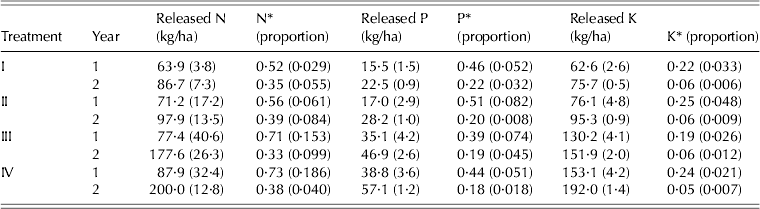
Table 4 summarizes the amounts of N, P and K released through residue decomposition in each of the treatments considered in the study. As regards N, the release rate for treatment IV was 2·3, 2·0 and 1·1 times greater than in the case of treatments I, II and III, respectively at the end of second year. Treatments I and III, which only involved fine pruning residues, released a greater proportion of initial N: 0·65 and 0·67, respectively.
Released nitrogen (N), phosphorus (P) and potassium (K) in kg/ha and proportion remaining, from the beginning to the end of first and second year. s.e. are indicated in parenthesis

* Proportion of nutrient remaining in pruning residue.
The amount of P released during the decomposition of residues displayed a similar trend to that described previously. The proportion of P released in regard to the initial concentration was related to the amount of residues applied to the soil, registering losses of 0·78 in treatment I and 0·82 in treatment IV.
As in the previous cases, the more pruning residues applied, the greater the amount of K released, the largest quantity being recorded by treatment IV, which was 2·5, 2 and 1·3 times greater than in the case of treatments I, II and III, respectively. The proportion of K remaining in the residue was the lowest of all the elements and similar for all the treatments considered (Table 4).
As regards the quantity of total nutrients released through the decomposition of residues in all treatments, the sequence was as follows: N>K>P (Table 4). However, the proportion of nutrient released by the residue mass in regard to the initial content followed the sequence K>P>N.
Nitrogen, phosphorous and potassium evolution and models
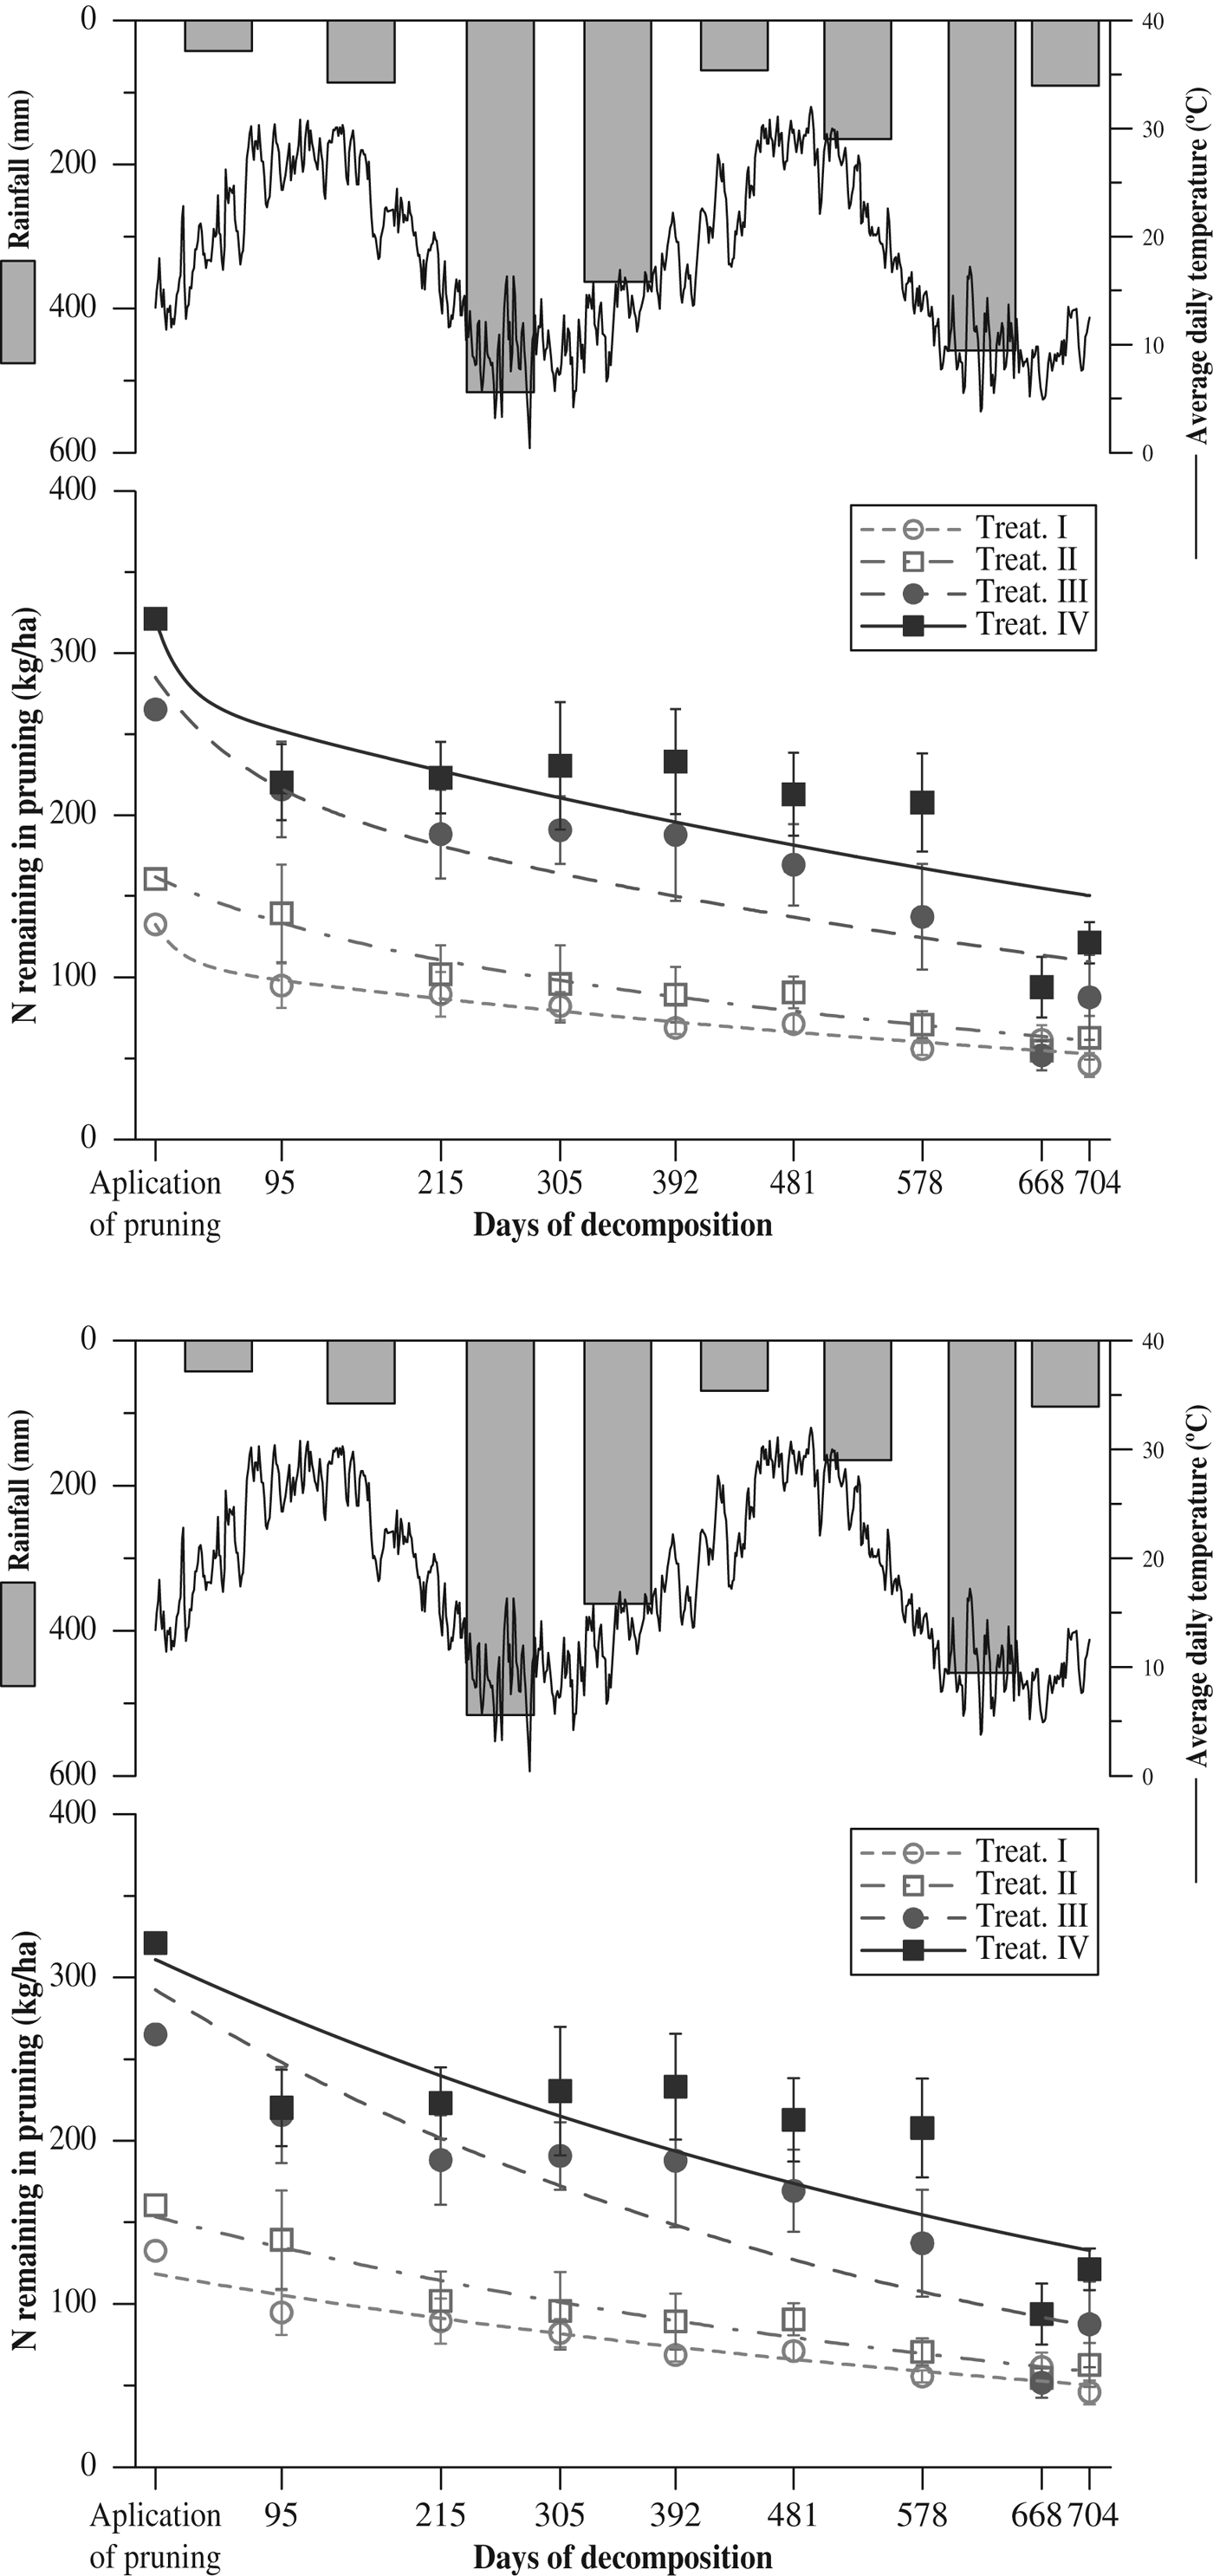
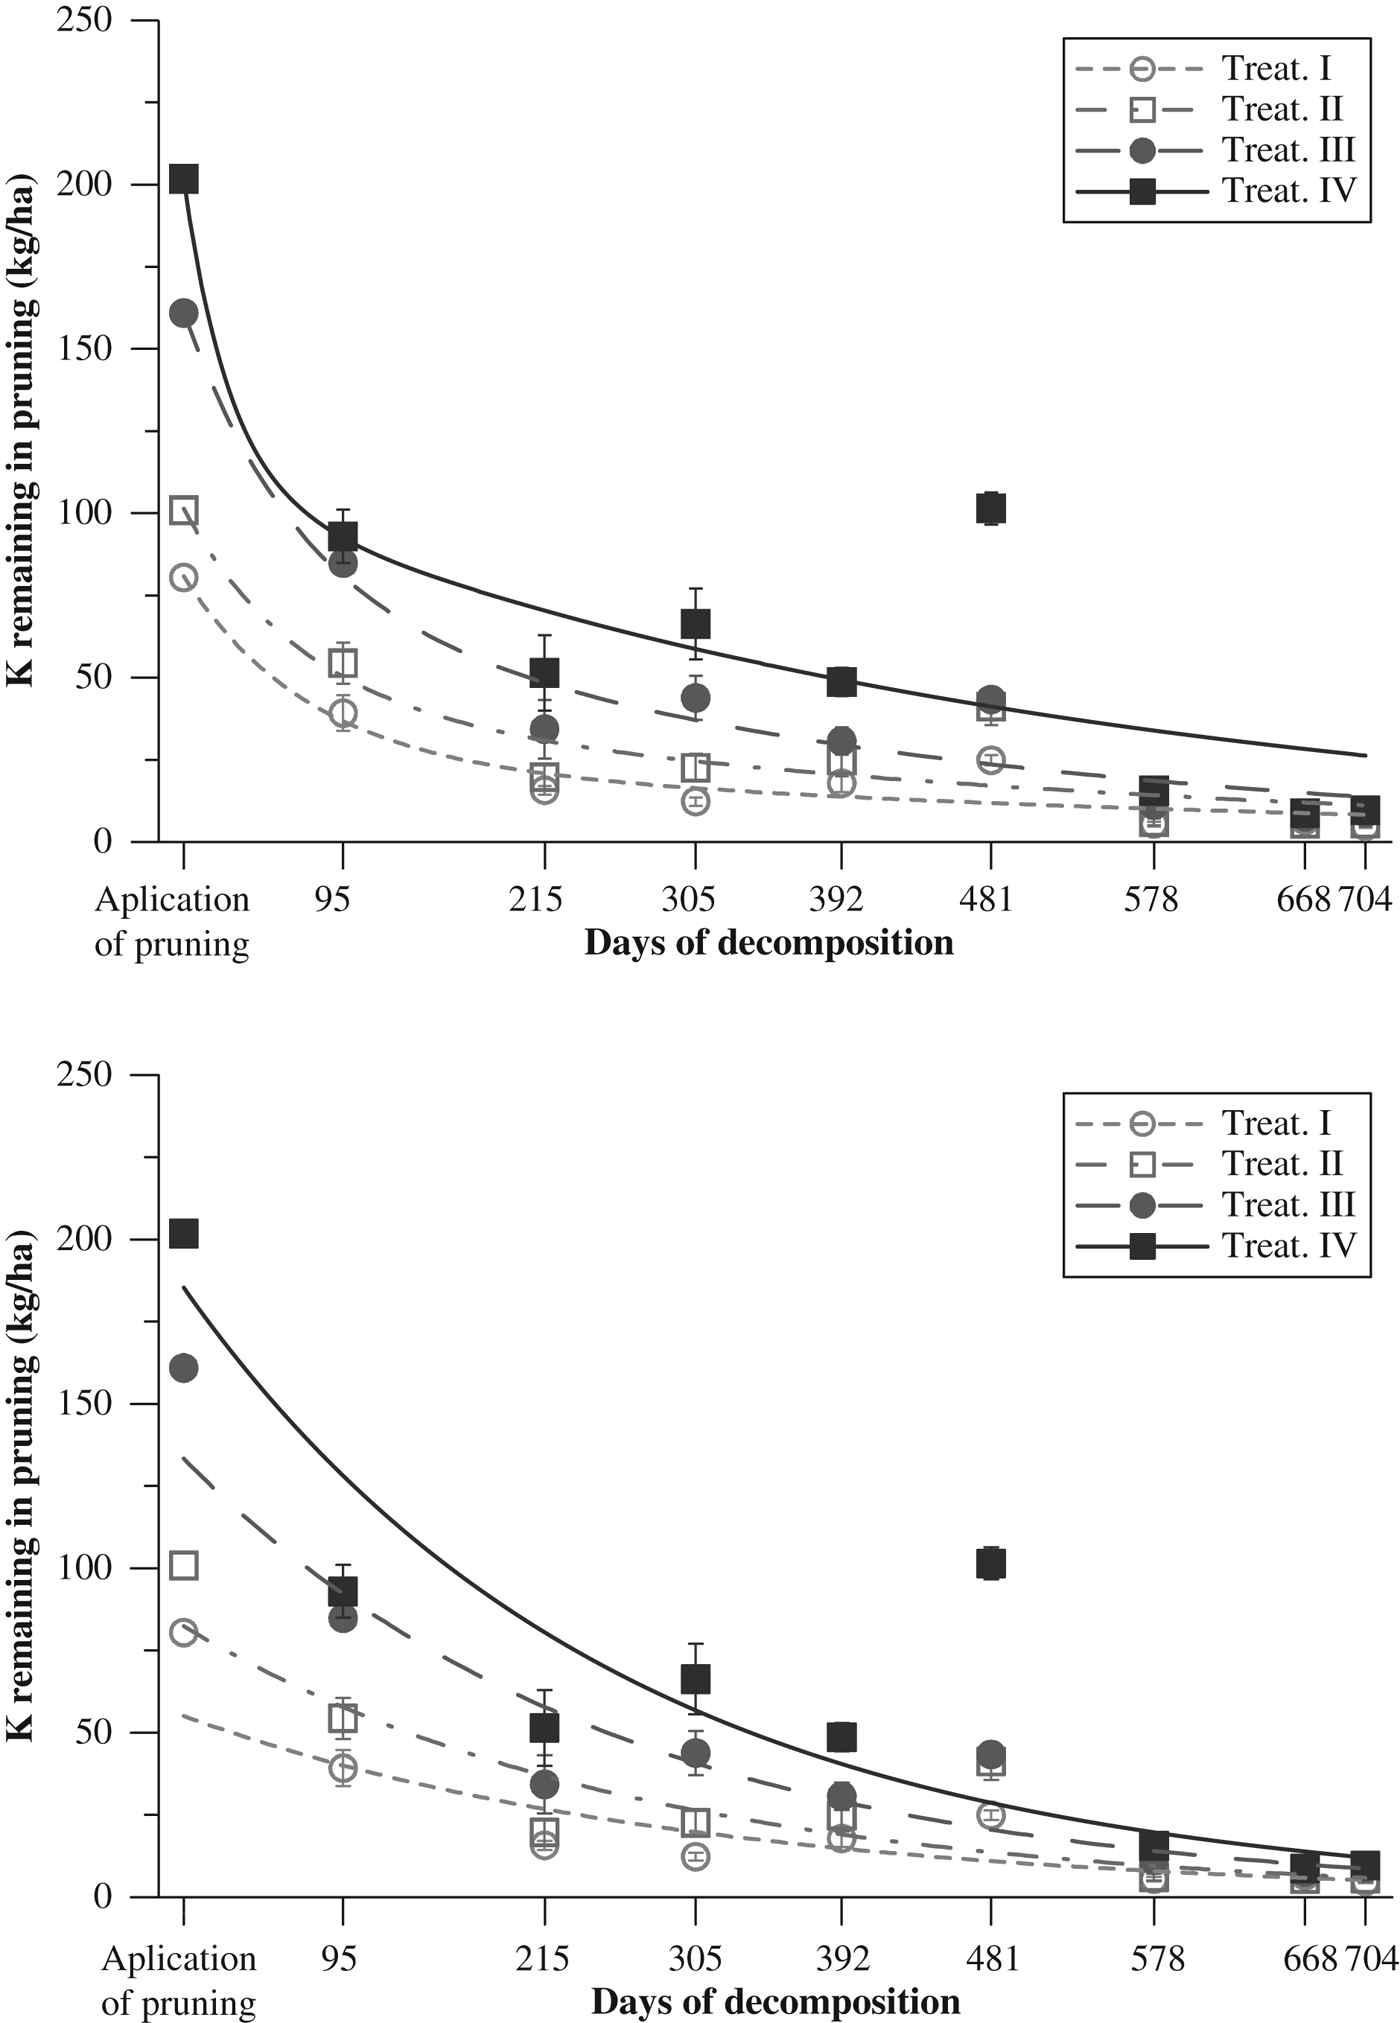
Regardless of the element considered, the trend over time of the concentration of the nutrient remaining in the residue mass was similar for the various pruning residue treatments (Figs 1 to 3). More nutrients were released during the sampling dates: this process slowed down in the second year of study.
As regards N, Fig. 1 reveals two groups that registered the same pattern. The first group includes treatments III and IV, which had a larger quantity of pruning residues and which also recorded the highest values of N in the pruning residues on all sampling dates. The proportion of nutrients released during the first year of the experiment represented 0·43 and 0·22 of the total, respectively. The second group encompasses treatments I and II. In this case, N was released more quickly at the beginning of the experiment due to the mineralization of the residue mass. In fact, a proportion of 0·74 and 0·73 of the total were released in the first year. Treatments III and IV recorded the greatest data dispersion obtained by sampling date and the highest values for the s.e.
Temporal evolution of rainfall, air temperature and kg of N in residue mass per ha of cover in the different pruning residue treatments used in the study. A double exponential model (above) and a single exponential model (below) have been represented. Vertical lines represent the s.e.
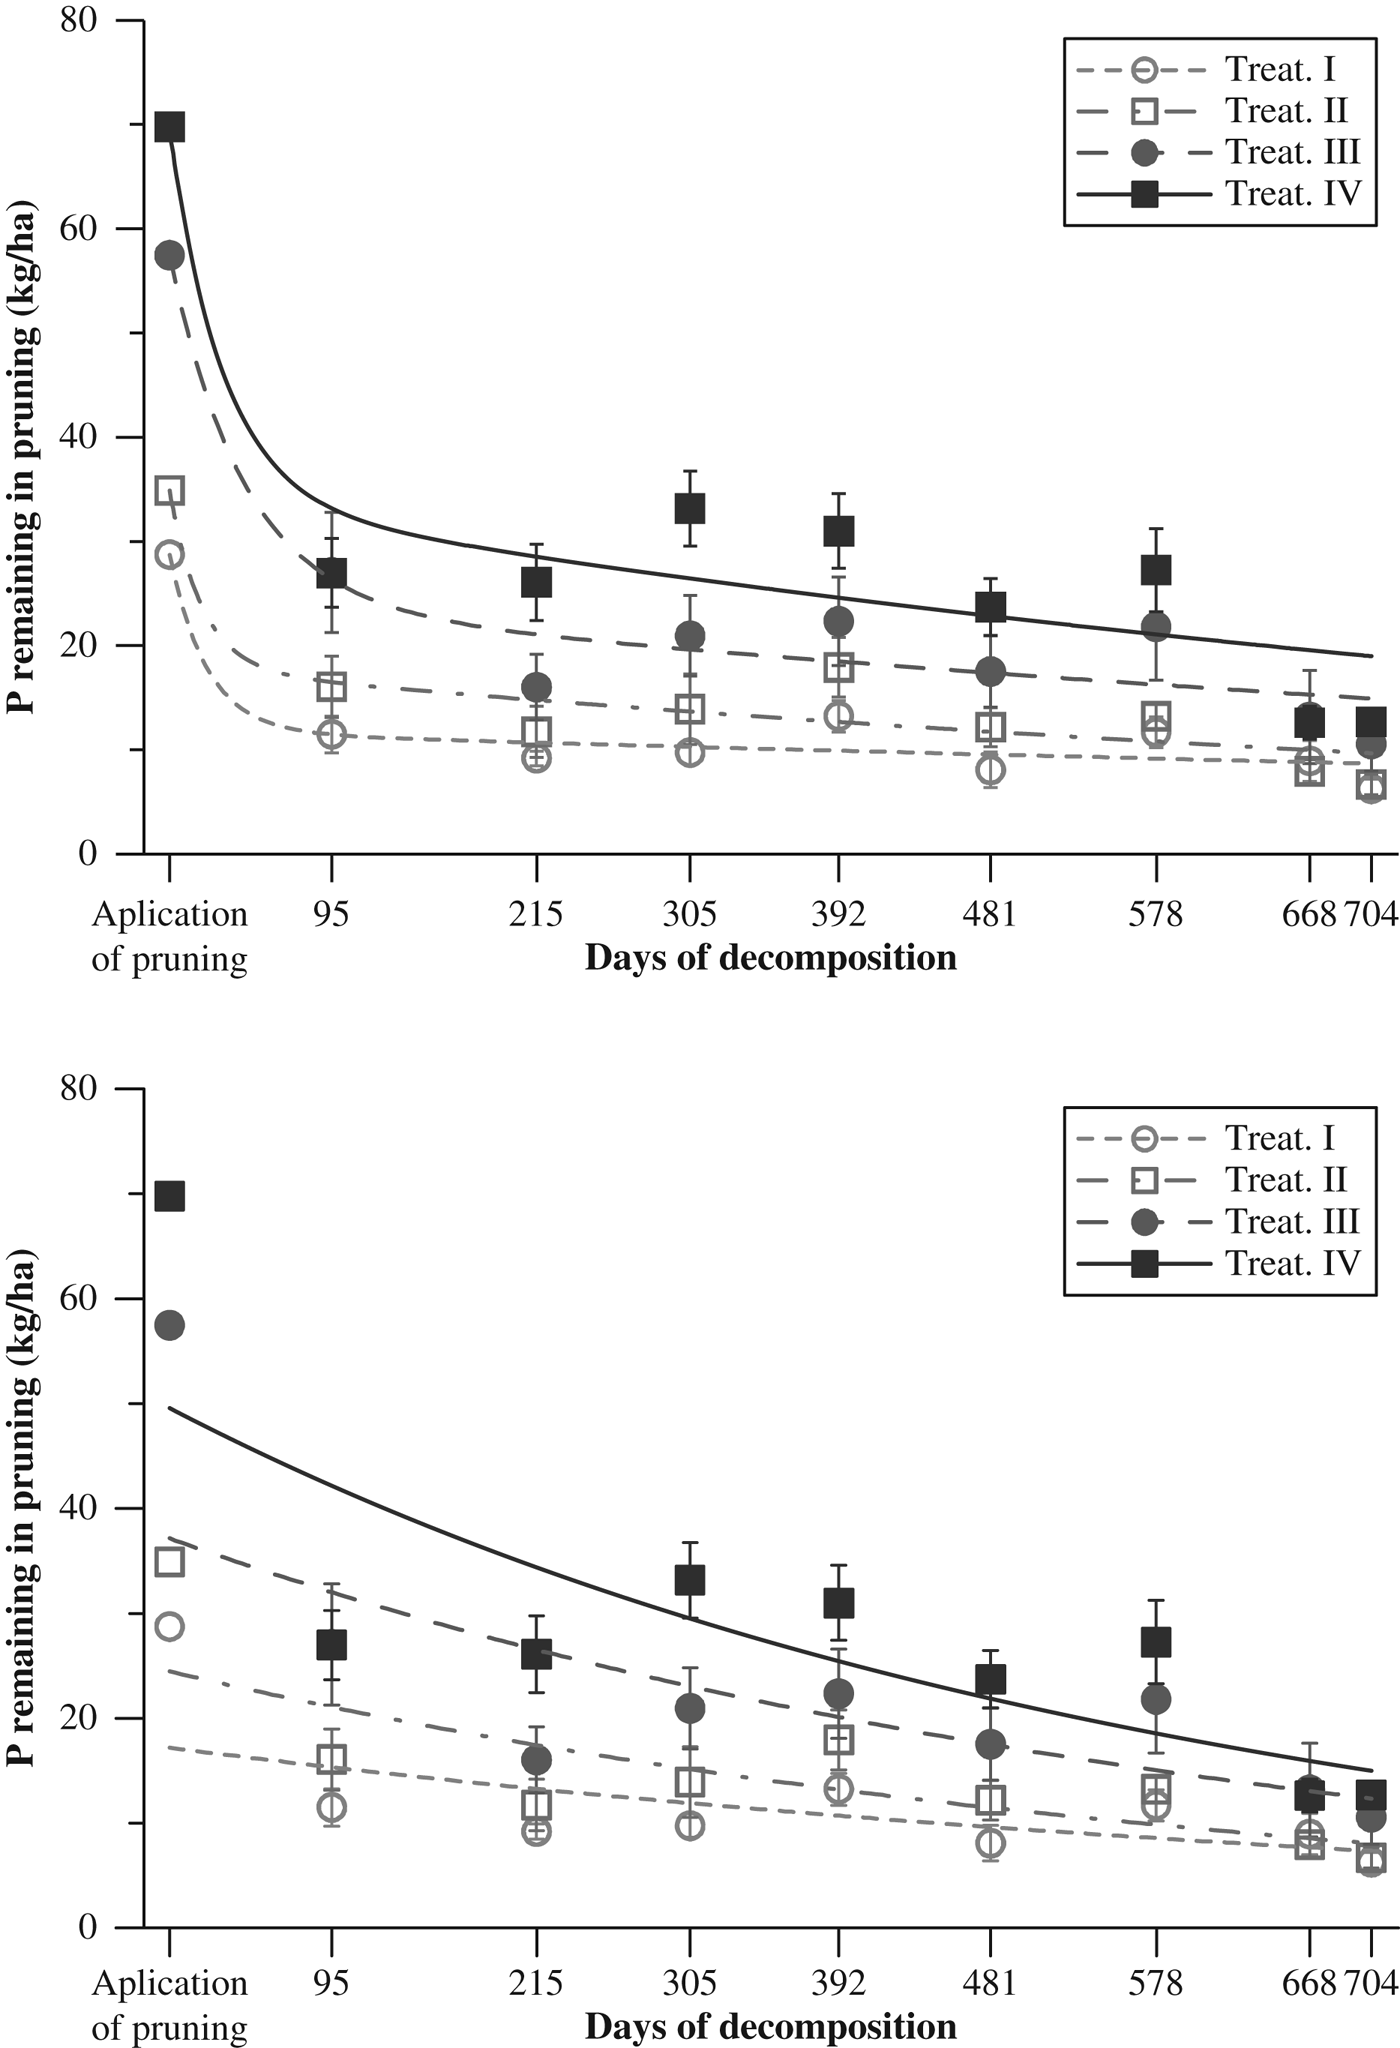
In the case of P, a significant decrease in the concentration of this element in the residue remains was observed at the beginning of the period, followed by a gradual decline from the second sampling date onwards (Fig. 2). A total of 0·69, 0·60, 0·75 and 0·65 of total P lost in treatments I, II, III and IV, respectively, was released in the first year. After 704 days of decomposition, these differences lessened and the average concentration of P in the residue mass on the last sampling date ranges from 6·3 kg/ha in the case of treatment I to 12·7 kg/ha in treatment IV.
Temporal evolution of kg of P in residue mass per ha of cover in the different pruning residue treatments used in the study. A double exponential model (above) and a single exponential model (below) have been represented. Vertical lines represent the s.e.
The K release rate was influenced by rainfall during the decomposition period and the decrease in the concentration of this element in the residue mass over time was similar for all treatments (Fig. 3). As in the previous case, the presence of fine residues in the composition of the residue mass led to a greater release of K in the first year of the experiment. During this period, the residue mass under treatments I, II, III and IV, respectively lost 0·84, 0·80, 0·86 and 0·80 as proportion of the total amount of K released. Due to being highly soluble, the average concentration of K remaining in the residue mass at the end of the period was the lowest of all the nutrients and ranged from 4·5 kg/ha for the treatment that employed the least residues to 9·7 kg/ha for the maximum dose.
Temporal evolution of kg of K in residue mass per ha of cover in the different pruning residue treatments used in the study. A double exponential model (above) and a single exponential model (below) have been represented. Vertical lines represent the s.e.
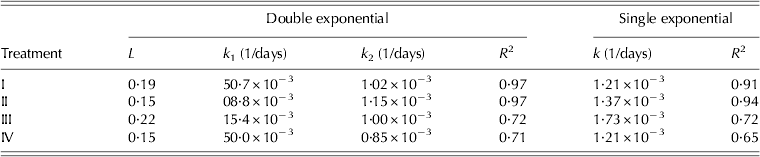
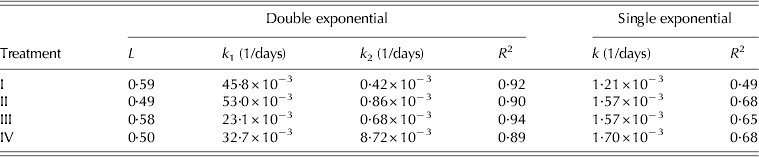
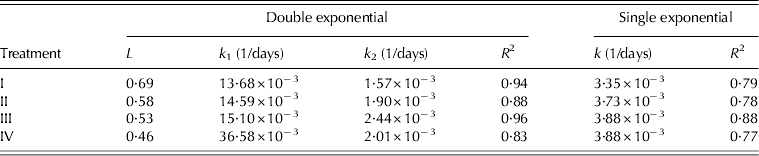
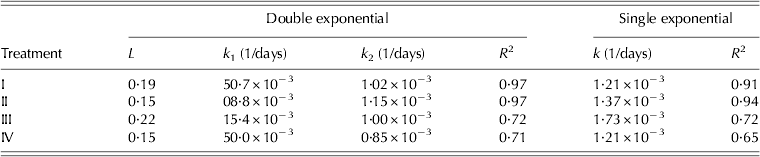
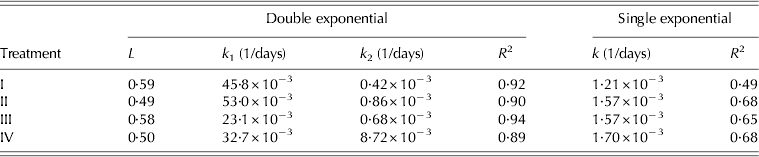
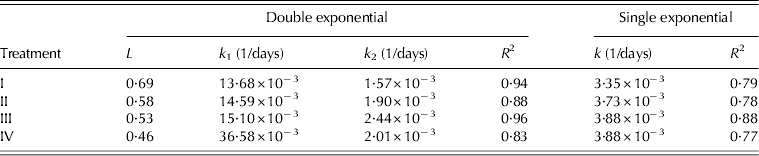
Tables 5 to 7 represent the fit of a single and double exponential model over time to the release of N, P and K during the decomposition of residue mass. In general terms, as the residue mass contains matter that does not decompose easily, such as cellulose, hemicellulose and lignin, all the nutrients fitted the double exponential model better and recorded higher determination coefficients than those registered by the single exponential model.
Fit of a double and single exponential model to N remaining in pruning residues (kg/ha)
R 2: coefficient of determination.
Fit of a double and single exponential model to P remaining in pruning residues (kg/ha)
R 2: coefficient of determination.
Fit of a double and single exponential model to K remaining in pruning residues (kg/ha)
R 2: coefficient of determination.
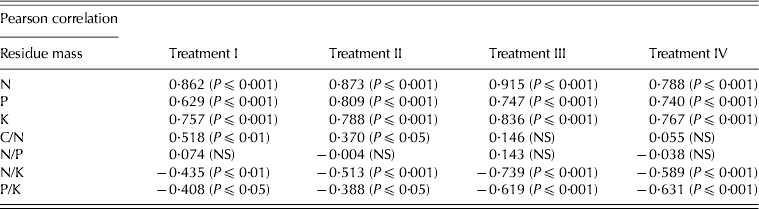
Pearson correlation coefficients were estimated between the dynamics of dry matter in the residue mass, that of the various nutrients and their relationships (Table 8). The trend in N, P and K content of the various treatments of pruning residues was strongly related to the evolution of the biomass, with P⩽0·001 in all cases.
Pearson correlation coefficients between residue mass (kg/ha) and nitrogen (N), phosphorus (P) and potassium (K) in kg/ha, and between C/N, N/P, N/K and P/K ratios for each treatment
NS, not significant.
The highest correlation coefficients were generally observed between the biomass and N. The coincidence between dry matter dynamics and N in the residue mass was due to the fact that the proportion of this element remained practically unchanged throughout the entire cycle of decomposition, recording average values of 0·0085 and 0·0098 for the initial and final samples, respectively.
Increase in soil nutrients
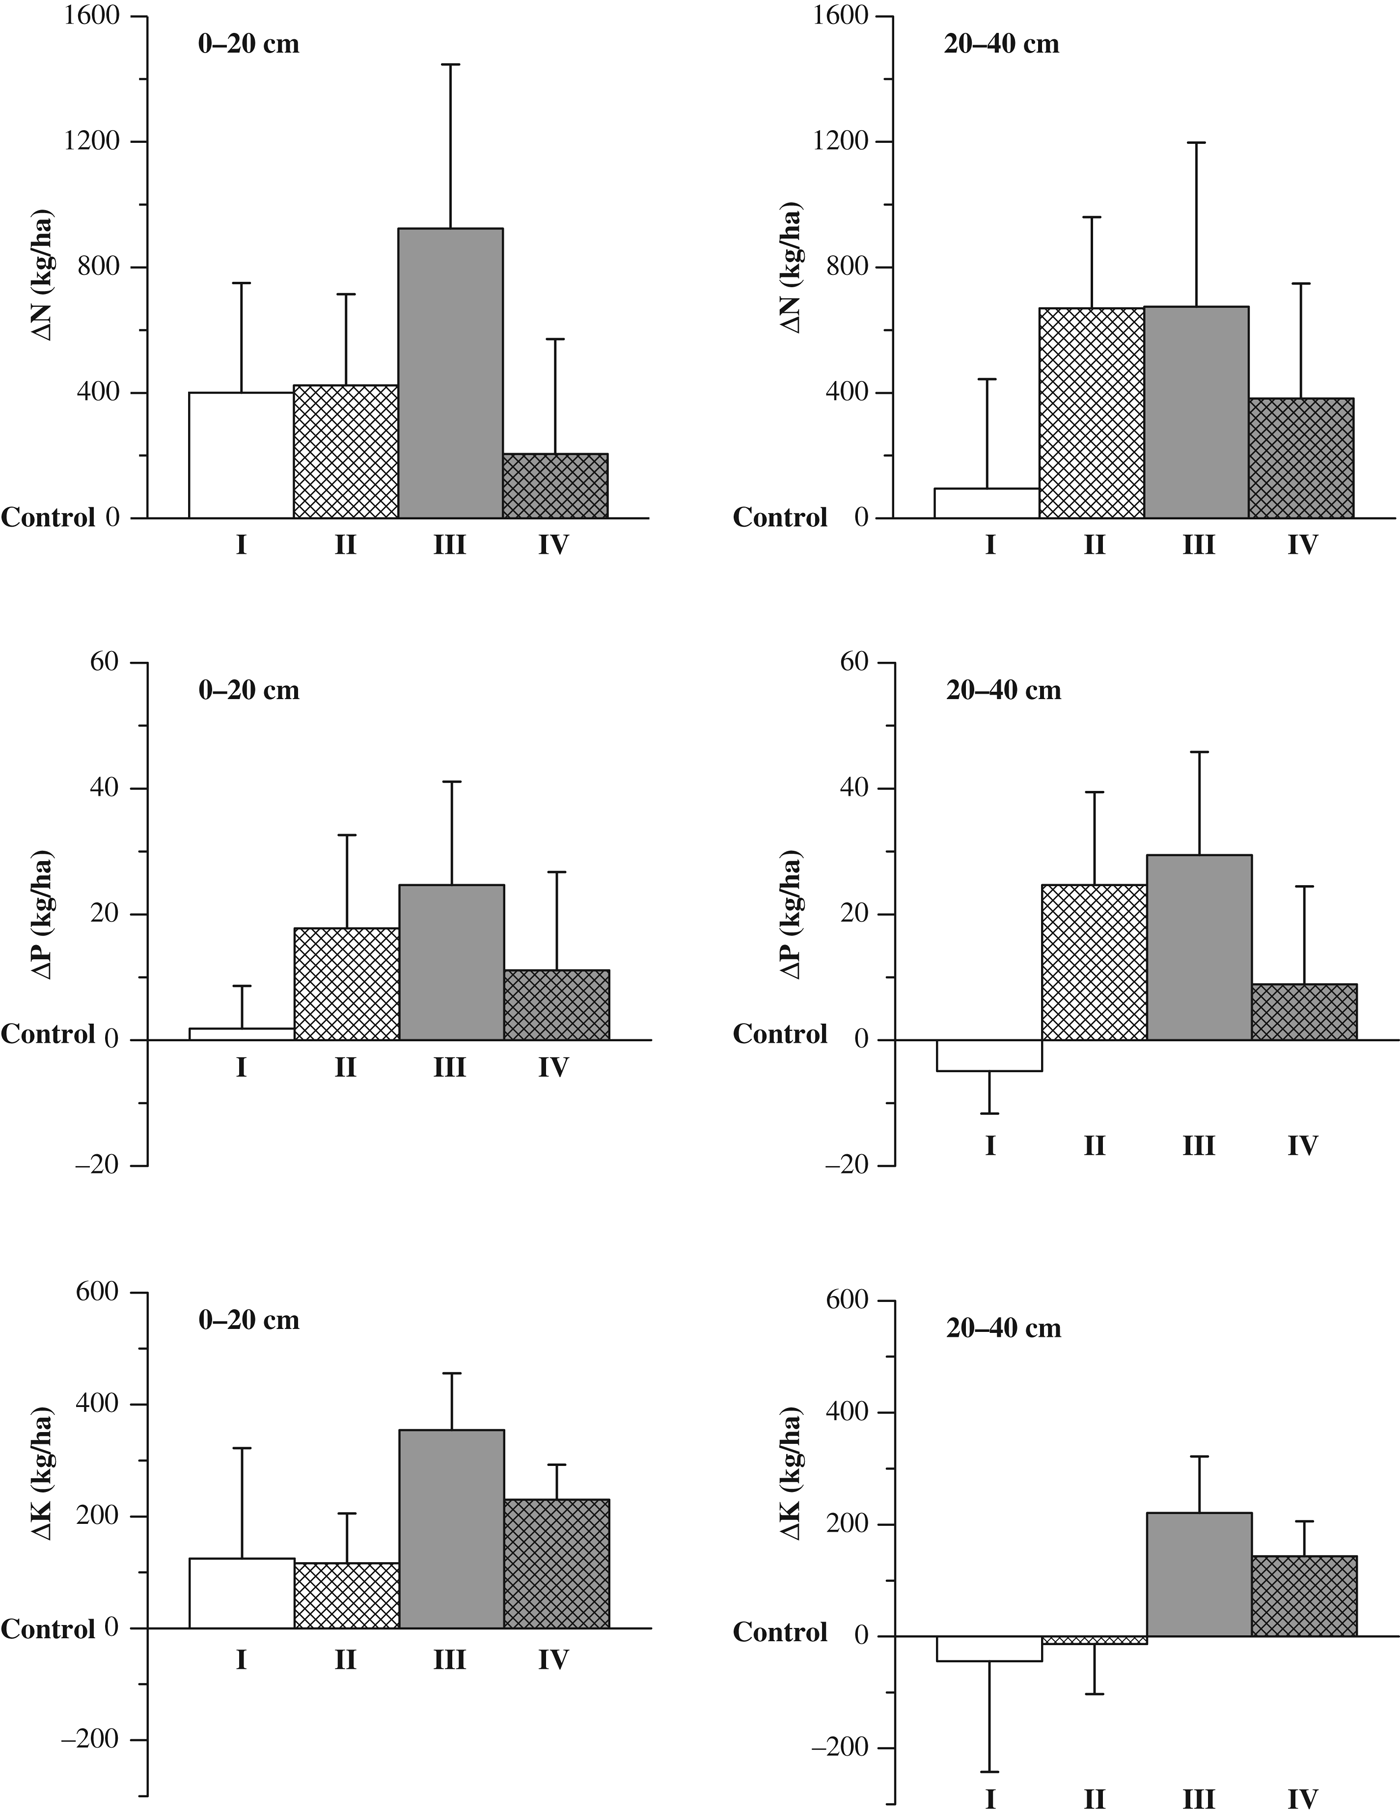
The effect of the evolution of the residues under the different treatments on the concentration of N, P and K in the soil was evaluated. One common practice in organic olive growing is to allow spontaneous weeds to grow as plant cover to protect the soil. For this reason, in order to estimate the real effect of the decomposition of pruning residues on the various nutrients considered, the values of N, P and K content of the control sample (spontaneous weeds) were subtracted from those estimated for the rest of the treatments. The result of this calculation is presented in Fig. 4 and two depths were considered to assess the effect of pruning residues both on the soil surface and also at lower layers. In all cases the value of the s.e. of the data was very high, which explains why no significant differences were observed between the treatments for any of the nutrients considered.
Increase in soil nutrients (N, P and K) in kg/ha between each treatment and the control, at depths of 0–20 and 20–40 cm. Vertical lines represent the s.e.
The concentration of N increased in all treatments and at all depths considered. On the soil surface (0–20 cm), the largest increase was observed under treatment III, where N concentration rose by 28·0% in regard to the control. As regards the rest of the treatments, increases of 13·0 (I), 13·7 (II) and 6·6% (IV) were recorded when compared to the control.
In the deepest layer of soil (20–40 cm), the amount of N in regard to the control generally increased by more than on the soil surface. Nutrient increases of 8·7, 61·0, 61·6 and 35·0% were registered for treatments I, II, III and IV, respectively.
The effect of pruning residue decomposition on P content in the soil surface differed markedly from one treatment to another. The smallest increase (4·6%) was recorded under treatment I, which involved the least amount of residues, while the largest increase (58·8%) was observed under treatment III, in which the largest quantity of residues were applied. In regard to treatments II and IV, which combine fine and thick residues, P increased by 44·7 and 27·9%, respectively.
The concentration of P at depth increased with regard to the control by 97·7, 81·9 and 29·4% under treatments III, II and IV, respectively. Applying residues under treatment I apparently had no effect at this depth on the concentration of P, which actually recorded a lower proportion than the control.
Meanwhile, the concentration of K on the soil surface increased in regard to the control by 12·7, 11·8, 27·0 and 23·4% under treatments I, II, III and IV, respectively. At depth, there was only an increase in the soil content of K under treatments III (28·1%) and IV (18·3%). The treatments that involved less pruning residues (I and II) recorded a lower content of K than that estimated for the control.
DISCUSSION
Evolution of dry matter
Dose IV registered the smallest variation in biomass data, probably due to the fact that the high proportion of residue mass influenced the activity of micro-organisms that decompose plant residues. Authors such as Arrigo et al. (Reference Arrigo, Jiménez, Palma, Benito and Tortarolo2005) have pointed out that excess plant residues applied to the soil can produce anaerobic conditions that limit residue decay.
According to ASAE standards (1998), soil is considered to be protected during periods of critical erosion when at least 1120 kg/ha of residues are maintained on the soil surface. The residue mass under the various treatments and on the sampling dates was always maintained well above that limit, thereby ensuring soil protection at all times.
The largest quantity of biomass was lost during the first season. In fact, 0·77, 0·72, 0·62 and 0·57 of the total biomass were lost under treatments I, II, III and IV, respectively. During the decomposition process, the most labile organic compounds, such as sugars, starch and proteins, are easily degraded by micro-organisms in the soil, while other recalcitrant matter, such as cellulose, lignin and waxes have a slower decomposition rate (Aguilar Bustamante Reference Aguilar Bustamante2005). The amount of residues applied also affected decomposition, as the largest percentage loss of biomass was recorded under treatment I (85%), which involves the least amount of residues.
No papers were found that allowed comparison of the biomass decomposition results of the current study to others that assess the behaviour of olive pruning residues. As regards other studies of perennial crop residues, the amount of dry matter remaining in the residues of treatment IV was similar to that indicated by Boniche et al. (Reference Boniche, Alvarado, Molina and Smyth2008) in a paper on the annual decomposition of palm stalks (Bactris gasipaes) and to the matter decomposed from oil palm tree pruning residues in Malaysia, regardless of whether it comes from plant biomass (Khalid et al. Reference Khalid, Zin and Anderson2000a) or empty fruit bunches.
In a study on the decomposition of residues from different types of plant cover used in olive groves, Ordóñez et al. (Reference Ordóñez, Carbonell, Repullo, González, Rodríguez-Lizana, Sequi, Ferri, Rea, Montemurro, Vonella and Fornaro2009) estimated an annual loss of biomass of 3110 kg/ha in the case of Brachypodium distachyon, 1350 kg/ha for Eruca vesicaria and 1540 kg/ha for Sinapis alba. All of those values were substantially lower than those recorded in the current study, although the proportions of decomposed residue were similar: 0·60, 0·46 and 0·49, respectively.
Nitrogen, phosphorus and potassium release
Since micro-organisms can more easily decompose fine residues, treatments with fine pruning residues only released greater proportions of N.
The results obtained for this type of residue in one growing season contrast with those estimated by Rodríguez-Lizana et al. (Reference Rodríguez-Lizana, Carbonell, González and Ordóñez2010) in a study on the release of N, P and K during the decomposition of more degradable residues such as pea (13·5, 2·9 and 9·9 kg/ha), wheat (6·7, −0·6 and 22·5 kg/ha) and sunflower (8·5, 0·7 and 78·0 kg/ha) in one growing season under similar climate conditions. Despite this, the proportions of nutrients released were usually higher than those obtained with the treatment of the current study: 0·77, 0·88 and 0·96 for pea; 0·48, −0·48 (immobilization) and 0·93 for wheat; and 0·56, 0·63 and 0·98 for sunflower. In the first year, the proportions of nutrient released ranged between 0·27 and 0·81.
In a study on the annual decomposition of palm stalks, Boniche et al. (Reference Boniche, Alvarado, Molina and Smyth2008) indicated similar N release values to those in the current study, but higher values in the case of P and K. In addition, for Acacia mangium residues, Ngoran et al. (Reference Ngoran, Zakra, Ballo, Kouamé, Zapata, Hofman and Van Cleemput2006) obtained losses of K of >80%.
Ordóñez et al. (Reference Ordóñez, Carbonell, Repullo, González, Rodríguez-Lizana, Sequi, Ferri, Rea, Montemurro, Vonella and Fornaro2009) assessed the mineralization and release of nutrients from the residues of various herbaceous species used as plant cover in olive groves over one growing season, finding that B. distachyon released 81·6, 7·3 and 78·2 kg/ha (82, 85 and 94% released), Eruca vesicaria released 24·3, 3·4 and 33·4 kg/ha (58, 61 and 86% released) and S. alba released 21·5, 3·5 and 8·6 kg/ha (56, 68 and 67% released) for N, P and K, respectively. These amounts contrast with those indicated in the current study and highlight how important the choice of cover is when it comes to achieving improvements in the soil.
Evolution of nitrogen, phosphorous, potassium and models
The amount of nutrients released from pruning residues and the timing of this process during decomposition is very important for improving soil fertility (Mendoça & Stott Reference Mendonça and Stott2003). The release of N, P and K from the residue mass as it decomposes fitted a downwardly exponential model, which took into account the amount of nutrient that remains in the residue mass throughout the period of decomposition. This type of model is related to the existence of various chemical constituents of differing resistance to degradation contained in the material. In this sense, the readily decomposable constituents degrade rapidly, as indicated by Wilson & Hargrove (Reference Wilson and Hargrove1986), who studied the release of N and C from crimson clover residues. Similar results were obtained with Leucaena pruning residues in a shaded coffee agroecosystem by Youkhana & Idol (Reference Youkhana and Idol2009).
Authors such as Rovira & Vallejo (Reference Rovira and Vallejo1997) contemplated single and double exponential models, among others, in their studies of decomposition using Eucalyptus globulus, Quercus ilex and Pinus halepensis buried at depth.
The studies performed by Aguilar et al. (Reference Aguilar, Staver, Milberg and Aguilar2001) found that the decomposition of stalks in agroforestry systems such as coffee were better suited to the double exponential model, which distinguishes two components, a labile fraction that decomposes easily and a recalcitrant component that degrades more slowly. Isaac et al. (Reference Isaac, Wood and Shannon2000) reached the same conclusion in a study on the decomposition and N release of pruning from Leucaena species. These authors’ results coincide with those obtained in the current study.
In the case of N, treatments I, II and III displayed a good fit to the aforementioned model with determination coefficients that were very close to one in all cases. Treatment IV did not fit the model as well due to the large amount of residues applied to the soil under this treatment. Possibly, the activity of micro-organisms at the beginning of the decomposition process was negatively influenced. Schlesinger (Reference Schlesinger2000) and Soto et al. (Reference Soto, Luna, Wagger, Smyth and Alvarado2002) found the increase in microbial biomass of colonizing organisms can immobilize them in the residue mass.
As in the previous case, P and K fitted the double model better. In this case, there was a clear difference between treatments that only contain fine pruning residues, which recorded determination coefficients close to one, and those which combine fine and thick residues, which registered lower determination coefficients.
Authors such as Schomberg & Steiner (Reference Schomberg and Steiner1999), in studies on the release of nutrients contained in herbaceous crops that are difficult to decompose, observed disparate behaviour of P in comparison to other elements, even detecting that the microbial biomass had immobilized this nutrient. This is due to this element being released more slowly by the residue mass, resulting in a concentration of P. Furthermore, in conditions in which dry matter is released slowly, structural P can be retained by glucophosphates, nucleotides and mainly by phospholipids of the cellular membrane (Salisbury & Ross Reference Salisbury and Ross1992).
In the double exponential model, the constant k 1 which regulates the decomposition of the labile fraction is generally greater than that estimated in the simple model, and k 2 which contemplates the evolution of recalcitrant compounds was lower in most cases. Authors such as Weerakkody & Parkinson (Reference Weerakkody and Parkinson2006) indicated that in the case of residues with a high C/N ratio, as is the case in the current study, up to three phases can be distinguished in the release of nutrients: an initial phase in which soluble compounds are rapidly released, dominated by washing processes, followed by a phase of immobilization and finally by a net release phase. Tian et al. (Reference Tian, Kang and Brussaard1992) stated that the C/N ratio is the main indicator of microbial activity.
In the simple exponential model, the release constant k was similar for N and P under all treatments and lower than that recorded for K. Similarly, this element registered the highest k 2, which indicates that despite being present in the most recalcitrant fractions of the residue mass, it is released rapidly due to being in ionic and mobile form inside the cytoplasm. The fact that K compounds are more soluble means the climate has a greater effect on the loss and release rate of this element, which accelerate when it rains. These results were similar to those reported by Delgado & Follett (Reference Delgado and Follett2002) who stated that K is not associated with organic C and is leached out by rainfall.
The ease with which residues release K during decomposition when rainfall conditions are favourable was described in other studies with similar characteristics to the current one (Zaharah & Bah Reference Zaharah and Bah1999; Cobo et al. Reference Cobo, Barrios, Kass and Thomas2002). The rapid release of K could be attributed to its presence in mobile cations in the cell fluid, which are released upon disintegration of cell membranes (Jordan Reference Jordan1985; Castellanos-Barliza & León Peláez Reference Castellanos-Barliza and León Peláez2011). Khalid et al. (Reference Khalid, Zin and Anderson2000a) and Lim & Zaharah (Reference Lim and Zaharah2000) also indicated a high K release rate and a low N release rate in studies on the decomposition of residues from various organs of oil palm.
The results of k 1 and k 2 obtained in the model for P and K remaining in the pruning residues were lower than those indicated by Bossa et al. (Reference Bossa, Adams, Shannon and Mullins2005) in a study on decomposition and P and K release patterns from Leucaena leaves in three environments: these authors obtained values of 1·52 and 1·26 for k 1 and 0·024 and 0·075 for k 2 for P and K, respectively.
The composition of the residue mass played a vital role in the amount and speed at which nutrients were released. Khalid et al. (Reference Khalid, Zin and Anderson2000a) obtained a release rate for N in a study on oil palm residues that was much higher in the case of leaves than for other organs such as rachis, petioles and stalks, which contain less readily decomposable compounds. Aguilar Bustamante (Reference Aguilar Bustamante2005) reached similar conclusions in an analysis of data from decomposition and mineralization trials with plant residues in coffee plantations.
The high degree of correlation observed between the dry matter of the residue mass and the elements analysed suggests that if the concentrations were stable, monitoring the remaining biomass could be a good indicator for predicting nutrient release. This is more reliable in N and P than in K because its concentration in residue was less stable. Authors such as Ngoran et al. (Reference Ngoran, Zakra, Ballo, Kouamé, Zapata, Hofman and Van Cleemput2006), Martínez-Yrízar et al. (Reference Martínez-Yrízar, Núñez and Búrquez2007) and Prause & Fernández-López (Reference Prause and Fernández-López2000) found strong relationships between the loss of weight and some quality indicators (lignin, N, C, C/N content, among others) in studies on the decomposition of plant residues, which coincides with the results of the current experiment.
Nitrogen/potassium and P/K were negatively correlated with biomass under all the treatments and were also highly significant in most cases. The explanation for this is the high solubility of K, which causes the release of this element to accelerate when it rains, regardless of the state of decomposition of the pruning residues.
The relationship between the loss of N and P from the residue mass as the biomass decomposes was not significant in any of the cases. This could be due to the fact that these nutrients are generally associated to organic forms and that the exclusive presence of large size residues on the soil can slow down and delay decomposition. In fact, if residues are large (size), bacteria and fungi have little penetration power and practically can only grow on the external surface (Alvear et al. Reference Alvear, Astorga and Reyes2008).
Increase in soil nutrients
After N, K is the element that is most used in fertilizing olive trees (Pastor et al. Reference Pastor Muñoz-Cobo, Hidalgo Moya, Nieto Carriconda, Vega Macías and Pastor Muñoz-Cobo2006). The amounts of nutrients necessary for the plant depend to a great extent on the characteristics of the plantation. The K demand of an olive grove is about 15 kg K2O/1000 kg olives, identical to that of N and in contrast with the 4 kg P2O5/1000 kg olives (Domínguez-Vivancos Reference Domínguez-Vivancos1993; Tombesi et al. Reference Tombesi, Guelfi and Nottiani2002).
Phosphorus can be immobilized by micro-organisms and this process plays an important role in maintaining the levels of this element in the soil (Ngoran et al. Reference Ngoran, Zakra, Ballo, Kouamé, Zapata, Hofman and Van Cleemput2006), as in the case of treatment I at depth (20–40 cm).
In most cases, the nutrients of treatments with pruning residues increased, with respect to the control, at depth (20–40 cm) more than at the surface. This could be due to the fact that processes that affect the content of a soil nutrient, such as erosion, leaching, fixation, volatilization, denitrification, immobilization and absorption by other components of the agroecosystem, such as spontaneous weeds, are more intense on the soil surface, as Khalid et al. (Reference Khalid, Zin and Anderson2000b) observed in a study on the effect of oil palm residue decomposition on the soil content of nutrients.
The decomposition of the plant cover residues increased the medium or long-term levels of nutrients in the soil, as reported by Soria et al. (Reference Soria, Fernández, Menjívar, Pastor and Aguilar2000) in a study on the content of K and its relationship to the properties of 227 olive grove plots.
Ordóñez et al. (Reference Ordóñez, González, Pastor and de Andalucía2007) also observed change in the content of nutrients in a study that assessed the modification in soil properties: the soil in an olive grove where pruning residues were applied for 6 years was compared to a non-tilled olive grove where the soil was left bare. Unlike the current study, Ordóñez et al. (Reference Ordóñez, González, Pastor and de Andalucía2007) found an increase in the content of total N, available P and exchangeable K in the first 15 cm of the soil profile. At greater depths, the results did not favour the soil treated with residues, probably due to the constant application of residues every year affecting the capacity of micro-organisms to decompose them.
Authors such as Ouro et al. (Reference Ouro, Pérez Batallón and Merino2001), Merino et al. (Reference Merino, Rey, Brañas and Rodríguez-Soalleiro2003) and Zas & Serrada (Reference Zas and Serrada2003) performed studies on the effect of applying pruning residues from Pinus radiata plantations to the soil surface on soil properties, obtaining an increase in the main nutrients on the soil surface. Youkhana & Idol (Reference Youkhana and Idol2009) obtained increases in soil C and N with Leucaena pruning residues mulching in a shaded coffee agroecosystem. Brañas et al. (Reference Brañas, González-Río and Merino2000) performed a study on the application of residues from various plantations of E. globulus in order to provide information towards helping to design both the management of slash residues and also the duration of application turns, highlighting the improvement in soil fertility this practice has led to.
CONCLUSIONS
Planning the use of tree residues must consider not only the amount available, but also the provision of nutrients that the operation brings about in the agricultural system. Under the conditions of the study performed for the current paper, the quantity, composition and quality of the residue mass had a great influence on the parameters monitored.
One of the problems restricting the productivity of organic systems is that farmers cannot correct for the lack of nutrients in the soil by applying synthetic fertilizers. Another problem is that herbicides cannot be used to control the weeds, so tillage is usually the preferred method of soil management. In view of the results obtained in the current study, a high dose of fine and thick residues, like the treatment IV, is recommended when the goal of the farmer is to keep the soil protected from erosive agents. However, a treatment of only fine residues in a high dose, as in treatment III, would be more suitable in order to improve the soil fertility in a short to medium term, in accordance with the edaphoclimatical conditions in the region, while still complying with the standards that govern this type of farm system. The release of nutrients during the decomposition of pruning was a better fit to a double exponential model, which includes a labile fraction and another recalcitrant fraction that degrades more slowly.
The authors thank the field workers and laboratory personnel from the soil physics and chemistry team at Centro IFAPA Alameda de Obispo for their cooperation during the field trials, the Department of Innovation, Science and Enterprises of the Regional Government of Andalusia for their financial support through the Project of Excellence RNM 03-205 and the project RTA2010-00026-C02-01 financed by INIA as part of the ‘Subprograma Nacional de Recursos y Tecnologías Agrarias en Cooperación con las Comunidades Autónomas’” (National Subprogram of Resources and Agricultural Technologies in Cooperation with Regional Governments), which at the same time is part of the National Research, Development and Technological Innovation Plan (R&D&I) and cofunded by the European Union through the ERDF.