Introduction
The possibility of converting thermal energy directly into electricity holds promise for improving the efficiencies of current power systems and developing future sustainable energy systems. Reference Chu and Majumdar1 Solid-state thermoelectric (TE) materials Reference Tritt and Subramanian2,Reference Tritt, Böttner and Chen3 hold this promise through the well-known Seebeck effect, whereby a temperature gradient drives the thermal diffusion of charge carriers, giving rise to a counterbalancing electrical voltage. The reverse (Peltier) effect, whereby a drift electrical current carries heat, can deliver cooling power without any moving parts or (potentially hazardous) working fluids. Reference Bell4
Attractive as it is, the application of TE materials has long been limited by their low efficiency. The efficiency of a TE device is proportional to the dimensionless figure of merit
 $$zT \equiv {S^2}\sigma T/({\kappa _e} + {\kappa _p}),$$
where S is the Seebeck coefficient defined as the ratio of the open-circuit voltage to the applied temperature difference (S ≡ –ΔV/ΔT); σ is the electrical conductivity (the combination S 2σ is usually called the power factor); T is the absolute temperature; and κ e and κ p are the electron and phonon contributions, respectively, to the thermal conductivity. Before the development of nanostructured thermoelectrics starting in the 1990s, the highest zT value achieved was around 1, while a zT of at least 3 is needed for thermoelectrics to compete with conventional power generation and refrigeration technologies. Reference Zebarjadi, Esfarjani, Dresselhaus, Ren and Chen5 The low zT, and thus the low efficiency, stems from the fact that these material properties are intertwined and usually show opposite trends in a single material. Reference Zebarjadi, Esfarjani, Dresselhaus, Ren and Chen5–Reference Goldsmid7
The idea of making composites has long been exploited in materials research for achieving balanced material properties. Classical modeling of composites usually invokes the “effective medium theory,” which dates back to the works of Lord Rayleigh, Reference Rayleigh8 Maxwell, Reference Maxwell9 and Maxwell Garnett, Reference Garnett10 with the essential assumption that the local material properties of a composite take on values of the corresponding bulk constituent. This assumption is valid when the sizes of individual constituent domains are large, so that classical/quantum size effects Reference Datta11,Reference Chen12 and certain interfacial phenomena can be safely ignored and the local equilibrium distributions of carriers can be established. The effective medium theory for macrocomposites has been applied to thermal transport, for example, by Nan et al., Reference Nan, Birringer, Clarke and Gleiter13 taking into account both the spatial distribution of the material properties and the Kapitza thermal interface resistance.
In the case of thermoelectrics, the analysis of macrocomposites can be traced back to Herring Reference Herring14 and was later extended by Bergman and Levy. Reference Bergman and Levy15 Their work indicated that zT of the macrocomposite cannot exceed the largest value of its components under most practical conditions, although later studies pointed out possible exceptions. Reference Fu, Levander, Zhang, Ager and Wu16 The complexity of the coupled charge and heat transport has prohibited a rigorous treatment of two-phase macrocomposite thermoelectrics so far.
With the advent of nanotechnology in the past few decades, composites with domain sizes down to the nanoscale can now be routinely fabricated. With domain sizes comparable to or smaller than the carriers’ mean free path and/or coherence length, these nanocomposites can exhibit a range of new properties as a result of the ballistic/coherent transport of heat and charge carriers and interfacial phenomena. These added degrees of freedom in nanocomposites have broadened the available phase space for the material optimization and enabled the synthesis of superior nanocomposite TEs with enhanced zT values much beyond unity. Reference Poudel, Hao, Ma, Lan, Minnich, Yu, Yan, Wang, Muto, Vashaee, Chen, Liu, Dresselhaus, Chen and Ren17–Reference Wu, Zhao, Zheng, Wu, Pei, Tong, Kanatzidis and He21
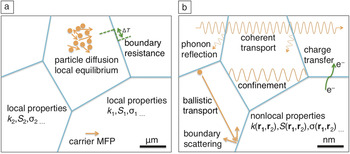
Meanwhile, the emerging effects in nanocomposites have also led to other applications in general thermal engineering other than thermoelectrics. For example, the possibility of coherent phonon transport in nanocomposites has opened up the new research field of “phononics,” where the thermal transport can potentially be controlled in extraordinary ways for diverse application opportunities. Furthermore, thermal interface materials for many applications use composites to improve the thermal transport of the base polymers, although “nano” might not be the best approach because of the increased interface resistance. In this article, we review the unique features of transport properties emerging in nanocomposites and present examples in thermoelectrics and thermal engineering, as summarized schematically in Figure 1 .
Schematics showing distinct transport phenomena in (a) macrocomposites and (b) nanocomposites. Blue lines represent interfaces between different material domains. Note: MFP, mean free path; S, Seebeck coefficient; σ, electrical conductivity; k, thermal conductivity; T, temperature.

Interfacial phenomena
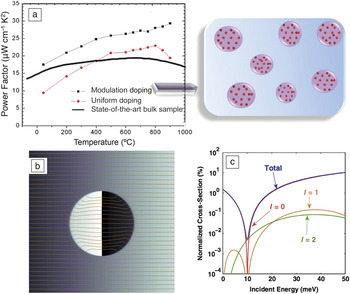
One characteristic of nanocomposites is a high density of interfaces between nano-sized domains, and thus, various interactions between domains across the interfaces play a significant role in the overall transport properties of nanocomposites. One example is the charge redistribution across the interfaces, leading to doping of the host matrix. Because optimized thermoelectrics are usually heavily doped, conventional doping methods using uniformly distributed atomic impurities can largely degrade the carrier mobility through frequent ionized-impurity scatterings. Doping with nanodomains bypasses this problem in that the impurities are confined within the nanodomains, whereas conducting carriers travel mostly in the host, and are thus spatially separated from the scattering centers. This concept of modulation doping has previously been applied to microelectronics in planar structures to enhance the carrier mobility. Reference Daembkes22 The application of modulation doping to three-dimensional bulk nanocomposites Reference Zebarjadi, Joshi, Zhu, Yu, Minnich, Lan, Wang, Dresselhaus, Ren and Chen23,Reference Yu, Zebarjadi, Wang, Lukas, Wang, Wang, Opeil, Dresselhaus, Chen and Ren24 was demonstrated by mixing heavily doped minority nanograins with undoped majority nanograins and hot pressing them into a bulk nanocomposite, as depicted in Figure 2a. With properly designed nanograin properties, it was shown in a Si/Ge alloy Reference Yu, Zebarjadi, Wang, Lukas, Wang, Wang, Opeil, Dresselhaus, Chen and Ren24 that the power factor can be significantly enhanced above that of its uniformly doped counterpart without increasing the thermal conductivity.
(a) Power-factor enhancement of a Si/Ge alloy obtained by modulation doping compared with conventional uniform doping and state-of-the-art bulk samples and schematic of the concept of three-dimensional bulk modulation doping (red dots indicate dopants, and purple circles are the nanodomains). (b) Streamline plot of the probability flux of an electron passing through an “electron cloak,” where the background color indicates the phase of the wave function. (c) Sharp dip in the scattering cross-section with respect to the carrier energy created by an electron cloak by suppressing the first two partial waves (l = 0 and l = 1) simultaneously. (a) Reproduced with permission from Reference 24. © 2012 American Chemical Society. (b–c) Reproduced with permission from Reference 31. © 2012 American Physical Society.

Furthermore, the interfaces within a nanocomposite can be designed for preferred carrier scattering characteristics. It is known Reference Mahan and Sofo25 that the Seebeck coefficient benefits from sharp changes in scattering rates and density of states with respect to the carrier energy near the Fermi level. Compared to atomic defects, nanoscale domains (or nanoparticles, nanoprecipitates) provide more degrees of freedom in scattering engineering, such as the particle size, shape, composition, and spatial distribution. Unlike normal non-resonant atomic defects, whose characteristic size is much smaller than the electron wavelength (so that they give rise to Rayleigh-type scattering with a monotonic dependence of scattering strength on the electron energy), Reference Lundstrom26 nanoscale domains have sizes comparable to the electron wavelength. Their scattering characteristics are analogous to Mie scattering of electromagnetic waves, Reference Bohren and Huffman27 where the interference effect is important and results in much richer features in the scattering strength. In this regime, the partial wave method Reference Schiff28 can be used for exact calculations of the electron scattering cross-section of single nanodomains with regular shapes, and has been applied to design nanoparticles with desired scattering features. Reference Zebarjadi, Esfarjani, Shakouri, Bahk, Bian, Zeng, Bowers, Lu, Zide and Gossard29,Reference Bahk, Santhanam, Bian, Ram and Shakouri30
The ideas of modulation doping and scattering engineering can be further combined: Although modulation doping in bulk nanocomposites improves the carrier mobility over that obtained by conventional uniform doping, the interfaces between nanodomains and the host can still impede the carrier transport, Reference Zebarjadi, Joshi, Zhu, Yu, Minnich, Lan, Wang, Dresselhaus, Ren and Chen23 compromising the mobility enhancement. One solution is to design the geometry, composition, and structure of the nanodomains to minimize, or even eliminate, their scattering cross-sections for carriers around the Fermi level. Furthermore, a sharp dip in the spectrum of the scattering cross-section can potentially improve the Seebeck coefficient as well. Such a design was first put forward by Liao et al., Reference Liao, Zebarjadi, Esfarjani and Chen31 in core–shell spherical nanoparticles with carefully designed geometry, band offsets, and effective masses to make the contributions to the total scattering cross-section from the first two partial waves vanish at the same time, as illustrated in Figure 2b–c. They were able to demonstrate a reduced scattering cross-section smaller than 0.01% of the nanoparticle’s physical cross-section. In a model calculation, they showed that the so-called “invisible doping” with core–shell nanoparticles can improve the power factor of the bulk GaAs matrix by one order of magnitude at 50 K. Reference Zebarjadi, Liao, Esfarjani, Dresselhaus and Chen32 Realistic designs using hollow nanoparticles Reference Shen, Tian, Liao and Zebarjadi33 and graphene Reference Liao, Zebarjadi, Esfarjani and Chen34 have also been proposed.
Interfaces can have multiple effects on phonon transport as well. For example, the reflection and transmission of phonons at an interface leads to the thermal boundary resistance (or interfacial thermal resistance), Reference Chen12 which is already present in macrocomposites. In nanocomposites, such interfacial thermal resistance becomes dominant and can significantly reduce thermal conductivity. It is generally assumed that interfaces can randomize phonon phases and scatter phonons to different states, giving rise to the classical size effect that is reviewed in the next section. There is also increasing recognition that interfaces are not effective in randomizing the phases of long-wavelength phonons, and that it is possible to observe coherent phonon transport.
Classical and quantum size effect
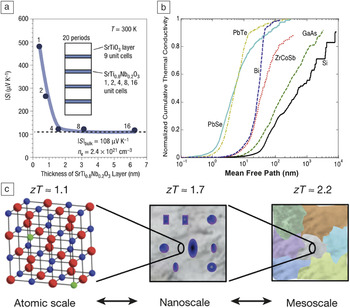
Hicks and Dresselhaus first recognized the potential benefits of nanostructuring to thermoelectrics in their seminal articles Reference Hicks and Dresselhaus35,Reference Hicks and Dresselhaus36 on the modeling of thermoelectric thin films and nanowires. In structures with certain dimensions smaller than the electron coherence length, electrons are confined to a physical space with lower dimensions, and the resulting density of states exhibits sharp transitions with respect to energy, which is desirable for a high Seebeck coefficient. This quantum confinement effect was later observed in various low-dimensional systems, such as quantum dots, Reference Harman, Taylor, Walsh and LaForge37 quantum wells, Reference Hicks, Harman, Sun and Dresselhaus38 superlattices, Reference Venkatasubramanian, Siivola, Colpitts and O’Quinn39,Reference Chowdhury, Prasher, Lofgreen, Chrysler, Narasimhan, Mahajan, Koester, Alley and Venkatasubramanian40 nanowires, Reference Boukai, Bunimovich, Tahir-Kheli, Yu, Goddard Iii and Heath41 and two-dimensional electron gas confined in a single-layer oxide Reference Ohta, Kim, Mune, Mizoguchi, Nomura, Ohta, Nomura, Nakanishi, Ikuhara, Hirano, Hosono and Koumoto42 (as illustrated in Figure 3a).
(a) Enhancement of Seebeck coefficient (|S|) in a two-dimensional electron gas (n e, electron density) confined in a single atomic layer of SrTi0.8Nb0.2O3 sandwiched by insulating SrTiO3 layers through the quantum confinement effect. (b) Cumulative contribution to the total phonon thermal conductivity versus the phonon mean free path distributions in several thermoelectric materials from first-principles simulations. (c) Schematic showing a hierarchical design of nanostructures covering different length scales for blocking phonons with different mean free paths. A cumulative increase in the thermoelectric figure of merit (zT) is achieved when nanostructures of different length scales are introduced. (a) Reproduced with permission from Reference 42. © 2007 Nature Publishing Group. (b) Reproduced with permission from Reference 68. © 2013 American Society of Mechanical Engineers. (c) Reproduced with permission from Reference 19. © 2012 Nature Publishing Group.

In addition to the quantum confinement effect of electrons, the nanoscale interfaces impose strong boundary scatterings on phonons and suppress the thermal conductivity (the classical size effect, or Casimir effect Reference Casimir43 ). Starting in the 1990s, the ultralow thermal conductivity in semiconductor superlattices (lower than that in the corresponding bulk alloys) with nanoscale periods was observed experimentally. Reference Chen, Tien, Wu and Smith44–Reference Capinski, Maris, Ruf, Cardona, Ploog and Katzer47 It was later recognized Reference Chen48,Reference Chen49 that the thermal conductivity reduction observed in superlattices is largely due to the ballistic phonon transport in each layer and phonon scatterings at the interfaces, recently quantified by first-principles simulations. Reference Garg and Chen50 This insight led to later development of bulk nanocomposites Reference Poudel, Hao, Ma, Lan, Minnich, Yu, Yan, Wang, Muto, Vashaee, Chen, Liu, Dresselhaus, Chen and Ren17 consisting of compact nanograins with a high density of grain boundaries acting as effective filters for phonons with long wavelengths and mean free paths. The manufacturing process usually includes ball milling and hot pressing (or spark plasma sintering) and is cost-effective. This strategy has been successfully applied to reduce the thermal conductivity of a wide range of TE materials and has been extensively reviewed elsewhere. Reference Zebarjadi, Esfarjani, Dresselhaus, Ren and Chen5,Reference Minnich, Dresselhaus, Ren and Chen51–Reference Liu, Yan, Chen and Ren53 A recent effort at introducing dislocation arrays into the grain boundaries in BiSbTe through liquid-phase compaction has further boosted the room temperature zT value to ∼1.86. Reference Kim, Lee, Mun, Kim, Hwang, Roh, Yang, Shin, Li, Lee, Snyder and Kim54
In parallel, incorporating nanoscale precipitates in a host matrix through techniques of solid-state chemistry has proven to be another effective way of scattering phonons and reducing the thermal conductivity. One well-studied example is the Ag1–x Pb m SbTe m+2, Reference Hsu, Loo, Guo, Chen, Dyck, Uher, Hogan, Polychroniadis and Kanatzidis55–Reference Li and Li57 or LAST, system, where a second phase rich in Ag and Sb was observed to emerge in the host matrix and form nanoscale domains with long-range order. Reference Quarez, Hsu, Pcionek, Frangis, Polychroniadis and Kanatzidis58 Further improvements were achieved by embedding nanocrystals endotaxially, that is, with complete lattice matching to the host matrix, as demonstrated first in the PbTe-SrTe system, Reference Biswas, He, Zhang, Wang, Uher, Dravid and Kanatzidis59 where the carrier mobility was preserved. It is worth mentioning that the reduction of lattice thermal conductivity due to phonon boundary scatterings has also been observed in certain naturally forming superlattice structures, such as the Ruddlesden–Popper phase of perovskite oxides, Reference Wang, Lee, Ohta and Koumoto60 as well as a recently synthesized layered transition metal dichalcogenide TiS2 intercalated by organic cations between TiS2 layers. Reference Wan, Gu, Dang, Itoh, Wang, Sasaki, Kondo, Koga, Yabuki, Snyder, Yang and Kuomoto61
The key assumption behind the success of the nanostructuring approach is the length-scale separation between the electron and phonon mean free paths: Electron mean free paths are much shorter than phonon mean free paths in most TE materials, and thus, electrons are less affected by the nanostructures. This idea was recently quantified by first-principles simulations of both phonon Reference Broido, Malorny, Birner, Mingo and Stewart62–Reference Tian, Lee and Chen68 and electron Reference Qiu, Tian, Vallabhaneni, Liao, Mendoza, Restrepo, Ruan and Chen69,Reference Liao, Zhou, Qiu, Dresselhaus and Chen70 transport. The first-principles simulations also reveal the wide distribution of phonon mean free paths in real materials (usually spanning the nanometer to micrometer range, see Figure 3b), which necessitates nanostructures of disparate length scales to fully block the phonon flow. Along this path, the nanostructuring approach culminates in the synthesis of all-scale hierarchical micro-/nanostructures in a single material, Reference Biswas, He, Blum, Wu, Hogan, Seidman, Dravid and Kanatzidis19 schematically illustrated in Figure 3c: atomic-scale lattice disorders from alloy doping, nanoscale endotaxial precipitates, and microscale grain boundaries. These features combine to suppress the lattice thermal conductivity, leading to a high reported zT value of 2.2 in a Na-doped PbTe-SrTe system. Reference Biswas, He, Blum, Wu, Hogan, Seidman, Dravid and Kanatzidis19 Despite its conceptual simplicity, this approach still has subtleties, for example, in the interplay among nanostructures with different length scales, that require further study and clarification.
An open question is what the minimum achievable phonon thermal conductivity is and whether nanocomposites can help reduce the phonon thermal conductivity to below the theoretical lower limit of the homogeneous parent materials. For bulk homogenous materials, one classical work is the minimum-thermal-conductivity theory of Slack, Reference Slack, Ehrenreich, Seitz and Turnbull71 later extended by Cahill and Pohl Reference Cahill and Pohl72 based on the kinetic theory, equating the phonon mean free path to one-half of its wavelength, the minimum possible value from Einstein’s random-walk model. Reference Slack, Ehrenreich, Seitz and Turnbull71,Reference Cahill and Pohl72 However, experiments in various superlattice structures showed that this is not truly the minimum. Reference Chen and Tritt73,Reference Chiritescu, Cahill, Nguyen, Johnson, Bodapati, Keblinski and Zschack74 Based on the angular dependence of phonon reflection at interfaces, Chen Reference Chen and Tritt73 argued that the thermal conductivity of superlattices should have a limit lower than that proposed by Cahill and Pohl. In nanostructures, another proposed lower bound of the thermal conductivity is the Casimir limit (typically higher than the minimum of Cahill and Pohl), where the minimum phonon mean free path is set by the characteristic size of the sample, for example, film thickness. These studies all imply that phonons lose their coherence (phase information) at interfaces and are viewed as being in the classical-size-effect regime.
Coherence effect
An interesting question is whether one can explore the wave effects of phonons to achieve a thermal conductivity even lower than the minimum value predicted in the classical-size-effect regime (the Casimir limit), for example, by exploring the bandgaps formed in periodic structures. Reference Ma, Parajuli, Ghossoub, Mihi, Sadhu, Braun and Sinha75–Reference Yang, Yang and Li79 This will require the phonons to maintain their phases when traversing through the structure. This field of phononics Reference Li, Ren, Wang, Zhang, Hänggi and Li80,Reference Maldovan81 includes both acoustic waves with macroscopic wavelengths and thermal phonons with a wide span of wavelengths down to nanometers, entailing nanocomposites for wave effects to occur. The emergence of bandgaps has been reported for acoustic waves in mesoscopic periodic structures. Reference Gorishnyy, Ullal, Maldovan, Fytas and Thomas82–Reference Zhu, Swinteck, Wu, Zhang, Pan, Bass, Deymier, Banerjee and Yano84 Although there have been experimental observations Reference Ma, Parajuli, Ghossoub, Mihi, Sadhu, Braun and Sinha75–Reference Hopkins, Reinke, Su, Olsson, Shaner, Leseman, Serrano, Phinney and El-Kady78 of reduced thermal conductivity in nanoscale periodic structures, possibly due to coherent effects (such as group-velocity modification Reference Yu, Mitrovic, Tham, Varghese and Heath77 ), there is no decisive evidence of the effect of phonon bandgaps on the thermal conductivity so far.
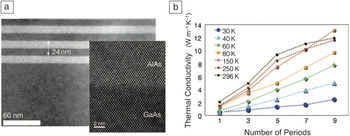
Recently, experimental evidence of coherent phonon transport was seen in the dependence of the low-temperature thermal conductivity of a GaAs/AlAs superlattice on the number of superlattice periods, Reference Luckyanova, Garg, Esfarjani, Jandl, Bulsara, Schmidt, Minnich, Chen, Dresselhaus, Ren, Fitzgerald and Chen85 as illustrated in Figure 4 . If the transport is incoherent, the interfaces in the superlattice completely randomize the phonon phases, and each layer of the superlattice acts as an independent thermal resistor, connected in series to form the total thermal resistance of the superlattice. In this case, the thermal resistance scales linearly with the number of periods, whereas the thermal resistivity, and thus the conductivity, remains constant. In contrast, if phonons travel coherently through the whole superlattice, the total thermal conductance does not depend on the number of periods, and correspondingly, the thermal conductivity scales linearly with the number of periods. The direct experimental measurement of this linear scaling of thermal conductivity established the presence of coherent phonon transport, corroborated by first-principles simulations. Reference Luckyanova, Garg, Esfarjani, Jandl, Bulsara, Schmidt, Minnich, Chen, Dresselhaus, Ren, Fitzgerald and Chen85,Reference Tian, Esfarjani and Chen86 Based on this experiment and past simulations, Reference Dames and Chen87,Reference Chalopin, Esfarjani, Henry, Volz and Chen88 coherent transport in such superlattice structures is not desirable if one’s goal is to reduce the thermal conductivity. In fact, to reduce thermal conductivity, one should attempt to destroy the phonon coherence. Whether phononic crystals can be designed to reduce the thermal conductivity below the Casimir limit is still an open question. It is also interesting to ask whether one can explore other wave effects, such as localization, Reference Sheng89 to further reduce the thermal conductivity. The observation of the coherent phonon transport in superlattices raises hope that one can manipulate phonon wave effects to engineer the thermal conductivity in composite structures.
(a) Transmission electron microscopy (TEM) image (inset: high-resolution TEM image) of the GaAs/AlAs superlattice and (b) measured dependence of the thermal conductivity on the number of superlattice periods at different temperatures. Reproduced with permission from Reference 85. © 2012 American Association for the Advancement of Science.

Soft matter as nanocomposites
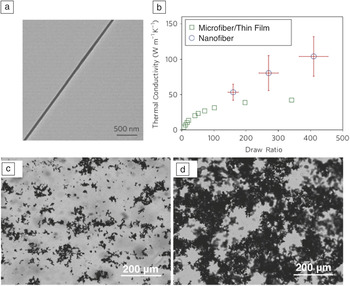
The reduced thermal conductivity of nanocomposites, although desirable and effective for thermoelectric materials, is not preferable when one’s goal is to improve the thermal transport. One example is the composite approach to improving the thermal conductivity of polymers, potentially useful in applications such as thermal interface materials or underfills for microelectronics packaging. Reference Prasher90 Polymers typically have low intrinsic thermal conductivities of less than ∼0.2–0.5 W m–1 K–1. Adding fillers with high thermal conductivities into polymers has been widely used to enhance polymers’ thermal conductivity. Reference Wong and Bollampally91–Reference Han and Fina93 Applying the existing effective-medium models to such polymers, however, quickly shows that the key thermal resistance comes from the polymer phase, even in the case of micron-sized high-thermal-conductivity inclusions. If nano-sized inclusions are used, interfacial resistances between the polymer and the inclusions become important, and size effects further limit the improvement of the thermal conductivity. For example, adding carbon nanotubes to polymers has so far been able to improve the thermal conductivity only up to a few watts per meter-kelvin. Reference Han and Fina93 On the other hand, if one can improve the thermal conductivity of the base polymers (see Figure 5a–b for an example), Reference Shen, Henry, Tong, Zheng and Chen94–Reference Kim, Lee, Shanker, Shao, Kwon, Gidley, Kim and Pipe96 the composite approach will be more effective.
(a–b) Significantly enhanced thermal conductivity in a drawn polyethylene nanofiber with improved alignment of polymer chains: (a) Transmission electron microscopy image of a drawn polyethylene nanofiber and (b) measured thermal conductivity of the nanofiber with respect to the draw ratio, compared to that of thin films of micrometer-sized fibers. (c–d) Optical microscopic images of stable graphite suspensions with ethylene glycol as the base fluid. In (c), the graphite volume fraction is 0.03%, below the percolation threshold, and the clustering of graphite flakes can be observed, whereas in (d), the graphite volume fraction is 0.1%, and the formation of a percolation network can be observed. (a–b) Reproduced with permission from Reference 94. © 2010 Nature Publishing Group. (c–d) Reproduced with permission from Reference 99. © 2012 American Chemical Society.

Another regime of thermal transport in composites is when one phase begins to percolate, establishing long-range connectivity. Although electrical-conductivity percolation in a composite is a well-known phenomenon Reference Kirkpatrick97 accompanied by a power-law increase of the electrical conductivity above the percolation threshold, the same behavior has not been observed for thermal transport, because thermal transport is not limited to the percolating phase. Recently, however, interesting percolation behavior was observed in nanofluids—liquids with suspended nanoparticles. Reference Wang, Zheng, Gao and Chen98,Reference Zheng, Gao, Wang, Feng, Ohtani, Wang and Chen99 Some of these solid–liquid nanocomposites were found to exhibit anomalously enhanced thermal conductivities beyond the predictions of the classical effective-medium theory in certain cases, although the enhancements were not observed in other cases. Reference Wang, Zheng, Gao and Chen98 The large variations in the experimental findings are now understood to be related to the complex structures formed by the nanoparticles within the fluid, which can be sensitive to the external conditions and preparation procedures. Reference Wang, Zheng, Gao and Chen98 Gao et al. observed the clustering of nanoparticles in the freezing of a nanofluid containing alumina nanoparticles, and, in particular, when the base fluid crystalized, the nanoparticles were pushed to the grain boundaries and formed a percolation network. Reference Gao, Zheng, Ohtani, Zhu and Chen100 Further experiments on graphite-flake suspensions (as illustrated in Figure 5c–d) showed that the thermal conductivity increased faster with the volume fraction of graphite when it was below the percolation threshold than above, contrary to the case of the electrical conductivity. Reference Zheng, Gao, Wang, Feng, Ohtani, Wang and Chen99 This behavior was explained as a result of the graphite clusters minimizing the interfacial energy below the percolation threshold, leading to better contact between the flakes and smaller contact resistances. Reference Zheng, Gao, Wang, Feng, Ohtani, Wang and Chen99 The underlying mechanism exemplifies the significance of the structure–property relations manifested, especially in soft matter, where the internal structures can vary greatly. Reference Lu, Zaccarelli, Ciulla, Schofield, Sciortino and Weitz101 There are still many open questions on how the variations in the internal structure, such as the percolation effect, affect the thermal and thermoelectric properties of soft matter.
Summary
In this article, the progress made in applying the concept of nanocomposites to the field of thermoelectrics and thermal engineering is reviewed at a high level, with an emphasis on the emerging principles of heat and charge transport in nanocomposites that are distinct from those in macrocomposites. Looking forward, we believe that a synergistic fusion of these new features and principles will lead to better material performance, which can be accelerated through advances in both multiscale transport modeling techniques and material synthesis and processing capabilities.
Acknowledgments
This article was supported by S3TEC, an Energy Frontier Research Center funded by the US Department of Energy, Office of Basic Energy Sciences, under Award DE-FG02-09ER46577 (for research on thermoelectric power generation); the Air Force Office of Scientific Research Multidisciplinary Research Program of the University Research Initiative (AFOSR MURI) through Ohio State University, under Contract FA9550-10-1-0533 (for research on thermoelectric cooling); and the US Department of Energy, Office of Energy Efficiency & Renewable Energy, Advanced Manufacturing Program (DOE/EEREAMO) under Award DE-EE0005756 (for developing polymers with high thermal conductivity).