1 Introduction
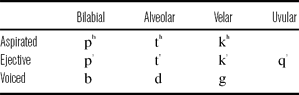
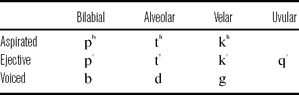
Georgian, a Caucasian language spoken in Georgia, has three stop series: voiceless aspirated, voiced and ejective (Shosted & Chikovani Reference Shosted and Chikovani2006). Its stop inventory is given in table 1. This study examines the stop consonants of Georgian and will look at a number of acoustic measures in order to describe the similarities and differences between ejectives and the other stop series present in the language. This information will be used to make predictions about which acoustic features might best serve as perceptual cues. This study will also examine how the acoustic characteristics of the stop consonants change at different prosodic positions, or in other words, how they participate in the process of initial strengthening (Fougeron & Keating Reference Fougeron and Keating1997).
Stop inventory of Georgian.
1.1 Ejectives and stop systems with ejectives
Ejective stops are produced quite differently from pulmonic stops. They are produced using simultaneous constrictions in the oral cavity and at the glottis, and they are often associated with loud bursts, caused by increased oral air pressures due to raising of the glottis during constriction. There has been considerable research into the phonetics of ejectives over the last few decades. Some of the acoustic characteristics of ejectives that have been explored include voice onset time (henceforth, VOT; Hogan Reference Hogan1976, Lindau Reference Lindau1984, Ingram & Rigsby Reference Ingram and Rigsby1987, Sands, Maddieson & Ladefoged Reference Sands, Maddieson and Ladefoged1993, McDonough & Ladefoged Reference McDonough and Ladefoged1993, Warner Reference Warner1996, Maddieson, Smith & Bessell Reference Maddieson, Smith and Bessell2001, Wright, Hargus & Davis Reference Wright, Hargus and Davis2002, Billerey-Mosier Reference Billerey-Mosier2003, Wysocki Reference Wysocki2004, Gordon & Applebaum Reference Gordon and Applebaum2006, Hargus Reference Hargus2007), closure duration (Lindau Reference Lindau1984, McDonough & Ladefoged Reference McDonough and Ladefoged1993, Warner Reference Warner1996, Wysocki Reference Wysocki2004, Gordon & Applebaum Reference Gordon and Applebaum2006, Hargus Reference Hargus2007), voicing jitter (Wright et al. Reference Wright, Hargus and Davis2002, Hargus Reference Hargus2007), F0 (Warner Reference Warner1996, Wright et al. Reference Wright, Hargus and Davis2002, Hargus Reference Hargus2007) and amplitude measures, such as the amplitude of the burst or the amplitude rise time of the following vowel (Ingram & Rigsby Reference Ingram and Rigsby1987, Warner Reference Warner1996, Wright et al. Reference Wright, Hargus and Davis2002, Hargus Reference Hargus2007).
A sizable percentage of this research has concentrated on the question of ejective typology, specifically the idea proposed by Kingston (Reference Kingston1985) that ejectives could be classified into two types: fortis and lenis. However, it now seems that such a binary typology does not exist. Instead, ejectives in different languages, and even ejectives within a single language (produced by different speakers), cover a continuum of acoustic characteristics (Ingram & Rigsby Reference Ingram and Rigsby1987, Warner Reference Warner1996, Wright et al. Reference Wright, Hargus and Davis2002, Hargus Reference Hargus2007). While most research on ejectives has concentrated on the possibility of a fortis/lenis classification, the issues of how ejectives differ acoustically from other stop series within a given language, and thus, which acoustic measures are likely to cue ejective stop type perceptually, have gone largely unexplored. In particular, the similarities and differences between ejectives and voiced stops are relatively unknown. In fact, voiced stops have been left out of some studies entirely on the assumption that the two stop types were so different that no comparisons needed to be made. This is surprising considering that it has been pointed out that field workers often perceive ejectives as voiced stops (Ingram & Rigsby Reference Ingram and Rigsby1987, Fallon Reference Fallon2002),Footnote 1 and there are proposals in historical linguistics, namely Glottalic Theory (Gamkrelidze & Ivanov Reference Gamkrelidze and Ivanov1972, Hopper Reference Hopper1973), which suggest that ejectives have diachronically changed into voiced stops. In the Glottalic Theory, a theory that proposes a reconstruction of Proto-Indo-European that includes ejectives (or some other, similar glottalic sound), the voiced stops in Greek, Sanskrit and Slavic would have originated from ejectives.
VOT is the most frequently examined acoustic property of ejectives. In most languages, the VOT of ejectives is shorter than that of aspirated stops and longer than either voiced or voiceless unaspirated stops. However, in Kiowa (Billerey-Mosier Reference Billerey-Mosier2003), ejectives have VOTs nearly twice as long as aspirated stops, and in Witsuwit'en, ejectives and voiceless unaspirated stops have equal VOTs (Hargus Reference Hargus2007). Other acoustic measures have shown less success in distinguishing ejectives from other types of stops. Closure duration does not reliably distinguish ejective stop type in Navajo (McDonough & Ladefoged Reference McDonough and Ladefoged1993), Ingush (Warner Reference Warner1996) or Witsuwit'en (Hargus Reference Hargus2007), but does distinguish stop phonation type in Turkish Kabardian (Gordon & Applebaum Reference Gordon and Applebaum2006). Ejectives show slower vowel amplitude rise time than other stop phonation types in Witsuwit'en (Wright et al. Reference Wright, Hargus and Davis2002, Hargus Reference Hargus2007), but not in Gitksan (Ingram & Rigsby Reference Ingram and Rigsby1987).Footnote 2 In both Gitksan and Witsuwit'en, vowels following ejectives were more likely to show an increase in jitter or aperiodicity than vowels following pulmonic stops, and there is some evidence suggesting that F0 on following vowels could be used to distinguish ejective stops from pulmonic stops in both languages. On the whole, in both Gitksan and Witsuwit'en, there was little difference in F0 following different stop phonation types, but there were gender-specific differences. In Witsuwit'en, women show rising F0 following ejectives and men show falling F0. In Gitksan, this pattern is reversed – men show rising F0, women show falling F0.
1.2 Georgian stops
Georgian stops have been examined in a few previous studies. Robins & Waterson (Reference Robins and Waterson1952) offered a descriptive analysis of Georgian phonology, and supported their observations with kymographic data. In their study, they noted that, within the ejective stops, ejectivity was only heard word-initially, but that laryngealization could be heard coarticulated with the following vowel both word-initially and intervocalically word-medially. The aspirated and voiced stops had no noticeable laryngealization. Intervocalic ejectives were heard with some voicing during the closure, an impression supported by their kymographic evidence. Voiced stops, they pointed out, really only showed voicing when surrounded by vowels. Voiced stops often appeared as voiceless unaspirated stops word-initially, word finally, and in clusters.
Wysocki (Reference Wysocki2004) performed an acoustic study of Georgian stops located word-initially and intervocalically in words read from a list by five speakers. She measured VOT and closure duration and qualitatively described noise quality following stop release, burst amplitude and any fluctuations in amplitude and voicing pulses in the following vowel. She found that stop phonation type was not distinguished by closure duration, but that there was a three-way distinction in stop type by VOT. Aspirated stops had the longest VOT, around 90 ms, voiced stops had the shortest, around 20 ms, and ejectives had an intermediate VOT, around 50 ms. Wysocki observed that voiced stops tended to have the quietest bursts and ejectives had the loudest bursts, but there was considerable variation within each stop type. She agrees with Robins & Waterson (Reference Robins and Waterson1952) that the voiced stops are better characterized as voiceless unaspirated stops, and, unlike in their study, she does not even observe significant voicing during the closure in an intervocalic position. She points out that aspirated stops are followed by aspiration noise while ejectives are followed by periods of relative silence, and that vowel onsets following ejectives frequently show fluctuations in amplitude and voicing pulse cycle duration.
1.3 Initial strengthening
The variability in the production of ejectives has mainly been studied in terms of interspeaker variability (e.g. Ingram & Rigsby Reference Ingram and Rigsby1987, Wright et al. Reference Wright, Hargus and Davis2002, Hargus Reference Hargus2007). Wysocki's (Reference Wysocki2004) study on Georgian is one of the very few studies that look at how the production of ejectives varies in different prosodic positions.Footnote 3 She found that for all stops, VOT was shorter intervocalically than word-initially, but the difference was the most dramatic for ejective stops. Aspirated and voiced stop VOT decreased around 5 ms, while ejective VOT decreased about 25 ms. She did not report any differences for the other acoustic features she examined.
It has been well established that speech segments are affected by their position in prosodic structure. Speech segments that appear at the beginning of a prosodic unit appear to be produced with stronger and longer articulations. For example, in a high prosodic position, such as at the beginning of an intonational phrase, English alveolar nasals show greater linguopalatal contact and longer seal durations than when in a lower prosodic position, such as in the middle of a word (Fougeron & Keating Reference Fougeron and Keating1997). Similar effects have been demonstrated for French, Korean and Taiwanese alveolar nasals and stops (Keating et al. Reference Keating, Cho, Fougeron, Hsu, Local, Ogden and Temple2003) and Tamil nasals (Byrd et al. Reference Byrd, Kaun, Narayanan, Saltzman, Broe and Pierrehumbert2000). In English, aspirated stops have longer VOT and glottal fricatives (/h/) are longer, and have lower root mean square (RMS) intensity phrase-initially than when phrase-medially (Pierrehumbert & Talkin Reference Pierrehumbert, Talkin, Docherty and Ladd1992).
Hsu & Jun (Reference Hsu and Jun1998) point out two types of possible strengthening: syntagmatic enhancement and paradigmatic enhancement. Syntagmatic enhancement is defined as the enhancement of the contrast between the consonant and the following vowel. That is, consonants would become more obstruent-like. Paradigmatic enhancement, on the other hand, would enhance the contrast between similar consonants, like stops of different phonation type. In most languages, only syntagmatic enhancement has been observed at the beginnings of prosodic phrases. In their study, Hsu & Jun noted that Taiwanese stops undergo syntagmatic enhancement also. They found that the closure duration for stops of all phonation types is increased when in higher prosodic positions. The increased closure duration helps to distinguish the consonantal nature of the stops from the following vowel. However, Hsu & Jun showed that Taiwanese stops undergo paradigmatic strengthening as well as syntagmatic strengthening. Taiwanese aspirated stops have longer VOT in higher prosodic positions and voiced stops are more voiced, while voiceless unaspirated stops show no differences. Thus, not only are all stops produced in a way that makes them more distinct from the following vowel, but they are also produced in a way that makes them more distinct from other stop types.
1.4 Current study
In this study, the similarities and differences between the Georgian stops will be examined with respect to seven acoustic measures:
• voicing lag
• closure duration
• duration of voicing into the closure
• phonation of the vowel onset (measured by H1-H2)
• change in F0 between post-stop vowel onset and vowel midpoint
• relative intensity of stop burst compared to the following vowel
• burst spectral measures (mean, skew, and kurtosis)
Results of these seven acoustic measurements, in conjunction with a discriminant analysis, will be used to make hypotheses about which of the measures might serve as perceptual cues, and their robustness.
Voicing lag is a measurement of the time between stop burst and the following onset of voicing (Abramson Reference Abramson1977). It is essentially equivalent to VOT, but can only be positive. Voicing lag, closure duration and change in F0 are measured because they are common in previous acoustic studies of ejectives, and voicing lag and F0 have been shown to distinguish ejectives from other stop types in other languages. Phonation is measured because ejectives in Georgian and other languages are associated with laryngealization and irregular voicing. Ejectives are expected to show creakier phonation on the following vowel than other stop types.
If the voiced stops in Georgian are really voiced, the duration of voicing into the closure is expected to separate them from the aspirated and ejective stops. If, however, voiced stops in Georgian are in fact voiceless unaspirated stops, there might be little difference in voicing between them and the ejective and aspirated types. This measure is also of interest because of the finding by Robins & Waterson (Reference Robins and Waterson1952) of some voicing during the closure in ejectives in Georgian, which is an unexpected characteristic of Georgian ejectives.
Ejectives are commonly described as unique because of their perceived sharp, popping bursts, which might translate acoustically into more intense stop bursts. Preliminary evidence from Wysocki (Reference Wysocki2004) suggests that different Georgian stop types might be distinguished by their bursts. Stop bursts can only be characterized by their intensity and spectral moments, both of which are explored here. Spectral moments are normally thought to distinguish stops by place of articulation, but it has also been shown previously that spectral moments, specifically mean burst frequency, can be useful in distinguishing stop type. Sundara (Reference Sundara2005) found that, in Canadian English and Canadian French, voiced stops showed lower mean burst frequency than voiceless stops. In this study, only spectral moments of different stop types will be examined. Spectral moments of different places of articulation will not be compared. There is no known articulatory interpretation of differences in spectral moment across stop type, and this study does not attempt to develop any. Nevertheless, acoustic differences in stop burst may perceptually cue stop phonation type, and will be examined for this reason.
A second goal of the study is to determine how Georgian stops are affected by initial strengthening. Georgian has at least two major prosodic domains – the accentual phrase (AP), which is about the size of a content word, and the intonational phrase (IP), which is about the size of a short sentence or major clause (Jun, Vicenik & Löfstedt Reference Jun, Vicenik and Löfstedt2007). Each of the seven acoustic measures will be examined for each stop type at the beginning of each phrase type, as well as word-medially, a prosodic position below the AP.
If initial strengthening in Georgian works to make segments syntagmatically more consonantal, then it is expected that all stops will show longer closure durations, longer voice lag times, and less voicing into the closure in higher prosodic positions than in lower prosodic positions. If initial strengthening works to enhance the paradigmatic contrast between stop phonation types, then it is expected that aspirated stops will show longer voice lag in higher prosodic positions while voiced stops will show reduced voice lag. Voiced stops should show increased voicing into the closure while ejective and aspirated stops should show less voicing. Phonation contrasts and F0 differences should likewise be enhanced in higher prosodic positions.
2 Methods
2.1 Procedure
This study looks at nine stops in Georgian that differ in place (labial, alveolar and velar) and phonation type (voiceless aspirated, voiced and ejective). The uvular ejective was excluded because its realization varies freely between a glottal stop, an ejective stop and an ejective fricative (Shosted & Chikovani Reference Shosted and Chikovani2006).
Five adult women were recorded. All participants were native, literate speakers of Georgian and fluent L2 speakers of English, and all participants were from Tbilisi. Recordings were made using a Shure head-mounted microphone in the UCLA sound attenuated booth. Its signal was run through an XAudioBox pre-amp and A-D device, and was recorded using PCQuirerX at a sampling rate of 44,100 Hz. Audio signals were segmented using a waveform display supplemented by a wide band spectrogram, and analyzed using Praat (Boersma & Weenink Reference Boersma and Weenink2006) and VoiceSauce (Shue, Keating & Vicenik Reference Shue, Keating and Vicenik2009).
2.2 Materials
Targeted stops were located in real Georgian words, which were found in a dictionary and confirmed with a consultant. Stops appeared either word-initially or intervocalically, beginning the second syllable, and were followed by the low vowel /a/. These words appear in the appendix.
Words were recorded in two different conditions: in two carrier phrases and in three short stories, which were written with the aid of a consultant. In the carrier phrase condition, the vowel preceding the targeted stop was always the low vowel /a/. In the story condition, the preceding vowel was not controlled. The two conditions were used in an attempt to elicit two styles of speech, a more formal and a less formal style. This was done in order to see if and how the significant acoustic correlates differ between speech styles. Tokens in the carrier phrase condition were presented in random order. Approximately one-fourth of the presented items were fillers, which consisted of words that did not contain the target stops.
Targeted stops appeared in three different prosodic positions: intonational-phrase–initial, accentual-phrase–initial and word-medially. In the carrier phrase condition, in order to appear in the intonational-phrase–initial position (henceforth IP-initial), words were placed in the carrier phrase XXX kharthuli sit'q'vaa ‘XXX is a Georgian word’. For both the accentual-phrase–initial (henceforth AP-initial) and word-medial prosodic positions, words were placed in the phrase sit'q'va XXX davts'ere ‘I wrote the word XXX’. All in all, each speaker recorded a total of 452 stops.
The prosodic positions of the targeted words were confirmed after recording by identifying phrasal tone contours and by judging break strength. As reported in Jun et al. (Reference Jun, Vicenik and Löfstedt2007), words in Georgian have stress on the initial syllable, which is marked tonally using pitch accents (either a level tone: L*, H* or a rising tone: L+H*, or LH*). In general, each word makes up one accentual phrase, which, in declarative sentences, is usually marked by a low tone (L*) on the stressed syllable and a high tone on the AP-final syllable (Ha boundary tone). The ending of an IP is marked by a boundary tone, usually with an increased pitch range compared to the APs. The break between two IPs is also considerably larger than between two APs. Cases where the exact prosodic phrasing could not be determined were removed from the analysis. The most common difference from what was predicted was the division of the sentences in the story condition into more phrases, resulting in the placement of a predicted AP-initial word in an IP-initial position. These tokens were recategorized in the analysis.
2.3 Analysis
Seven acoustic measures were made for each targeted sound, when possible. Closure duration and voicing into the closure were measured only for tokens appearing AP-initially and word-medially because there is no marking of the closure onset in IP-initial position. All other measures were made for all tokens.
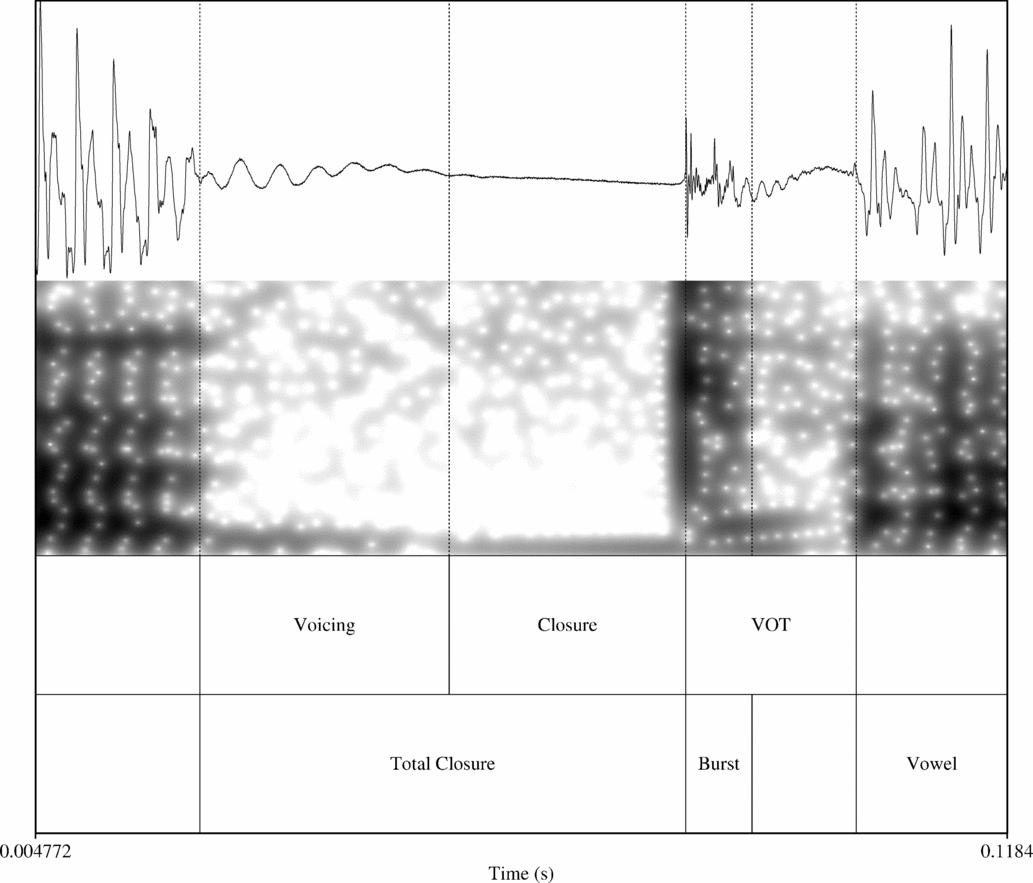
Closure duration was taken to be the duration between the stop onset and the stop burst. The stop onset was marked either by a sharp fall in the waveform amplitude or by the cutoff of higher energy in the spectrogram. The stop burst was marked by a sudden rise in the waveform amplitude. Voicing lag (which can only be positive) was examined rather than voice onset time (which can be negative or positive). There were no tokens that showed partial prevoicing. Any tokens that would have otherwise showed a negative VOT showed voicing throughout the entire closure. This information is captured by the measure of voicing into the closure. Voicing lag was taken to be the duration between the stop burst and the subsequent onset of voicing, which was marked by the beginning of periodicity in the waveform and taken at the first zero-crossing. Tokens with negative VOT were recorded as having a value of zero voicing lag. Voicing into the closure was measured from the stop onset to the last appearance of periodicity in the waveform. The ratio of voicing duration and total closure duration is used in the analysis. These measures are indicated in figure 1 for a word-medial /t’/, from the word sat'axt'o ‘capital city’.
A token of word medial /t’/, from the word sat' axt' o ‘capital city’, illustrating the portions of the stop segmented for analysis. The portion of the closure that showed voicing and the portion without voicing (labeled as ‘closure’) add to give the total closure duration. Voicing lag, burst and total duration of the following vowel (only the beginning portion is shown) are also labeled.

Burst intensity and the shape of the burst spectrum were calculated over the entire burst duration beginning at consonantal release. The size of the analysis window thus varied from token to token; it was determined by the duration of the burst. The period between the burst and the vowel onset (which included aspiration, as in the aspirated stops, or silence, as in some of the ejectives and voiced stops) was not included in the burst intensity measurement. Visual inspection of the spectrogram and waveform was used to distinguish the burst duration from any subsequent gap. The end of the burst was characterized by a sudden drop in intensity and reduced energy at lower frequencies. These portions of the stop are also indicated in figure 1.
Relative burst intensity was calculated relative to the intensity of the following vowel to factor out the effect of differences in overall intensity across speakers. The maximum intensity of the burst (in dB) and was subtracted from the maximum intensity of the vowel (in dB) to obtain these measures (Stoel-Gammon, Williams & Buder Reference Stoel-Gammon, Williams and Buder1994).
The shape of the burst spectrum was characterized by three measures: mean, skew and kurtosis. Spectral moments were derived from the power spectra over the entire burst. To make the procedure for calculating spectral moments consistent with that used by Forrest et al. (Reference Forrest, Weismer, Milenkovic and Dougall1988) and Sundara (Reference Sundara2005), bursts were pre-emphasized prior to making spectral measurements; above 1000 Hz, the slope was increased by 6 dB/oct. Pre-emphasis was accomplished using the ‘Pre-emphasize’ function in Praat (Boersma & Weenink Reference Boersma and Weenink2006). Stops were also filtered using a 200 Hz high-pass filter, making the procedure consistent with Jongman, Blumstein & Lahiri (Reference Jongman, Blumstein and Lahiri1985) and Sundara (Reference Sundara2005).
The degree of spectral tilt, quantified as the difference in amplitude between the first two harmonics, H1-H2, was used as a measure of phonation, as suggested by Gordon & Ladefoged (Reference Gordon and Ladefoged2001). F0 and H1-H2 were measured using VoiceSauce (Shue et al. Reference Shue, Keating and Vicenik2009), a new program for measuring pitch and phonation measures that extends the correction algorithm described in Iseli, Shue & Alwan (Reference Iseli, Shue and Alwan2007). VoiceSauce calculates F0 using STRAIGHT (Kawahara, Masuda-Katsuse & de Cheveigné Reference Kawahara, Masuda-Katsuse and de Cheveigné1999). To calculate the amplitude of the first and second harmonics (H1 and H2), it creates an FFT over three pitch periods. The harmonic magnitudes are extracted from the spectrum by searching for peaks around F0 and 2*F0. This is done for every pitch period in the vowel. For the analysis, H1-H2 was averaged over the first third of the vowel. Change in pitch was calculated by subtracting pitch at the vowel midpoint from the vowel onset (F0Onset – F0Midvowel). Tokens which showed greater than 10 Hz variation over the central third of the vowel were excluded from the analysis, in order to eliminate tokens with a rising pitch accent.
Tokens which did not show a full closure or that were mispronounced were also excluded, as were tokens where the following vowel was whispered. These tokens made up about 1% of the data.
For each measure, a repeated measures (RM) ANOVA was run with the two within-subjects factors of prosodic position (three levels – IP-initial, AP-initial and word-medial) and stop type (three levels – aspirated, ejective and voiced), with alpha set at 0.05. A separate ANOVA was run for each place of articulation (three places – bilabial, alveolar and velar). These ANOVAs seek to avoid the possibility of type 1 error caused by inflated n by using each speaker's mean as the dependent variable, as noted by Wright et al. (Reference Wright, Hargus and Davis2002). As suggested by Max & Onghena (Reference Max and Onghena1999), sphericity violations were corrected by using the Huynh-Feldt correction, which adjusts the degrees of freedom downward in order to reach a more accurate significance value. Because post-hoc tests are not available for RM-ANOVAs, significant interactions and main effects were explored using paired t-tests. For all tests, alpha is set at 0.05. Statistics were calculated using SPSS.
RM-ANOVAs were also run with a two-level factor of condition, either carrier phrase or story. However, the effect of condition was only significant for closure duration and voicing into the closure. Tokens embedded in a story showed shorter closure durations (8.9 ms) and more voicing into the closure (an additional 10% or 3.0 ms) than did tokens read in a carrier phrase. There was no effect of condition for any other measure, suggesting either that there is no difference between speaking styles for these measures, or that the effort to elicit two different speaking styles was not very successful. So, measurements for tokens from the two conditions have been averaged together and the factor has been left out of the final analysis.
3 Results
3.1 Closure duration
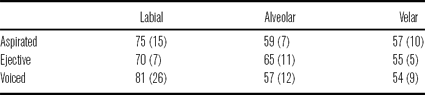
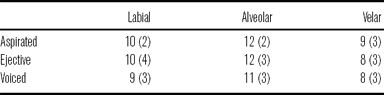
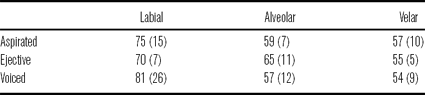
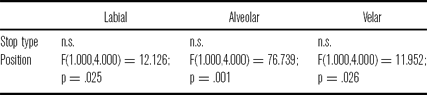
Closure duration did not distinguish the three stop types in Georgian. There was no main effect of stop type at any place of articulation. This confirms the findings of Wysocki (Reference Wysocki2004) and suggests that closure duration would be a very poor cue for stop type. Bilabial stops showed the longest average closure duration, as well as the most variation. Average durations are given in table 2.
Average closure durations, given in milliseconds, for each stop type at all places of articulation.
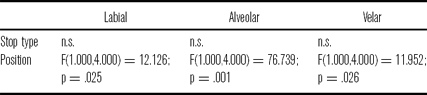
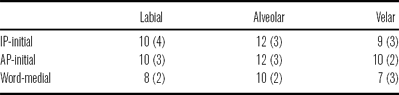
For closure duration, it is expected that stops in higher prosodic positions will have longer closures than stops in lower prosodic positions. This was observed for all places of articulation. On average, stops in an AP-initial position had closure durations of 71 ms, while stops in a word-medial position had closure durations of 56 ms. Durations for each place of articulation are given in table 3. Statistical results for stop type and prosodic position are given in table 4.
Average closure durations, given in milliseconds, in each prosodic position at all places of articulation.

Results from the RM-ANOVA conducted for closure duration.
3.2 Voicing into the closure
In Georgian, all stop types showed voicing into the closure as a continuation of the preceding voiced sound. This voicing usually died out before the stop release, but, for some voiced stops, it continued uninterrupted throughout the closure. There were no instances of stops in an intervocalic position (either AP-initial or word-medial) that showed prevoicing, where the voicing started during the middle of the closure and continued through the stop burst. There were a handful of IP-initial tokens which showed prevoicing (9 of 223), but these were not included in the analysis.
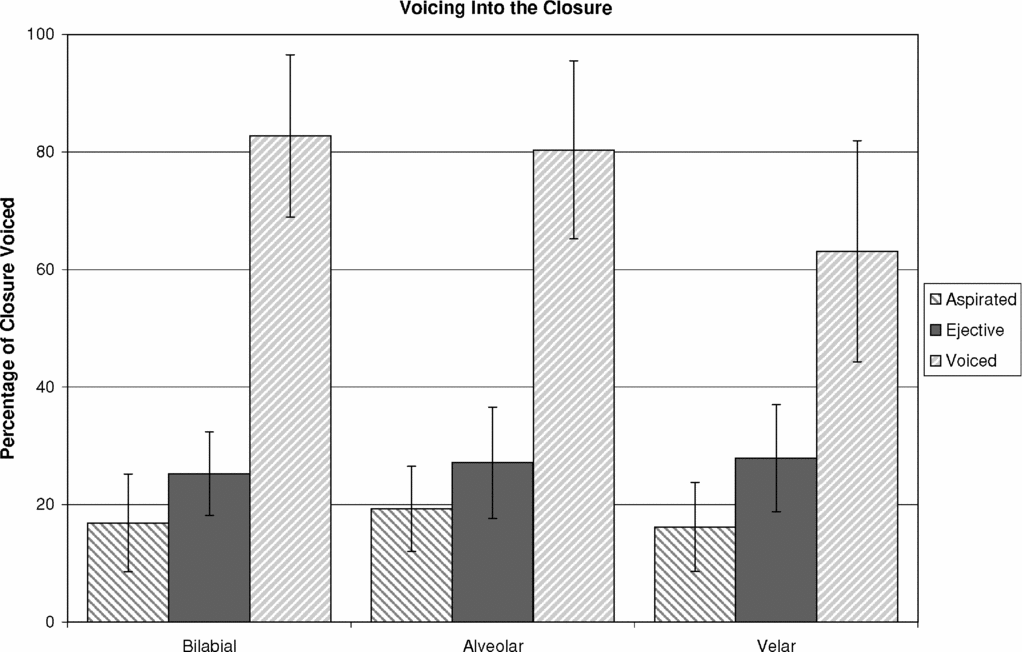
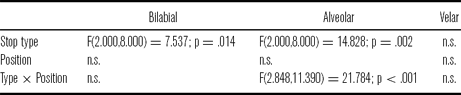
Voicing into the closure distinguished the voiced stops from the aspirated and ejective stops. On average, 75% of a voiced stop's closure was voiced, whereas only 17% of an aspirated stop's closure and 27% of an ejective stop's closure was voiced. However, some velar ejectives showed voicing lasting for half of the closure. Statistically, there was a main effect of stop type on closure voicing at each place of articulation. Voiced stops showed significantly more voicing than either aspirated or ejective stops. There was no significant difference between the aspirated and ejective stop voicing at either the bilabial or alveolar places of articulation. However, the velar stops showed an interaction between stop type and prosodic position. In AP-initial position, velar aspirated and velar ejective stops were significantly different, but not in word-medial position. Average percentages of the closure that was voiced for the three stop types at different places of articulation are given in figure 2.
Average duration of voicing into the stop closure, given as a percentage of total closure duration, for each place of articulation and stop type.

It was expected that stops in lower prosodic positions would be more lenited, or less consonantal, than stops in higher prosodic positions and, thus, show more voicing into the closure, except for possibly voiced stops. Voiced stops might show increased voicing in higher prosodic positions in order to enhance the voicing contrast. However, Georgian stops showed no differences in voicing at different prosodic positions, except for voiced velar stops. Voiced velar stops, /g/, showed significantly greater voicing in word-medial position than in AP-initial position (76.3% vs. 62.6%, respectively), which is contrary to paradigmatic enhancement, though consistent with syntagmatic enhancement. However, the actual amount of voicing is essentially unchanged. In both positions, voiced velars show about 38 ms of voicing. It is the change in closure duration, over which the ratio is calculated, that has decreased. Closure voicing at the velar place of articulation is likely limited by the time it takes the subglottal and supraglottal pressures to equalize. Statistical results for stop type and prosodic position are given in tables 5 and 6.
Results of the RM-ANOVA conducted for voicing into the closure.

Post-hoc paired t-tests for voicing into the closure.

3.3 Voicing lag
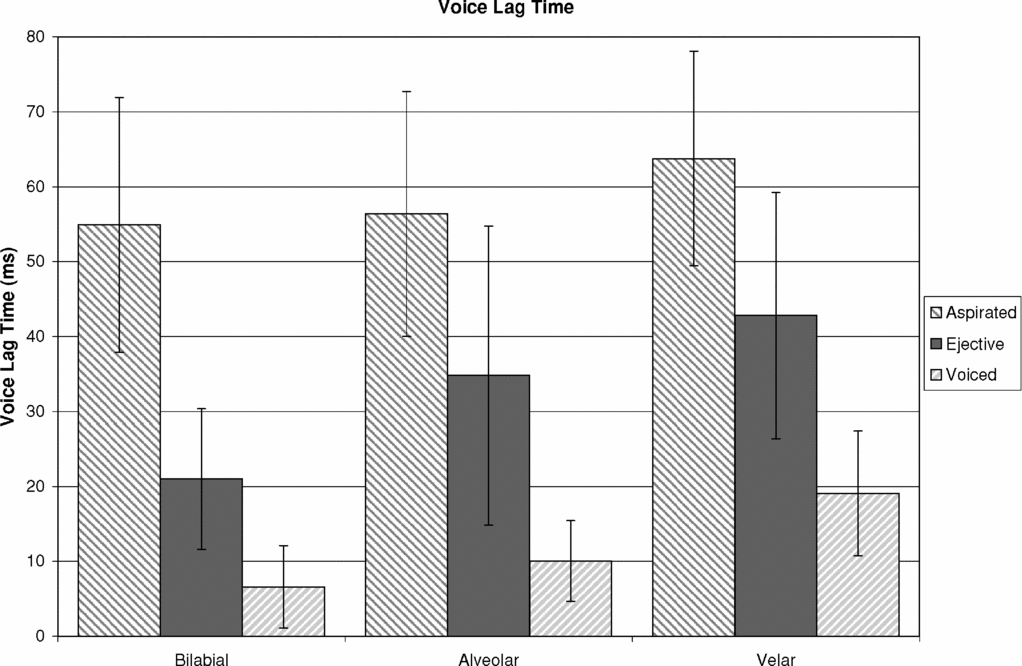
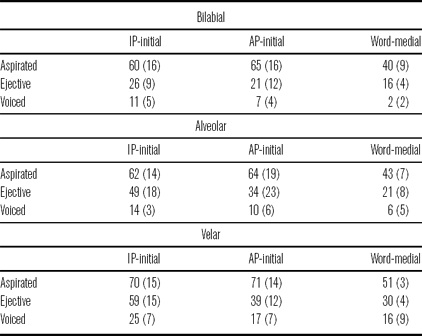
In general, voicing lag distinguished all stop types. Aspirated stops showed the longest voicing lag time, 58 ms on average, and voiced stops showed the shortest voicing lag time, 12 ms. Ejective stops showed an intermediate voice lag time of 33 ms. Voice lag time for all stop types increased at more posterior places of articulation. Average voice lag times for the three stop types at different places of articulation are given in figure 3. These results agree with the general findings of Wysocki (Reference Wysocki2004).Footnote 4
Average voice lag, given in milliseconds, for each place of articulation and stop type.

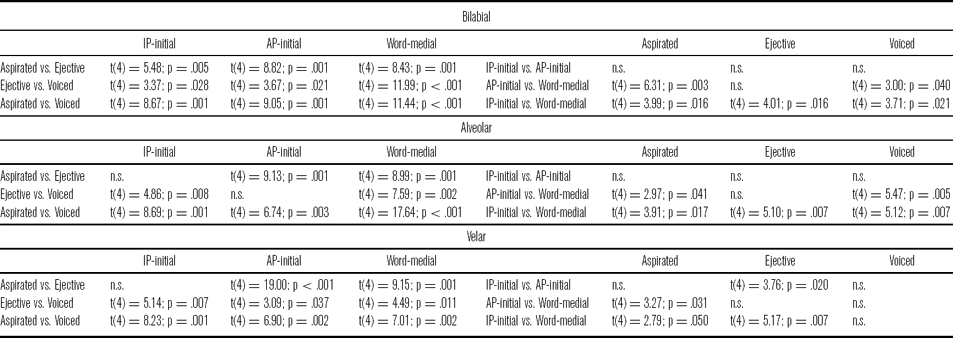
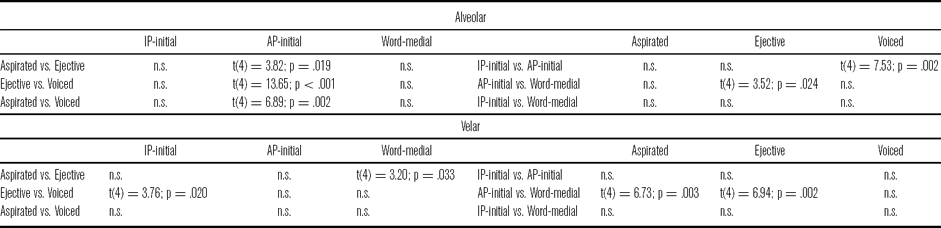
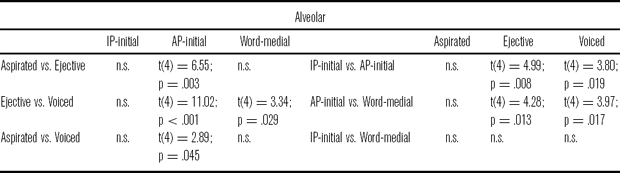
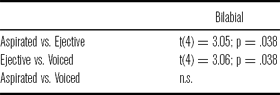
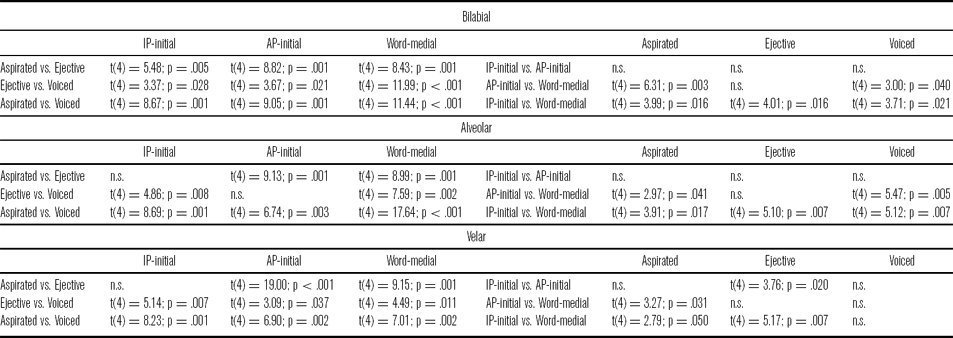
At every place of articulation, there was a significant interaction between stop type and prosodic position. These statistical results are given in tables 7 and 8. Voicing lag distinguished all three stop types in every prosodic position and at every place of articulation except in three cases. In IP-initial position, only bilabial aspirated and bilabial ejective stops showed significantly different voice lag times; alveolar and velar aspirated and ejective stops did not have significantly different voice lag times in IP-initial position. In AP-initial position, alveolar ejective and alveolar voiced stops were not significantly different in voicing lag.
Results from the RM-ANOVA conducted for voice lag.

Post-hoc paired t-tests probing the interaction between stop type and prosodic position for voice lag.
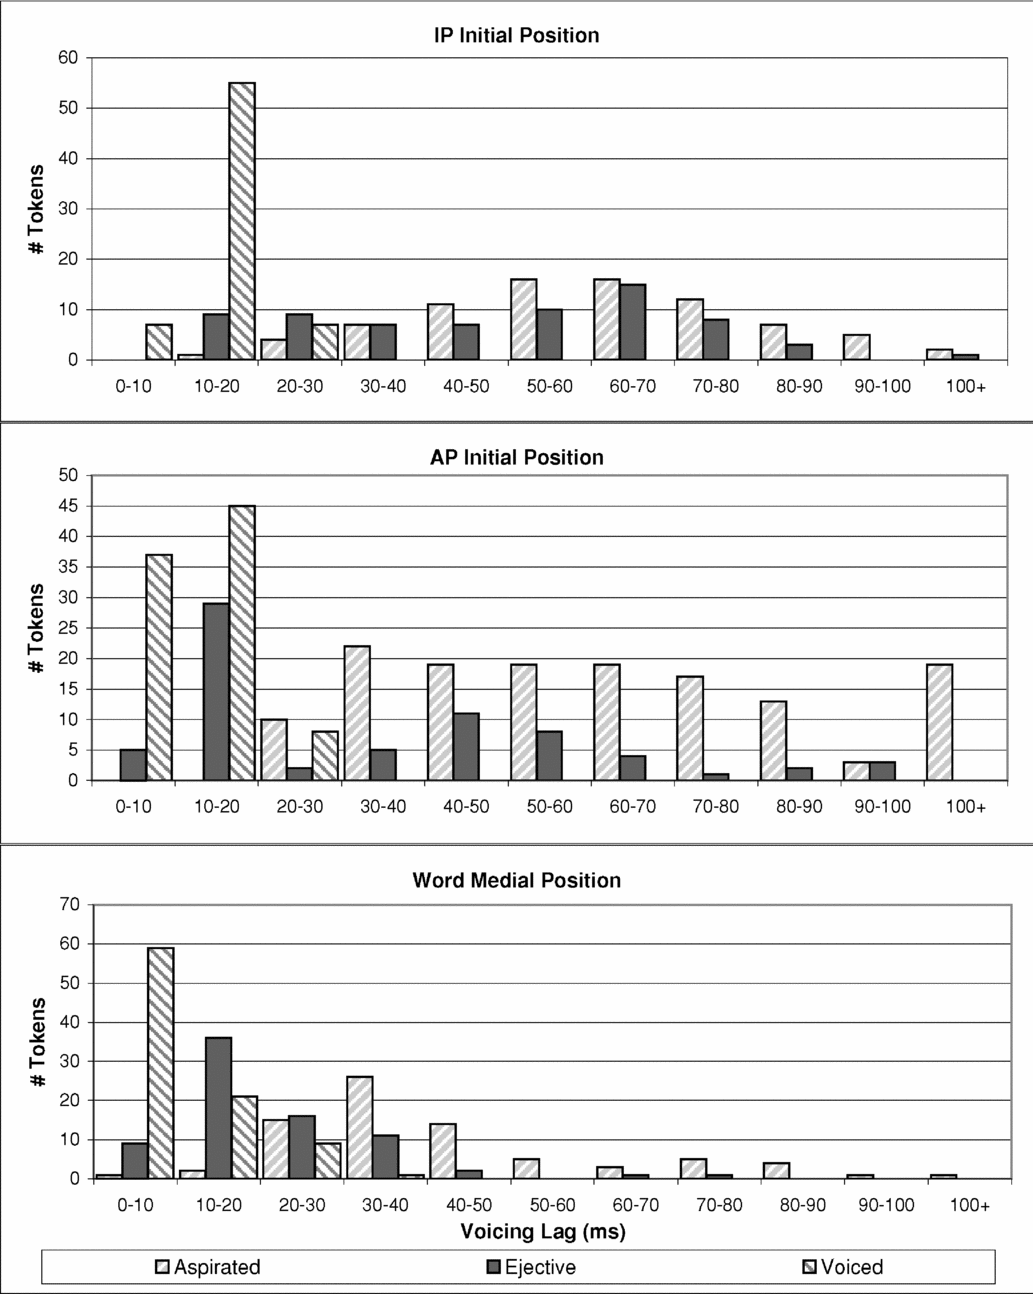
There was considerable overlap between the voice lag time of individual tokens of ejectives and the other two stop types. This is illustrated in figure 4 with alveolar stops. In IP-initial position, there was considerable overlap between the ejectives and the aspirated stops. In this position, ejectives were more likely to have a significant pause between the stop burst and the vowel onset, which was filled with relative silence, caused by a delay in glottal release. In lower prosodic positions, the ejective tokens overlap more with the voiced tokens in voicing lag. In these positions, the ejectives were more likely to have a (near) simultaneous oral and glottal release and did not show a silent gap.
Histograms of voice lag for alveolar stops in IP-initial position, AP-initial position and word-medial position.

It was expected that, if initial strengthening served to make all stops more consonantal, then voicing lag would increase in higher prosodic positions for all stops. On the other hand, if initial strengthening enhanced the paradigmatic contrast between stop types, only aspirated stops should show longer voicing lag in higher positions. Voiced stops should show no change, or reduced lag.
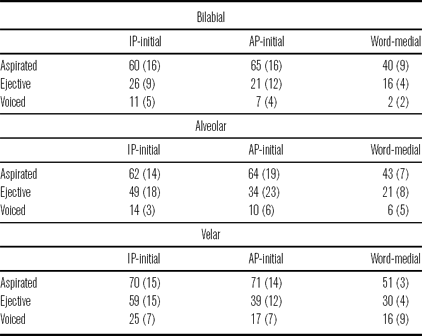
For aspirated stops, there was no difference in voicing lag between IP-initial and AP-initial positions, but voicing lag decreased significantly in word-medial position, by nearly 20 ms. This was true for all places of articulation, and likely caused by the lack of stress in this position. Contrary to the expectations of paradigmatic enhancement, voiced stops showed a general trend of longer voicing lag times in higher prosodic positions. At the bilabial and alveolar places of articulation, voicing lag time was significantly shorter for word-medial voiced stops than either IP-initial or AP-initial voiced stops. However, the difference in voicing lag time between the two higher prosodic positions was not significant. At the velar place of articulation, there was no significant difference in the voicing lag time of voiced stops between any of the prosodic positions. Like voiced stops, ejectives also showed the general trend of longer voicing lag times in higher prosodic positions. At all places of articulation, ejective stops showed significantly shorter voicing lag time in word-medial position than in IP-initial position, but the difference between AP-initial and word-medial positions was not significant. At the bilabial and alveolar places of articulation, the difference between IP-initial and AP-initial ejectives approached significance, but at the velar place of articulation, ejective voicing lag time was significantly shorter in AP-initial position than in IP-initial position. These results are given in table 9.
Average voice lag, given in milliseconds, for each stop type at every prosodic position, separated by place of articulation.
3.4 Relative burst intensity
Of over two thousand tokens measured, 7.5% had no detectable burst. The majority of these tokens were voiced stops (58.1%), 31.7% were aspirated and 10.1% were ejective stops. Of all the tokens measured, only 17 ejectives showed no burst. Stops that had no burst were also more likely to be produced at a more anterior place of articulation: 49.1% of the burstless stops were bilabial, 31.1% were alveolar and 19.8% were velar.
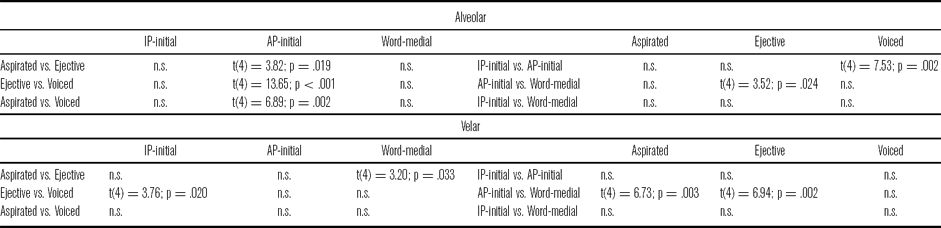
Burst intensity relative to the intensity of the following vowel did not distinguish stop type in Georgian; there was no main effect at any place of articulation. There was also no main effect of prosodic position, indicating that, in general, relative burst intensity does not show any effect of initial strengthening. However, there was a significant interaction between stop type and prosodic position at the alveolar and velar places of articulation. There was no obvious pattern behind these interactions. The main observation of note was that ejective stops showed a significantly stronger burst, relative to the following vowel, in word-medial position than in AP-initial position. The difference in intensity between IP-initial ejectives and word-medial ejectives approached significance. This effect does not appear to be caused by the relative nature of this particular measure. Absolute burst intensities of alveolar and velar ejectives were examined and showed the same pattern as the relative measure, and there is no significant difference in the intensity of the vowels at any prosodic position. The pattern seen for ejective stops actually stems from the burst intensity measurements for the stops themselves. Average relative burst intensities for different stop types are presented in table 10 and for different prosodic positions in table 11. Statistical tests are presented in tables 12 and 13.
Average relative burst intensity, given in dB, for each stop type at all places of articulation.
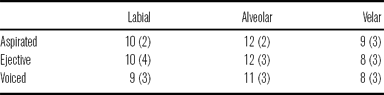
Average relative burst intensity, given in dB, for each prosodic position at all places of articulation.
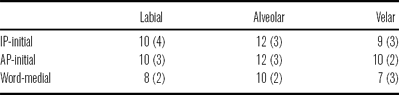
Results from the RM-ANOVA conducted for relative burst intensity.

Post-hoc paired t-tests probing the interaction between stop types and prosodic position for relative burst intensity.
3.5 Spectral moments of bursts
3.5.1 Mean frequency
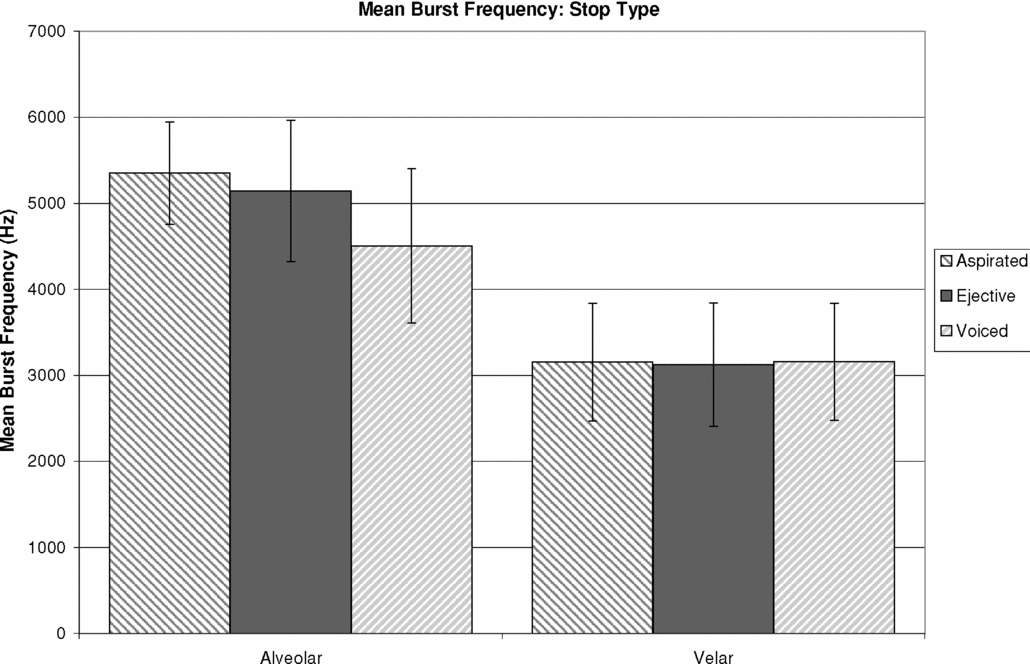
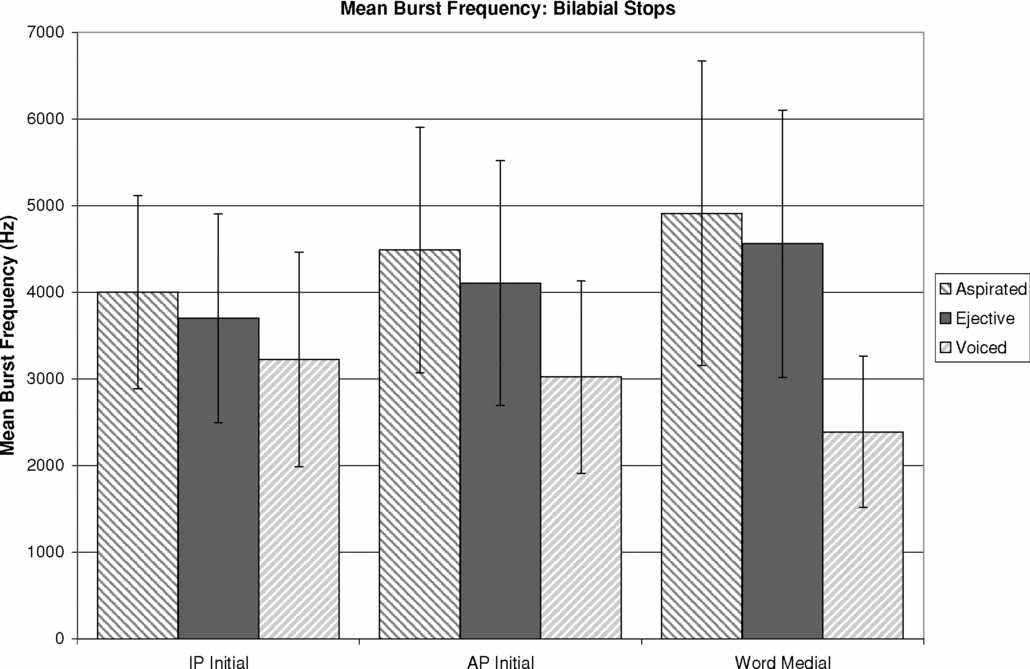
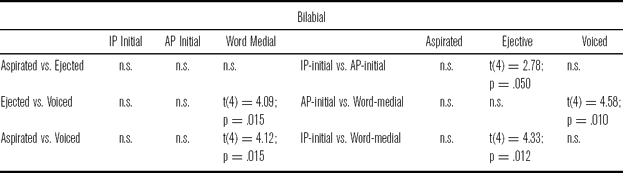
Mean burst frequency did not distinguish stop type at all places of articulation. There was a main effect of stop type only for alveolar stops and bilabial stops; however, for bilabial stops there was also an interaction between stop type and prosodic position. Bilabial and alveolar voiced stops had a lower mean burst frequency than either ejective or aspirated stops produced at the same place of articulation. For alveolar stops, this difference approached significance and for bilabial stops, the difference was significant, but only in word-medial prosodic position. Different velar stop types showed no difference in mean burst frequency. These results are partially consistent with Sundara (Reference Sundara2005), who found that voiced stops had lower mean burst frequencies than voiceless stops. Again, this is found in Georgian, but only for bilabial and alveolar stops. Average mean burst frequencies for the three stop types at alveolar and velar places of articulation are given in figure 5 and for bilabial stops in each prosodic position in figure 6.
Average mean burst frequency, given in Hz, for each stop type at alveolar and velar places of articulation.

Average mean burst frequency of bilabial stops for each stop type at each place of articulation.

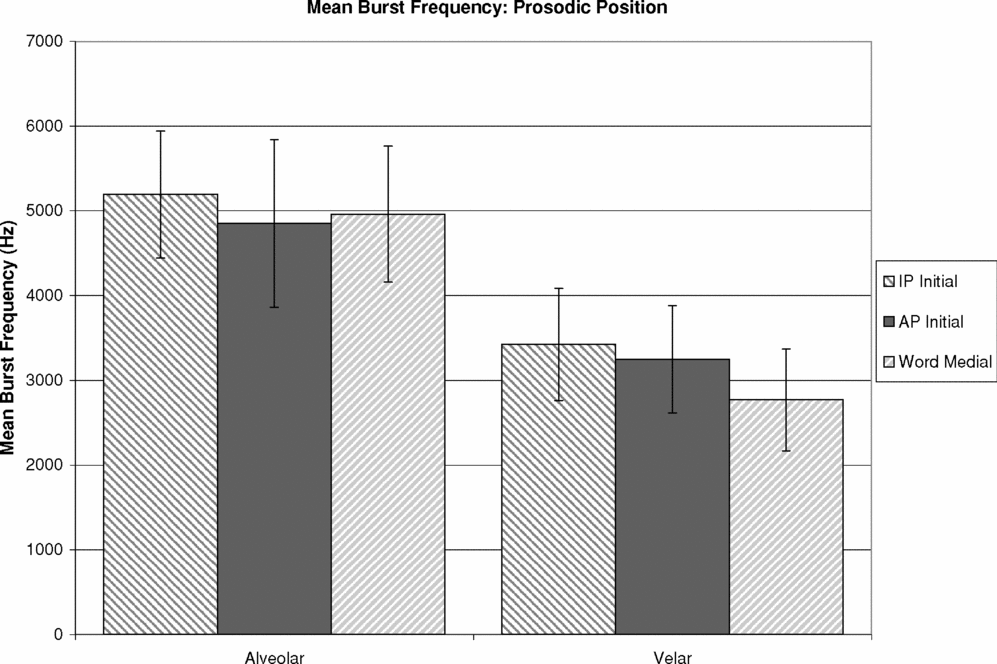
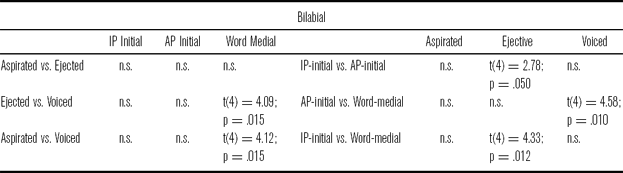
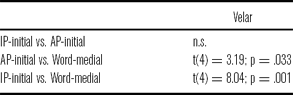
For alveolar stops, mean burst frequency did not differ across prosodic positions. There was a main effect of prosodic position, however, for velar stops, and again, there was an interaction between stop type and position for bilabial stops. All velar stops showed significantly lower mean burst frequencies in word-medial position than in higher prosodic positions. Bilabial voiced stops showed the same trend. Bilabial aspirated and ejective stops, on the other hand, showed higher mean burst frequencies in lower prosodic positions, but the differences were only significant for ejectives in IP-initial position. Mean burst frequencies for alveolar and velar stops in different prosodic positions are given in figure 7. Statistical results are given in tables 14–16.
Average mean burst frequency, given in Hz, in each prosodic position for alveolar and velar places of articulation.

Results from the RM-ANOVA conducted for mean frequency of the stop burst.

Post-hoc paired t-tests for mean burst frequency of bilabial stops.
Post-hoc paired t-tests for mean burst frequency of velar stops.
3.5.2 Skewness
Skewness is a measure of the symmetry of a distribution. Negative skew refers to a distribution whose mass is concentrated in the higher values and has a mean that is lower than the median. Positive skew refers to a distribution whose mass is concentrated in the lower values and has a mean that is larger than the median. In terms of burst frequency, a negative skew would imply more energy in higher frequencies than in lower frequencies, and a positive skew would imply the opposite.
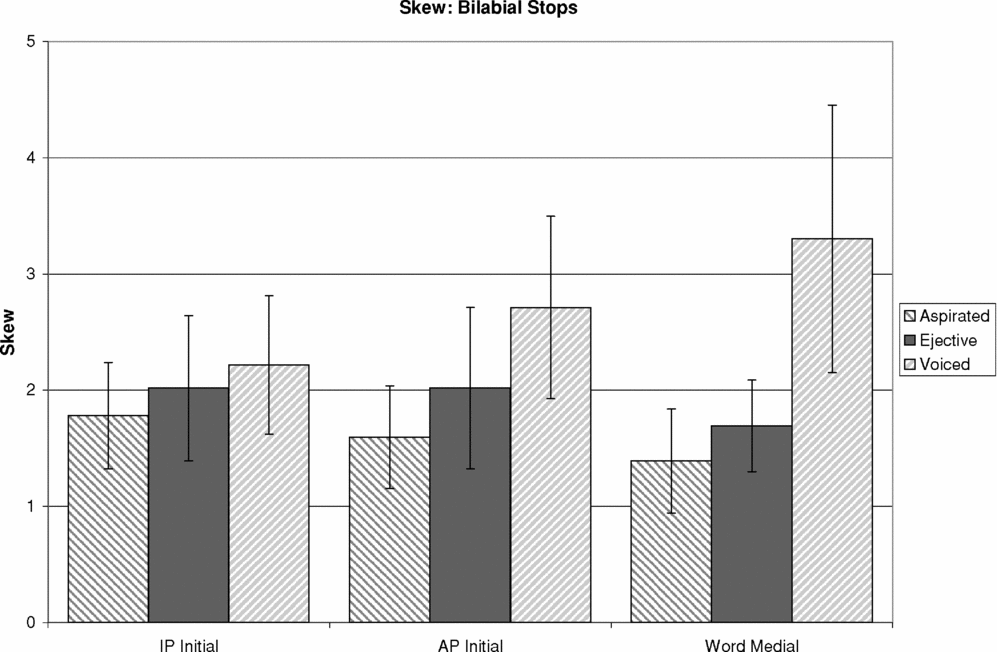
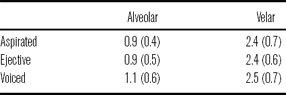
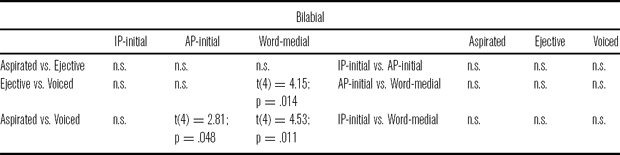
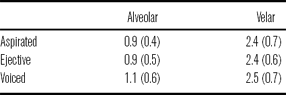
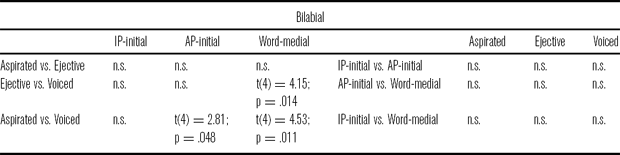
Burst skewness did not differentiate stop type at either the alveolar or the velar place of articulation. There was a main effect on skewness for bilabial stops, however, as well as a significant interaction between stop type and prosodic position. Voiced bilabial stops had more positive skew than either bilabial ejective or bilabial aspirated stops in all prosodic positions, although the difference was only significant AP-initially and word-medially. This implies more energy in frequencies below the mean than in frequencies above the mean. Average skewness for bilabial stops in each prosodic position is given in figure 8. Skew values for each stop type at alveolar and velar places of articulation are given in table 17.
Average skewness of bilabial stops for each stop type at each place of articulation.

Average skewness for each stop type at alveolar and velar places of articulation.
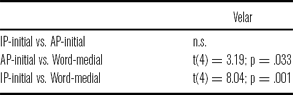
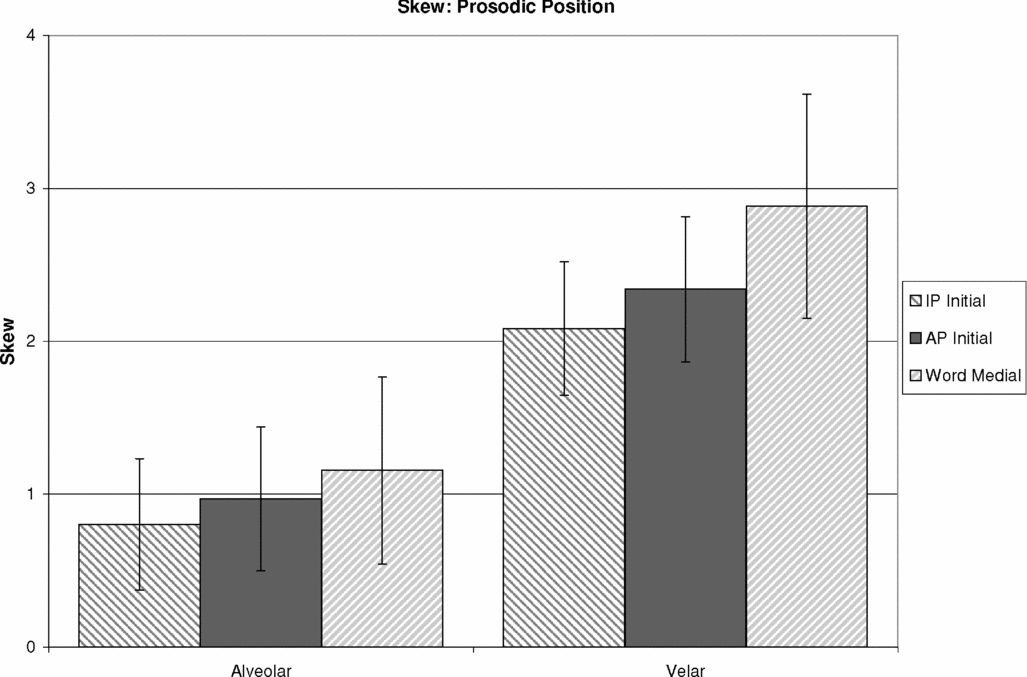
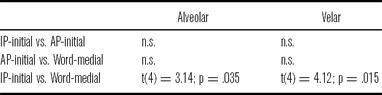
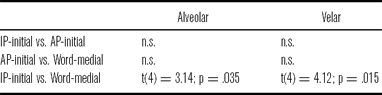
Both alveolar and velar stops showed more positive skew in lower prosodic positions, which suggests increased energy in frequencies below the mean relative to frequencies above the mean. Both places of articulation showed a main effect, although only the difference between IP-initial stops and word-medial stops was significant. Skewness at each prosodic position for alveolar and velar stops is given in figure 9. Statistical results are given in tables 18–20.
Average skewness in each prosodic position at alveolar and velar places of articulation.

Results from the RM-ANOVA conducted for skewness.

Post-hoc paired t-tests for skewness for bilabial stops.
Post-hoc paired t-tests for skewness for alveolar and velar stops.
3.5.3 Kurtosis
Kurtosis is a measure of the ‘peakedness’ of a distribution. In terms of burst frequency, higher kurtosis implies more energy in frequencies far from the mean. Lower kurtosis implies more energy in frequencies near the mean.
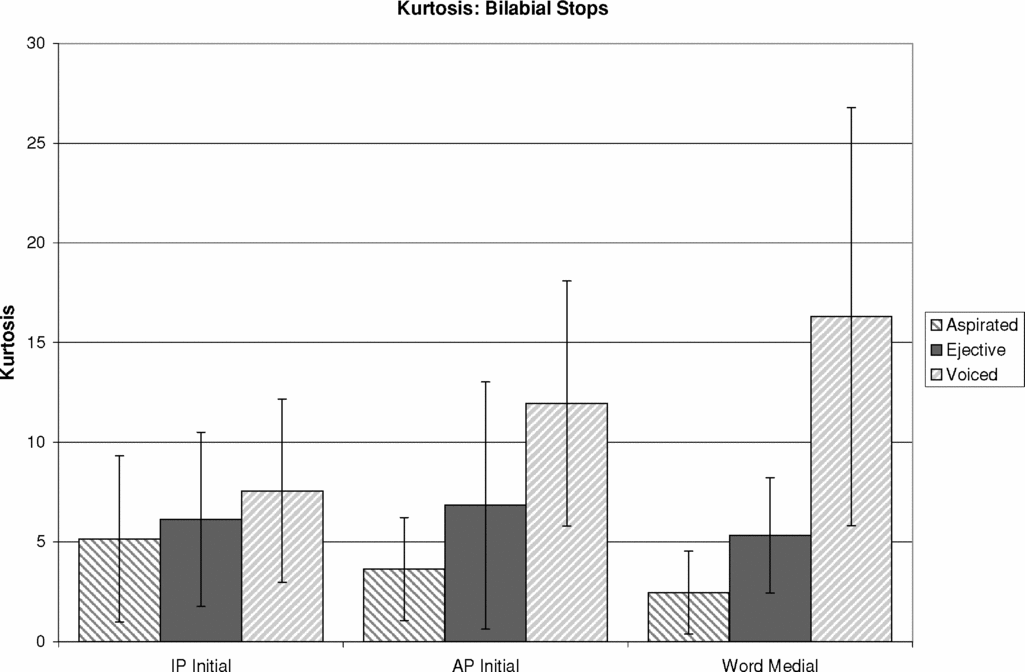
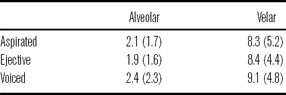
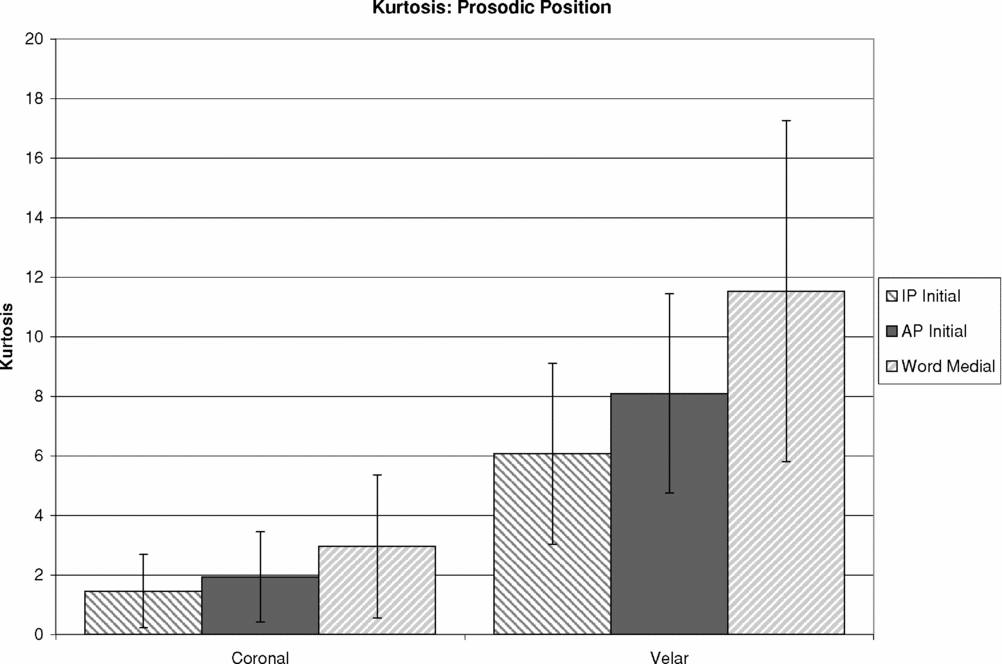
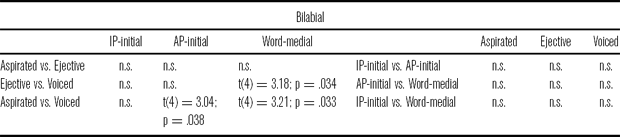
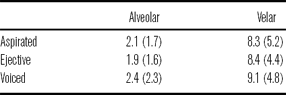
Results for kurtosis of burst spectra were similar to results for skewness. Stop types did not differ in kurtosis at either alveolar or velar place of articulation. There was, though, a main effect of stop type for bilabial stops, as well as a significant interaction between type and prosodic position. Voiced bilabial stops had greater kurtosis than either bilabial ejective or bilabial aspirated stops in all prosodic positions, although the difference was only significant AP-initially and word-medially. Average kurtosis for bilabial stops in each prosodic position is given in figure 10. Kurtosis values for each stop type at alveolar and velar places of articulation are given in table 21.
Average kurtosis of bilabial stops for each stop type at each place of articulation.

Average kurtosis for each stop type at alveolar and velar places of articulation.
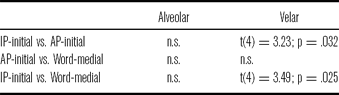
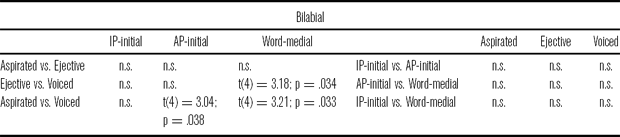
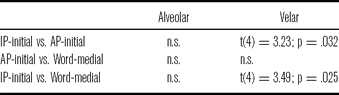
Both alveolar and velar stops showed increasing kurtosis of burst spectra in lower prosodic positions. Both places of articulation showed a main effect, although only velar IP-initial stops were significantly different. Kurtosis at each prosodic position for alveolar and velar stops is given in figure 11. Statistical results are given in tables 22–24.
Average kurtosis for each stop type at alveolar and velar places of articulation.

Results from the RM-ANOVA conducted for kurtosis.

Post-hoc paired t-tests for kurtosis for bilabial stops.
Post-hoc paired t-tests for kurtosis for alveolar and velar stops.
3.6 Phonation
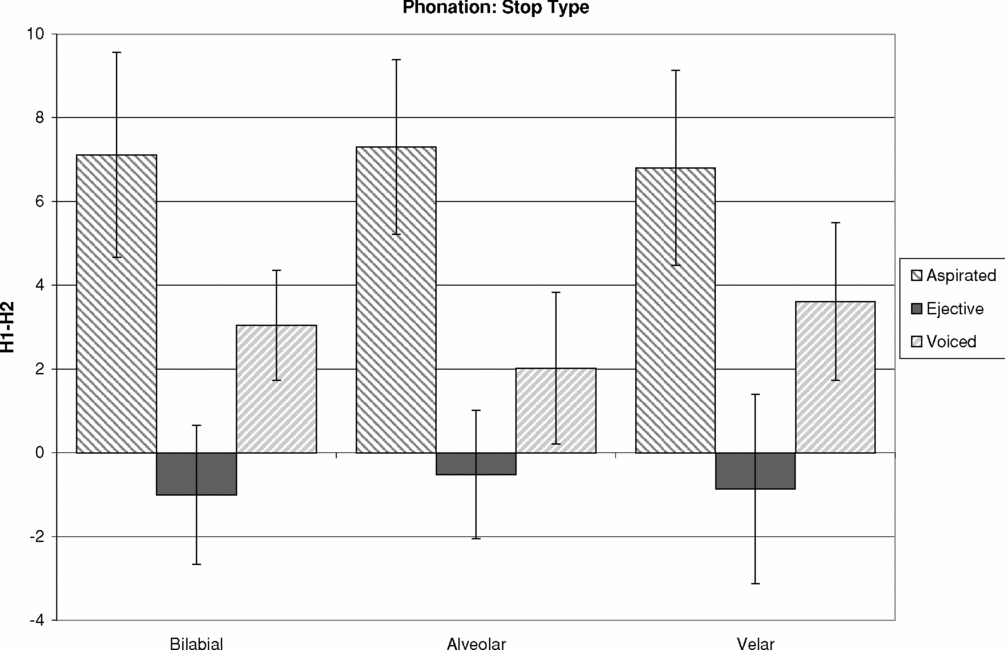
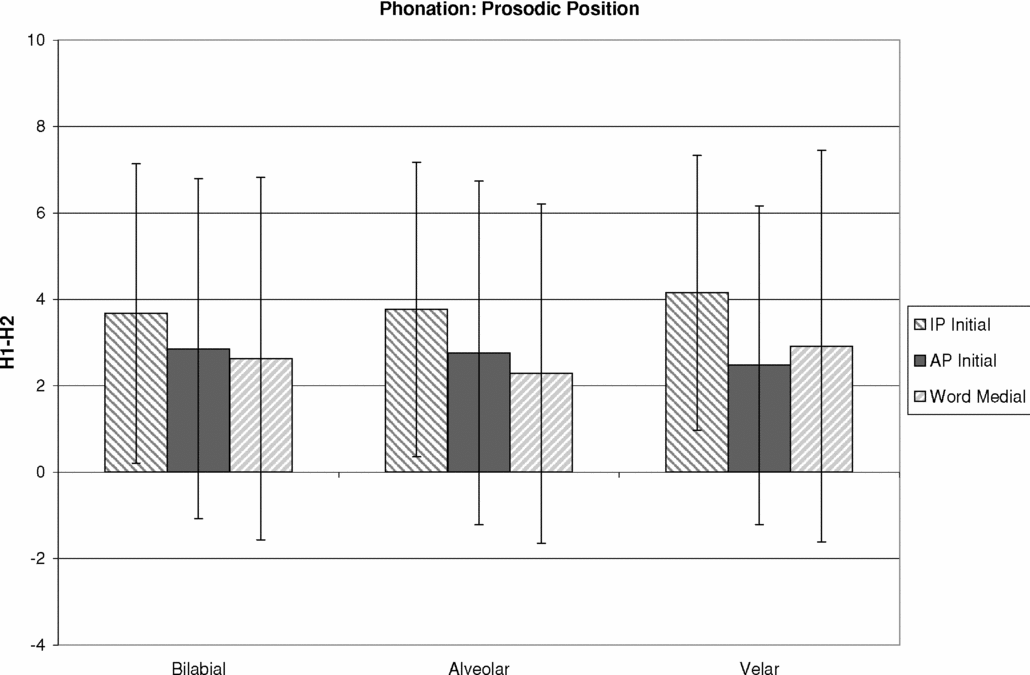
Phonation was expected to distinguish stop type in Georgian. In particular, ejectives were expected to be followed by relatively creaky phonation, based on the laryngealization heard by Robins & Waterson (Reference Robins and Waterson1952) and the fluctuations in voice pulse frequency observed by Wysocki (Reference Wysocki2004). Voiced and aspirated stops, on the other hand, were expected to be followed by vowels with more modal phonation. Indeed, there was a main effect of stop type at every place of articulation and the results generally fit the expected pattern, as can be seen in figure 12. Vowels following ejectives had a significantly lower H1-H2 value, or more creaky phonation, than vowels following either aspirated or voiced stops. Vowels following aspirated stops had a significantly higher H1-H2 value, or breathier phonation, than vowels following voiced stops.
Average H1-H2 values for each place of articulation and stop type.

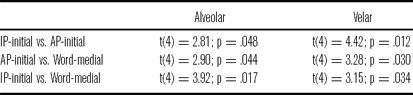
Vowel phonation following stops tended, in general, to be more breathy in higher prosodic positions than in lower prosodic positions, but there was only a main effect of prosodic position for alveolar and velar stops. Stops produced at the alveolar place of articulation follow the general trend. For velar stops, however, word-medial stops showed slightly breathier phonation than stops in an AP-initial position. But, both prosodic positions showed less breathy phonation than in IP-initial position overall. Average H1-H2 values at different prosodic positions are given in figure 13. Statistical tests are presented in tables 25–27.
Average H1-H2 values for each place of articulation at each prosodic position.

Results from the RM-ANOVA conducted for H1-H2.

Post-hoc paired t-tests for H1-H2 in stop type.

Post-hoc paired t-tests for H1-H2 in prosodic position.
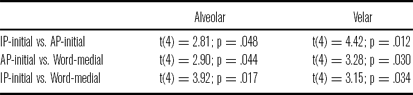
3.7 F0
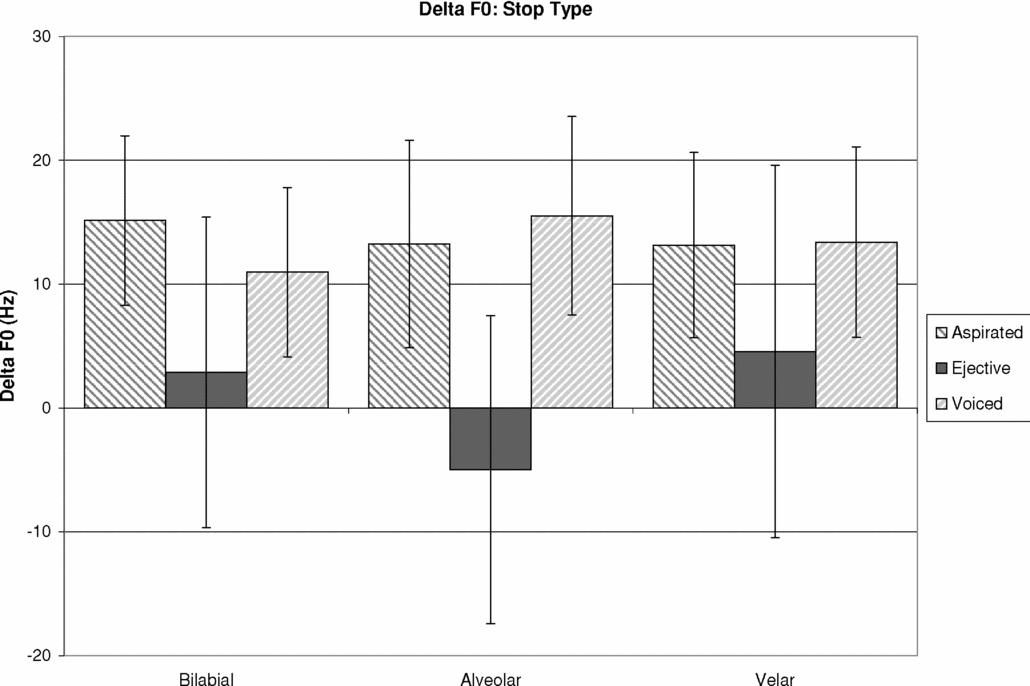
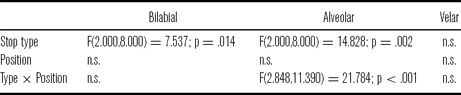
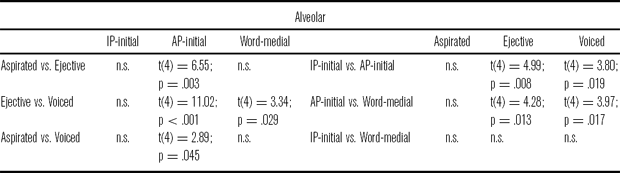
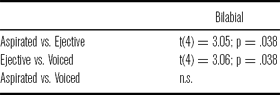
In general, F0 on vowels following both aspirated and voiced stops fell (ΔF0 = F0 at vowel onset – F0 at mid-vowel), while F0 following ejectives stayed relatively flat, as can be seen in figure 14. Despite this trend, there was a main effect of stop type only at the bilabial and alveolar places of articulation. For alveolar stops, there was also a significant interaction with prosodic position. There was no effect of stop type for velar stops. For bilabial stops, change in F0 significantly differentiated ejective stops from aspirated and voiced stops. For alveolar stops, change in F0 was only significantly different in AP-initial position, where it significantly distinguished all three stop types.
Average change in pitch, given in Hz, for each place of articulation and stop type.

The observed trend broadly fits with what was observed for Gitksan (Ingram & Rigsby Reference Ingram and Rigsby1987). In Georgian, women show relatively flat, or slightly falling F0 following ejectives. Slightly falling pitch was observed after ejectives produced by female speakers in Gitksan, as well. Witsuwit'en differs from Georgian in that, for most Witsuwit'en women, F0 rose after ejectives (Wright et al. Reference Wright, Hargus and Davis2002, Hargus Reference Hargus2007).
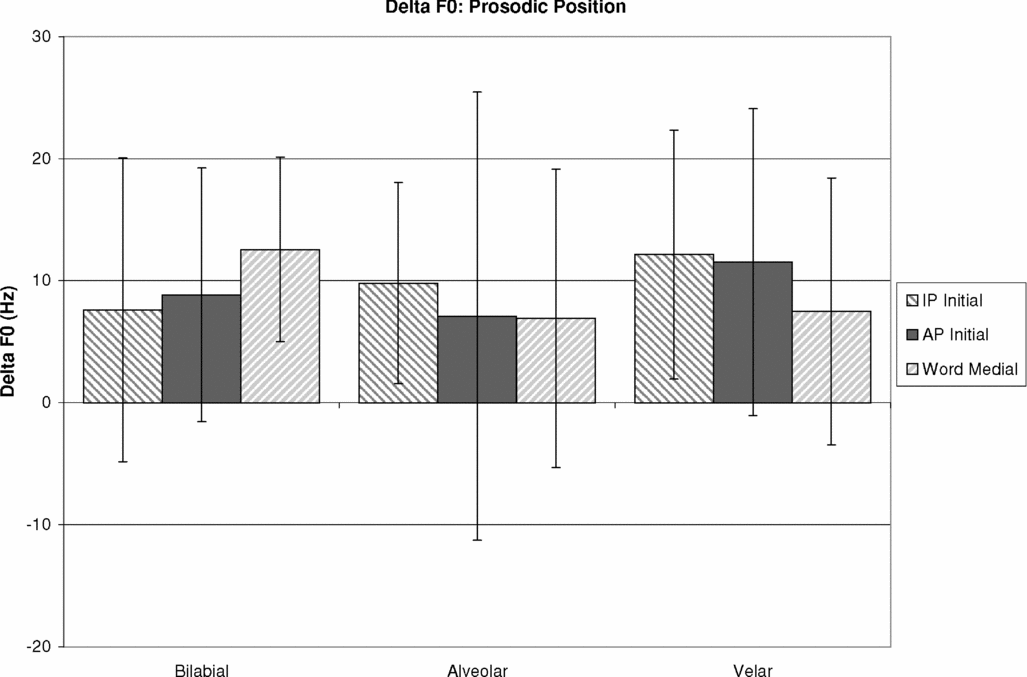
There are no clear effects of prosodic position on F0, as can be seen in figure 15. No place of articulation showed a significant effect of prosodic position, but for alveolar stops, there was a significant interaction between stop type and prosodic position. Alveolar voiced stops showed a significantly greater F0 fall on the following vowel in an AP-initial position than in either an IP-initial or word-medial position. Alveolar ejective stops showed a significantly greater F0 rise in an AP-initial position than in either an IP-initial or word-medial position. It is unclear what might cause this pattern, specifically why the F0 contours in AP-initial position are so extreme compared to IP-initial position. It does not appear to be caused by the intonational system of Georgian. As stated above, Georgian is an accentual phrase language. In a typical declarative, a word ends on a high boundary tone, and the pitch then falls to a low target on the initial stressed syllable of the falling word. This would create a falling F0 pattern, which might account for the pattern seen in alveolar voiced stops, but would not explain the greater rise seen in AP-initial position for alveolar ejective stops. Statistical results are given in tables 28–30.
Average change in pitch, given in Hz, for each place of articulation at each prosodic position.

Results from the RM-ANOVA conducted for change in pitch.
Post-hoc paired t-tests for change in F0 after alveolar stops.
Post-hoc paired t-tests for change in F0 after bilabial stops.
3.8 Evaluating the importance of acoustic measures for distinguishing stop type using discriminant analysis
Many of the acoustic measures examined in this study can be used to some degree to distinguish stop type, specifically, voicing lag, duration of voicing into the closure, H1-H2, F0 and burst spectral measures. A discriminant function analysis takes as input a set of cases for which group membership is known, and then generates a set of functions that use a set of predictor variables to provide the best discrimination between groups. The number of functions is equal to the number of group categories minus one. Once a set of functions is created, they can be used to classify new cases.
A discriminant analysis was conducted using the acoustic analysis results for 1400 stop tokens in either AP-initial or word-medial position (stops from the two prosodic positions were pooled together). IP-initial stops were excluded because they have no closure voicing measure. 37% were aspirated stops, 31% were ejectives, and 31% were voiced stops. These same tokens were then used as a test set for classification. All acoustic measures described above were input as predictor variables except for closure duration and relative burst intensity, which showed no differences in stop type. All measures were input together.
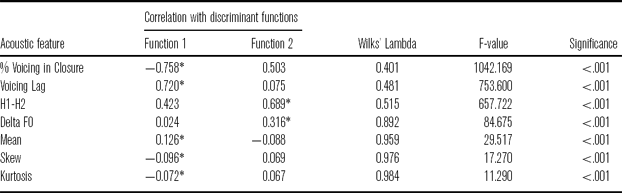
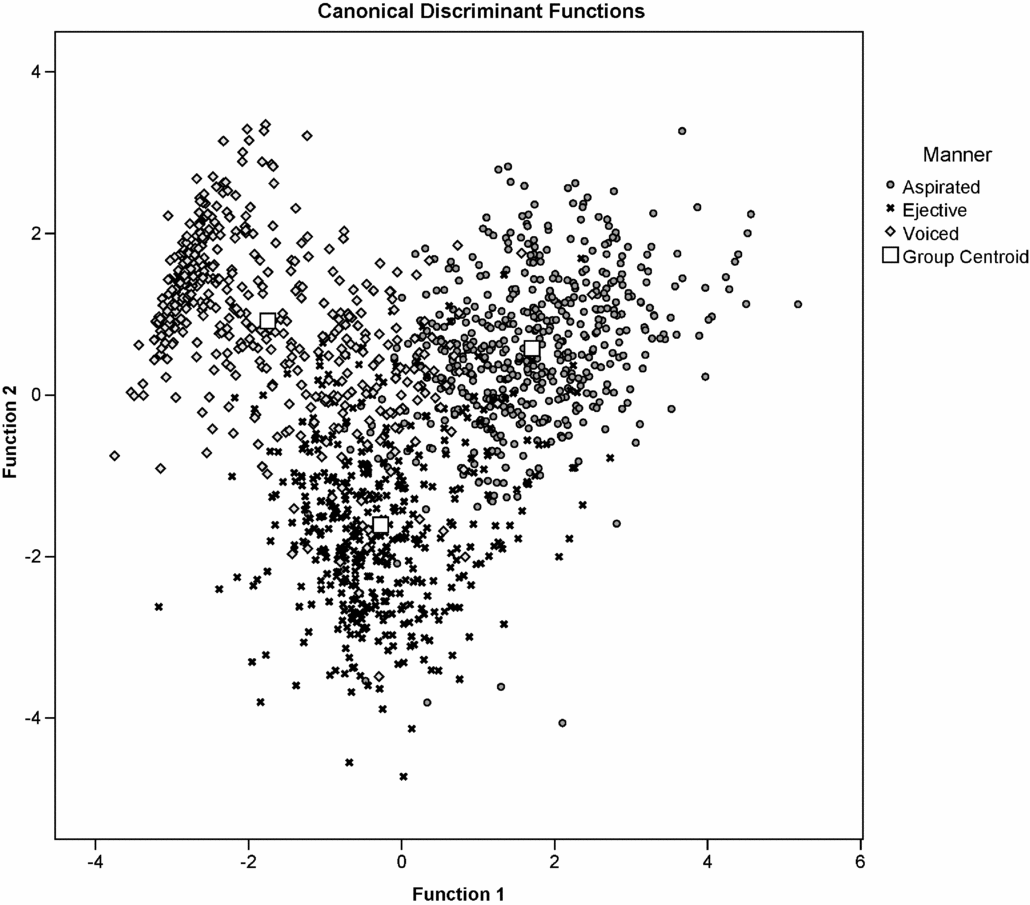
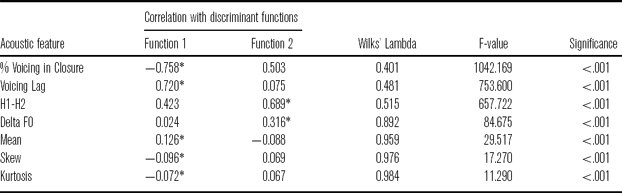
Results of the discriminant analysis are given in table 31. Because there are three stop types, two discriminant functions are computed. Each acoustic measure is assigned to the function with which it correlates highest (indicated by the asterisk in table 31). Each token is plotted in figure 16 according to the value assigned to it by each function.
Statistical results for the discriminant analysis. Largest absolute correlations between each variable and discriminant function are marked with an asterisk.
Scores of each token for the two discriminant functions.

It can be seen that the first function generally serves to discriminate voiced stops from aspirated stops. Duration of voicing into the closure and voicing lag have the highest correlation with function 1, followed by the measures of spectral moment. The second function generally serves to discriminate ejective stops from the pulmonic stops. H1-H2 and change in pitch correlate highest with function 2. Thus, ejectives are distinguished using glottal features, while pulmonic stops are distinguished using temporal and, secondarily, spectral features. It should be noted that closure voicing and H1-H2 correlate highly with both functions, suggesting they could potentially be used for a three-way distinction.
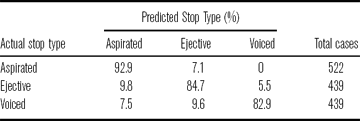
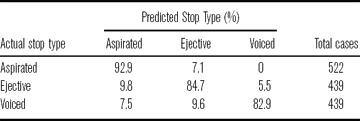
Classification results are presented in table 32. 87% of the original cases were correctly classified. Voiced and ejective stops are the hardest to classify correctly – 83% and 85%, respectively. Ejectives were more likely to be miscategorized as aspirated stops than as voiced stops. Voiced stops were about equally likely to get miscategorized as either an aspirated or ejective stop. Classification was better for aspirated stops, 93%. When aspirated stops were misclassified, they were misclassified as ejectives, not voiced stops.
Classification results using discriminant functions.
4 Discussion
Georgian has three stop types: voiceless aspirated, ejective and voiced. This study examined a number of acoustic features for each stop type in order to determine which acoustic features might best serve as a perceptual cue distinguishing stop phonation type. Also, acoustic measures were made for each stop type in three prosodic positions in order to examine the effects of initial strengthening on Georgian stops.
4.1 Possible cues to stop phonation type
Of the seven acoustic measures examined in this study, five are possible cues to stop type in Georgian. Georgian stop types were not different in closure duration or burst intensity, but did differ to some degree in voicing lag, voicing during the closure, burst spectral moments (mean, skew and kurtosis), phonation and pitch. Wysocki (Reference Wysocki2004) also showed that closure duration did not vary for different stop types in Georgian. She also observed that Georgian ejectives had louder bursts than voiced stops, but this observation is contradicted by the measurements made in this study. There was no statistical difference in relative burst intensity for any stop type.
Voicing lag was the only acoustic measure that significantly differentiated all three stop phonation types. Aspirated stops showed the most voicing lag, ejectives showed an intermediate voicing lag and voiced stops showed the least voicing lag. These results fit with the results from Wysocki (Reference Wysocki2004) and with the typologically common pattern seen in other languages. However, it seems unlikely that voicing lag could serve as a cue to stop type by itself. In higher prosodic positions, though statistically different, ejectives and aspirated stops showed very similar voicing lags, with average differences sometimes as small as 10 ms. Both fall within the aspirated stop VOT category in Keating (Reference Keating1984). Word-medially, ejectives and voiced stops showed very similar voicing lags, with average differences sometimes less than 15 ms. Both fall within the unaspirated stop VOT category in Keating (Reference Keating1984). Thus, it seems more likely that listeners might use voicing lag to distinguish one stop type from the other two, but not to distinguish all three.
Voicing into the closure showed a strong trend in differentiating all stop types, but only the voiced stops were significantly different at all places of articulation. Voiced stops showed significantly more voicing than either ejectives or aspirated stops. Both aspirated and ejective stops did show some voicing into the closure, though, confirming the observations in Robin & Waterson (Reference Robins and Waterson1952). Ejectives showed about 6–7 ms more voicing than aspirated stops. Stops only showed voicing into the closure when surrounded by vowels. In an IP-initial position, there was no voicing during the closure, except for a handful of voiced stops. Robin & Waterson also point this out. This suggests that the voiced stops in Georgian are probably phonemically voiced and likely become phonetically voiceless IP-initially due to the reduced subglottal pressure characteristic of that position. Such devoicing is common cross-linguistically and is observed in, for example, English (Keating Reference Keating1984). Intervocalically, voicing into the closure would be a good perceptual cue for discriminating voiced stops from either aspirated or ejective stops, as indicated by the results of the discriminant analysis. However, this cue would fail IP-initially, where voicing during the closure rarely occurs.
While normally used to cue place of articulation, previous research has suggested that measures of spectral moment might also distinguish between voiced and voiceless stops (Sundara Reference Sundara2005). In Georgian, bilabial voiced stops were distinguished from other bilabial stops in the spectral moments of their burst. Bilabial voiced stops had a lower mean burst frequency, and higher skewness and kurtosis values, especially in lower prosodic positions. Alveolar voiced stops also showed lower mean burst frequency, however, velar voiced stops do not. Neither alveolar nor velar stops showed any differences in skewness or kurtosis for different stop types. Because of these inconsistencies in place of articulation, burst spectral moments would likely serve as poor perceptual cues to stop type. Burst spectral moments were the lowest performing predictor variables in the discriminant analysis.
Ejectives appear to be best differentiated from aspirated and voiced stops in terms of the phonation and F0 on the following vowel. Ejectives were immediately followed by creaky phonation, marked by negative H1-H2 values, and relatively flat or slightly falling F0. Aspirated and voiced stops, on the other hand, were followed by more modal or breathy phonation and falling F0. Creaky or irregular phonation has been associated with ejectives in Georgian (Robins & Waterson Reference Robins and Waterson1952, Wysocki Reference Wysocki2004) as well as a number of languages, like Gitksan (Ingram & Rigsby Reference Ingram and Rigsby1987) and Witsuwit'en (Wright et al. Reference Wright, Hargus and Davis2002). The behavior of pitch following ejectives in Georgian is also similar to Gitksan, which showed slightly falling F0, at least for female speakers. Patterns in pitch following ejectives and pulmonic stops produced by female Georgian speakers are dissimilar to patterns observed in Witsuwit'en, for both male and female speakers (Hargus Reference Hargus2007). Men were not measured in this study. It would be interesting to see how male Georgian speakers pattern with regard to F0 following different stop types. Phonation and F0 seem to be promising cues in distinguishing ejective stops from aspirated and voiced stops, as indicated by the results of the discriminant analysis.
4.2 Initial strengthening
This study has shown that Georgian stops do show effects of initial strengthening. Two possible types of strengthening were proposed – paradigmatic enhancement, which would enhance the differences between stop phonation types in higher prosodic positions, and syntagmatic enhancement, which would simply make stops more consonant-like and less similar to the following vowel in higher prosodic positions. Only syntagmatic enhancement was found.
All stop types showed longer closure durations and longer voicing lags in higher prosodic positions. If Georgian showed paradigmatic enhancement in its initial strengthening, voiced stops should show shorter or unchanged voicing lags in higher prosodic positions, but this was not the case. Nor was there any increase in voicing during the closure for voiced stops in higher prosodic positions. In fact, the only stop that showed any change in percent voicing was the voiced velar /g/, which showed less voicing during the closure in AP-initial position than it did in word-medial position, making it more like a voiceless stop than enhancing the voicing contrast. Paradigmatic enhancement might also predict that phonation type contrasts in F0 and H1-H2 should be enhanced in higher prosodic positions. However, there was no effect of prosodic position on F0 following stops, and although phonation was affected by prosodic position, all stop types were generally affected in the same way. In general, all stops were produced with breathier phonation in higher prosodic positions than in lower positions, including ejectives, even though it seems that the creakier phonation following ejectives might serve as a good cue to stop type.
The effects of initial strengthening on burst features were less clear than on other acoustic measures. There was little effect of prosodic position on the burst intensity of aspirated and voiced stops. However, for ejectives, the burst was more intense in lower prosodic positions. This seems to be the opposite of initial strengthening. Stops are expected to be more strongly articulated in higher prosodic positions, which suggests, for ejectives, that oral air pressure should be higher phrase-initially than word-medially. A higher pressure should produce a louder burst. Instead, ejectives showed a louder burst word-medially. This is not due to the fact that burst intensity in this study is a relative measure. Absolute intensities were checked against these results and ejectives did indeed show more intense bursts word-medially. It is unclear what would cause this effect.
Different places of articulation showed varying patterns in how spectral moments of bursts were affected by prosodic position. Georgian alveolar stops showed no change in mean burst frequency, but they did show lower skewness and kurtosis values in higher prosodic positions. Velar stops showed higher mean frequencies, and also showed lower skewness and lower kurtosis values in higher prosodic positions. Bilabial voiced stops pattern with the velar stops. Bilabial voiced stops showed higher mean frequencies, lower skew and lower kurtosis in higher prosodic positions, while bilabial aspirated and ejective stops showed lower mean burst frequencies in higher prosodic positions and no changes in skew or kurtosis.
5 Conclusion
Georgian stops are affected by initial strengthening, and, in general, show a syntagmatic, rather than paradigmatic, strengthening pattern, that serves to make the stops more consonantal and more distinct from the following vowel rather than enhancing the phonation type contrast. All stops show longer closure durations, longer voicing lags, less voicing during the closure and higher H1-H2 values in higher prosodic position.
Although there might be a single acoustic cue that could distinguish all three stop types in Georgian, it seems more likely that listeners must depend heavily on at least two cues to identify stop type. The most likely cues include voicing lag, voicing during the closure, H1-H2 and F0. Which acoustic features listeners actually attend to, the relative importance of each, and their accuracy, can only be answered through perceptual studies. Identification and confusability studies are planned and should provide valuable information regarding the discrimination of ejectives and other stops in Georgian.
Acknowledgements
I would like to thank Patricia Keating, Sun-Ah Jun and Megha Sundara for their advice on this project, Manana Batashvili and Nana Dekanosidze for their help in the preparation of the recorded materials, and of the reviewers for their comments.
Appendix. Recording materials
Carrier phrase wordlist

Stories
Story 1
es zƔap'aria. iq'o da ara iq'o ra, iq'o ertʰi mokʰandak'e romelits sakʰartʰvelos mokʰalakʰe iq'o. igi ulamazes kʰandak'ebebs kʰmnida. mokʰandak'es hq'avda amxanegi, romelits dama erebeli tʰaƔlitʰi iq'o. znedatsemulma tʰaƔlitʰma tʰavi mokʰadaged gaasaƔa da gadats'q'vit'a tʰavads sts'veoda. t'adzarʃi ʃesvlistʰanave igi tʰavads ʃemdegi sit'q'vebitʰ daimukʰra, tʰu ʃen ar aƔiareb ʃen pʰarul pʰant'aziebs kʰaris kʰalƔmertʰis ts'inaʃe, kʰveq'anas dzlieri kʰariʃxali daat'q'deba, zƔvebi akʰapʰdeba da kʰalakʰi sapʰrtʰxeʃi
 avardeba-o. tʰavadi daetʰanxma, radganats igi daarts'muna mokʰadagis damaerebelma sit'q'vebma. damnaʃavem utʰxra tʰavads rom sat'axtʰo kʰalakʰis gamziritʰ gareubanʃi, nak'adultʰan mdebare agark'ze misuliq'o. p'arask'evs tʰavadi gaemgzavra agark'ze. p'at'ara kʰandak'eba ip'ova. t'anʃiʃveli kʰandak'eba dzalian lamazi iq'o. damnaʃave da mokʰandak'e imis uk'an imalebobdnen da tʰavads utʰvaltʰvalebdnen. tʰavadma gaando kʰaris kʰalƔmerts tʰavisi otsnebi rom mas surda ubralo p'arik'maxeri q'opʰiliq'o da ara gamoenili mepʰe. gamousts'orebelma tʰaƔlitʰma kʰalƔmertʰivitʰ xmitʰ am sit'q'vebitʰ up'asuxa, momit'ane xutʰasi kʰatʰami, xutʰasi t'axi da mravali gandzeuli. am p'irobis ʃesrulebis ʃemdeg gadzlev upʰlebas rom p'arik'maxeri gaxde. gantʰiadze tʰavadma kʰalƔmerts mout'ana is sagnebi rats man moitʰxova. damnaʃave da mokʰandak'e gamdidrdnen. tʰavadi k'i saq'vareli da p'at'ivsatsemi p'arik'maxeri gaxda.
Story 2
ts'amoidginetʰ rom sa’meli adamians hgavdes. t'adzarʃi sa’meli k'vebis ʃesaxeb ʃeists'avlida. k'arg sa’mels umsats ʃe’amdnen. p'ap'anakʰeba sitsxitʰ tsud sa’mels dasidnen. tʰapʰli kʰorts'ildebodes da ʃakʰari misi p'at'ardzali gaxdeboda. o, ra tʰapʰlobistʰve ikʰneboda! gargali q'velaze ’k'viani bavʃvi ikʰneboda sk'olaʃi. misi tʰanak'laseli pʰapʰa mtʰeli dƔe pʰanaraʃi gaimzireboda da iotsnebebda rom gemrieli q'opʰiliq'o. pʰapʰa meotsnebe ikʰneboda. k'apʰeʃi q'ava darai ideboda imit'om rom mas arasdros ar sdzinavs. t'anadi k'art'opʰili k'arakʰʃi itsuravebda. mdidari bat'k'ani pʰasdaudebel pʰaipʰuris sinze dabrdzandeboda. p'at'ara dak'arguli up'at'rono bali q'ovel ʃabats tʰavisi baƔis dzebnaʃi ikʰneboda. bali dzalian mart'oxela ikʰneboda. kʰatʰami k'anonmdebeli gaxdeboda. tʰu k'arg k'anons gamouʃvebda, igi q'velas eq'vareboda. tʰu gadasaxads gazrdida, mas t'abak'ad gadaakʰtsevdnen. kʰarapʰʃut'a p'avidlo msaxiobi gaxdeboda. k'ak'ali t'ak'imasxara gaxdeboda. dabali t'arxuna t'anmaƔali arasdros gaizrdeboda, imit'om rom t'arxuna tsot'ats sak'marisia. o, exla k'i madaze movedi.
Story 3
bat'oni k'axas agarark'i ulamazoa. pʰardagi mts'vanea. pʰardebi iasamnispʰeria. tʰaroebi k'alisganaa gak'etʰebuli. kʰandak'ebebi utʰavoa. k'alatʰebi nagvitʰaa savse. k'arada k'epʰalis pʰeria. pʰanrebi mrgvalia. k'arebits aseve. balaxi gamxmaria. baƔʃi up'at'rono k'at'a tʰagvs misdevs. bat'on k'axas sisupʰtʰave ar uq'vars. aravin iƔebs dap'at'iʒebas agarak'ze bat'on k'axasgan radganats agarak'i asetʰi uʃnoa. garegnova saxe mniʃvnelovania.