1. INTRODUCTION
Global navigation satellite systems (GNSS) are becoming a primary source of position, navigation and timing applications in a variety of fields and have a big user base (Ioannides et al., Reference Ioannides, Pany and Gibbons2016; Psiaki and Humphreys, Reference Psiaki and Humphreys2016). GNSS signals are vulnerable to environmental effects, interference, jamming and spoofing due to their low power and open signal structure (Juang, Reference Juang2009; Huang et al., Reference Huang, Lo Presti, Motella and Pini2016). Navigation and timing services can be easily interrupted by interference or jamming, or misled by a spoofer through counterfeit signals. An intermediate spoofing attack that leverages a genuine signal in space to create counterfeit signals, transmitted from a single antenna, is the preferred method for the attacker because it does not break the receiver tracking loop lock on the signal and, as a result, does not panic the user. The spoofer produces a misleading signal that replicates the structure of an authentic signal to deceive the user. However, the basic problem for the spoofer is to break the lock of the user receiver tracking loop from the authentic signal and make it lock on the counterfeit signal generated by the spoofer, without alerting the user. In order to do this, the spoofer has to follow a sequence of initial operations to launch the intermediate spoofing attack (Humphreys et al., Reference Humphreys, Bhatti, Shepard and Wesson2012). This sequence includes getting the signal parameters at user position, starting the attack by hiding the spoofing signal under the authentic signal and then dragging the spoofing signal away from the authentic signal to complete the attack (Humphreys et al., Reference Humphreys, Bhatti, Shepard and Wesson2012).
The study of spoofing techniques and their mitigation is therefore an active area of study. Jafarnia-Jahromi et al. (Reference Jafarnia-Jahromi, Broumandan, Nielsen and Lachapelle2012) provide a classification of known spoofing techniques, while Ioannides et al. (Reference Ioannides, Pany and Gibbons2016) and Psiaki and Humphreys (Reference Psiaki and Humphreys2016) provide thorough coverage of spoofing attacks and mitigation techniques. Of many classes of technique discussed in Jafarnia-Jahromi et al. (Reference Jafarnia-Jahromi, Broumandan, Nielsen and Lachapelle2012), signal quality monitoring (SQM) is the one technique that has been used by many researchers including Cavaleri et al. (Reference Cavaleri, Motella, Pini and Fantino2010) and Ali et al. (Reference Ali, Manfredini and Dovis2014). SQM techniques are effective during the phase of spoofing where the distortion due to the availability of the authentic and the counterfeit signal is significant. Likewise, there are other SQM techniques like delta metric, early-late phase metric, magnitude difference metric, etc. (Wesson et al., Reference Wesson, Shepard, Bhatti and Humphreys2011). Each of these SQM techniques uses a combination of the correlator outputs or measurements and threshold/detection test to detect abnormality on account of multipath, spoofing, signal integrity, satellite failure, etc.
A set of SQM metrics based on normalised auto-correlation function (ACF) shape was proposed by Phelts et al. (Reference Phelts, Walter and Enge2003). Here the author endeavoured to devise a reliable method for determining a set of SQM metrics for evil waveform detection. The paper describes a flexible, straightforward and quantitative approach to computing a set of highly-effective detection metrics, for the real-time SQM monitoring of the wide area augmentation system (WAAS) signal. The metrics described in the paper contain polynomial fit metrics that use the least squares method to fit linear and quadratic polynomials to the ACF. The method described in Phelts et al. (Reference Phelts, Walter and Enge2003) for linear fit has been used to find the slope of the ACF in this study.
The present paper discusses a method based on slope metric that calculates the slope of ACF at the tracking point to obtain a signal quality metric that is sensitive to distortion in the ACF due to spoofing. The slope metric technique is based on the work of Townsend and Fenton (Reference Townsend and Fenton1994) and Phelts et al. (Reference Phelts, Walter and Enge2003), which primarily addresses multipath and evil waveform detection issues. The technique uses normalised ACF for metric formulation. The normalisation of the measurement correlator using a tracking correlator is done in many SQM metrics (Pirsiavash et al., Reference Pirsiavash, Broumandan and Lachapelle2017). The normalisation by a tracking correlator gives an advantage in comparing the metric values. However, in fading channels when the direct signal is obstructed, such normalisation could lead to changes in the noise level of the signal (Alonso-Arroyo et al., Reference Alonso-Arroyo, Querol, Lopez-Martinez, Zavorotny, Park, Pascual, Onrubia and Camps2017). Such situations may be detected by measuring the carrier to noise density ratio (C/N0) of the signal and the decision-making process could be stopped when C/N0 drops below a certain level.
The results of the slope based detector are compared with some recent studies in which the results are reported quantitatively (Wang et al., Reference Wang, Li and Lu2017; Wesson et al., Reference Wesson, Gross, Humphreys and Evans2018; Gross et al., Reference Gross, Kilic and Humphreys2019) and using the similar dataset in their studies. The spoofing detector reported by Wang et al. (Reference Wang, Li and Lu2017) had a better detection rate than the proposed combination detector for only case 2 of TEXBAT; however, a complete comparison remains challenging because the numerical value of probability of false alarm (PFA) is not reported in the results. Wesson et al. (Reference Wesson, Gross, Humphreys and Evans2018) have given simulation results for their PD detector and the experimental results using TEXBAT cases except for case 7 where it uses a combination of symmetric difference metric and power measurement for classification of environment as clean, multipath, spoofing and jamming. Gross et al. (Reference Gross, Kilic and Humphreys2019) improved upon the Wesson's work using the maximum-likelihood estimator to estimate the authentic signal parameters. It can be seen here that the combination detector performs equally well. If compared with legacy SQM detectors, etc. the proposed detector can easily outperform them, as these detectors use legacy tracking correlator outputs and Doppler measurement. Advanced spoofers, however, generate an attack in such a way as to disturb the Doppler and tracking correlator as little as possible and for a very short period of time.
The proposed method is found to be effective in the pull-off phase, which is the time when the delay between the spoofing and authentic signals is significant. The technique is also found to be effective in matched power as well as over-powered cases.
2. BACKGROUND
A spoofer is a device capable of generating a signal similar to an authentic satellite signal that can deceive the victim receiver in such a way that it deduces an incorrect position, time or both. A detailed study of spoofing is presented below to understand how spoofing can be detected.
2.1. Classification of spoofing attack
Spoofing attacks through the generation of satellite signals can be classified as simplistic, intermediate or sophisticated based on the complexity of the spoofer (Humphreys et al., Reference Humphreys, Ledvina, Psiaki, O'Hanlon and Kintner2008). A simplistic attack is conducted through a satellite simulator that is not synchronised to the current user environment. The intermediate and sophisticated spoofer uses a receiver to obtain the current satellite signal state and produce an output in synchronisation to the situation at the user receiver. An intermediate attack is launched through a single transmitter and can be detected through the angle of arrival discrimination methods. A sophisticated attack can be launched through multiple transmitters to overcome the victim's defences using the angle of arrival discrimination (Humphreys et al., Reference Humphreys, Ledvina, Psiaki, O'Hanlon and Kintner2008).
2.2. Details of the intermediate attack
An intermediate spoofing attack uses a GNSS receiver to estimate the critical parameters, such as frequency, code phase and amplitude, during the alignment phase. These parameters are required in order to match the counterfeit and genuine signal, so that both signals appear as one in the target receiver correlation function. Separate parameters for each satellite are estimated to generate the data stream for each satellite. All data streams are combined and adjusted for power and then transmitted (Humphreys et al., Reference Humphreys, Bhatti, Shepard and Wesson2012). After the alignment phase, the counterfeit signal power is increased to control the tracking loops of the target receiver. The counterfeit signal is then steered away from the authentic signal by changing the code phase (Humphreys et al., Reference Humphreys, Bhatti, Shepard and Wesson2012). This process is called pull-off, and generates ACF distortion. When the pull-off phase is complete and the receiver is locked on the spoofed signal, away from the genuine signal, the phase is known as the capture phase. The spoofer now has complete control over the target receiver (Humphreys et al., Reference Humphreys, Ledvina, Psiaki, O'Hanlon and Kintner2008). Table 1 provides an overview of the spoofing sequence of each phase in the TEXBAT data (Humphreys et al., Reference Humphreys, Bhatti, Shepard and Wesson2012).
Phases of intermediate spoofing sequence and spoofing status.

2.3. Dataset
To evaluate the slope metric publicly available datasets and independent field recordings were used.
2.3.1. Spoofing dataset
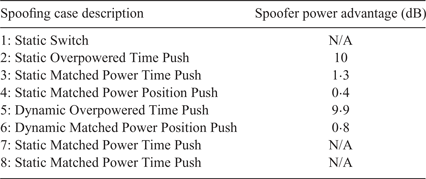
The spoofing dataset was comprised of the TEXBAT dataset and the synthetic spoofing data (Khan et al., Reference Khan, Iqbal and Khan2018). TEXBAT is the battery of recorded spoofing cases compiled by researchers at the University of Texas, Austin. It includes clean static and dynamic cases and eight spoofing attack cases datasets. Table 2 provides a description of the spoofing cases and the spoofer power advantage. Spoofer power advantage is the ratio of the power of the spoofing signal to the authentic signal as seen by the target receiver. In order to generate spoofing cases, corresponding clean cases have been replayed using a vector signal generator (VSG). The output of the VSG has been split and one part is given to the receiver inside the spoofer to extract the required parameter and the other part is combined with the output of the spoofer to make the spoofing signal. The combined signal is recorded using vector signal analyser (VSA), with a bandwidth of 20 MHz, and digitised as complex 16-bit samples at a rate of 25 MSps (Humphreys et al., Reference Humphreys, Ledvina, Psiaki, O'Hanlon and Kintner2008).
Summary of TEXBAT cases.

2.3.2. Non-spoofing dataset
The non-spoofing dataset comprised of clean TEXBAT data, RNL Multipath War-drive data (Wesson et al., Reference Wesson, Shepard, Bhatti and Humphreys2011), and data recorded in the field.
The RNL multipath and interference data contains static and dynamic cases in both light and dense urban environments around Austin, Texas. It exhibits mild-to-severe multipath and mild unintentional interference. The data is quantised in 16 bit and the recording is cantered at 1575·42 MHz (GPS L1) and at a complex sampling rate of 37 MSps.
The data acquired from the field consists of clean and multipath affected recordings using commercial satellite signal recorders. The signal recorders used have either MAX2769 Front-end, with complex sampling rate of 16·368 MSps, with IF of 4·092 MHz or NT1065 Front-end with sampling rate of 53 MSps, with IF of 14·58 MHz. The signal recorders were equipped with TCXO with an accuracy of about ± 5 × 10⁻⁷ s/s. The data has been logged in clean, obstruction-free places as well as in urban places where high multipath and mild unintentional interferences were present.
2.3.3. Pre-processing
During the pre-processing phase, the data samples that have C/N0 below 28 dB-Hz have been removed from the dataset, to avoid normalisation issues that may occur under low signal-to-noise ratio. The choice of minimum C/N0 of 28 dB-Hz (Kaplan and Hegarty, Reference Kaplan and Hegarty2005) eliminates most of the samples that can produce false alarm due to low signal strength while not affecting the detection in the receiver in tracking state under nominal conditions.
3. PROPOSED SLOPE BASED METRICS
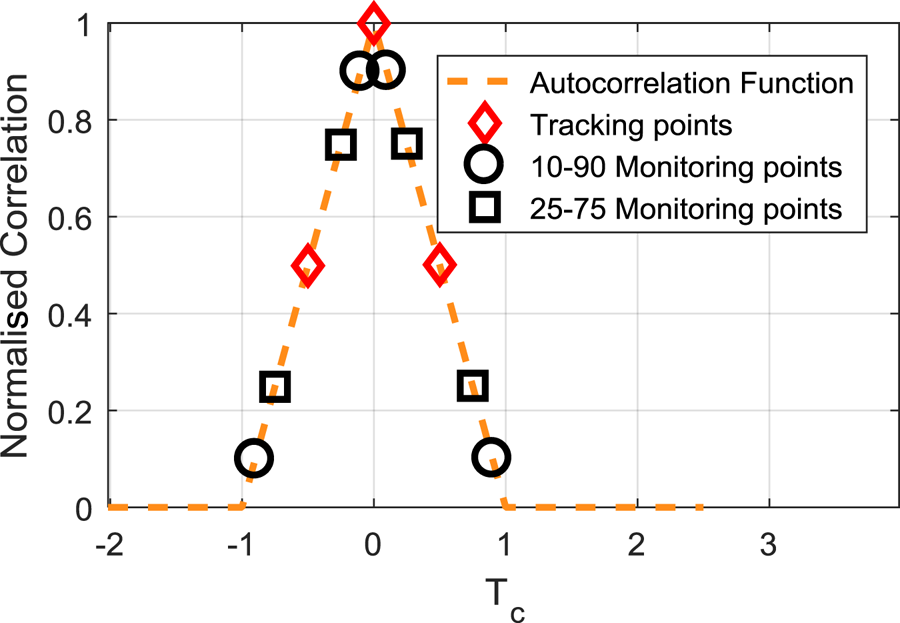
Quality monitoring is a process of measuring of the difference between the available or measured and the desired results. SQM techniques are based on either an observation of the measured ACF distortion or modelled characteristics of measured noise (Mitelman et al., Reference Mitelman, Phelts, Akos, Pullen and Enge2000). The goal of slope based spoofing detection technique is to measure the signal quality by analysing the slope of ACF. A legacy receiver has three coherent tracking correlators for each channel. However, the SQM receiver uses additional monitoring correlators for computing metrics (Phelts et al., Reference Phelts, Walter and Enge2003). These monitoring correlators are linked to the tracking correlators and are at a specified distance from them. These monitoring correlators are used to measure slope metric value. Figure 1 depicts two different pairs of monitoring correlators along with tracking correlators. In the current section, a discussion on slope based metrics is presented.
Tracking and monitoring correlators used to track and capture the slopes on a normalised ACF.

3.1. Mathematical model of ACF
After passing through the front-end and baseband section, a signal from a satellite, its reflection and the spoofing signal are accumulated for integration time, T. The accumulated value is an instantaneous measured ACF, given by
 $$\left[ {{\begin{array}{@{}c@{}} {I_{\tau_i } } \\ {Q_{\tau_i } } \end{array} }} \right]=\sum _{n=0}^{N-1} \left[ {\sum_{\rm s} \mbox{a}_{\rm s} d( {n+\tau_s } )c( {n+\tau_s } )e^{j( {2\pi f_{IF} n+\phi_s } )}+\mbox{N}_{\rm o} ( \mbox{n})} \right]c( {n+\tau _i } )e^{-j( {2\pi f_{IF} n} )},$$
where subscript ‘s’ is used for different delayed versions due to spoofing or multipath and subscript ‘i’ is used for different correlators. as is amplitude of sth form of signal, c(n) is locally generated replica PRN code and  $e^{-j( {2\pi f_{IF} n} ) }$ is the locally generated replica carrier, τ i is the delay between locally generated code sequence and the received code for the ith correlator. τ i = 0 for the prompt correlator. N is the number of samples in integration time T and is defined as N = f c. T, where f c is the analog-to-digital conversion sampling rate.
 $e^{j( {2\pi f_{IF} n} ) }$ is transmitted carrier, ϕ s is transmitted carrier phase for sth version of signal, τ s is the delay of sth signal from the direct signal.
After rearranging and simplification, the accumulated value in the in-phase branch of the correlator becomes
 $$I_{\tau _i } =\sum _{s=0}^{M+1} \mbox{a}_{\rm s} \cos( {\phi _s } )R( {\tau _i -\tau _s })+N_{\tau _i },$$
where there are M multipath signals, a direct and a spoofing signal are assumed to be present,  $N_{\tau _{i} } $ is the noise components after accumulation, R() is an ideal ACF of GPS C/A code that is defined as
 $$R( \tau )=\sum_{n=0}^{N-1} c( n)c( {n-\tau }),$$
The ideal ACF is approximately equal to the following (Kaplan and Hegarty, Reference Kaplan and Hegarty2005)
 $$R( \tau )=\left\{ {{\begin{array}{@{}l@{\quad}l@{}} {\mbox{N}\left[ {1-\displaystyle\frac{\left| \tau \right|}{\mbox{T}_{\rm c} }} \right]}& {\mbox{for }| \tau |\le \mbox{T}_{\rm c} } \\ 0 & {\mbox{otherwise}} \\ \end{array} }} \right\},$$
The ideal ACF has the shape of a triangle as given in Figure 1.
3.1.1. Slope calculation
Using the method given in Phelts et al. (Reference Phelts, Walter and Enge2003), the slope of an ACF can be calculated using the least square method by solving the following equation, which estimates the slope (M s) and y-intercept (I y) in the least square sense
 $$\left[ \begin{matrix} \tau_0 & 1 \\ \tau_1 & 1 \\ \tau_2 & 1 \\ \end{matrix} \right]\left[ \begin{matrix} M_S \\ I_y \\ \end{matrix} \right]=\left[ \begin{matrix} \tilde{\rm I}_{\tau_{0}} \\ \tilde{\rm I}_{\tau_{1}} \\ \tilde{\rm I}_{\tau_{2}} \end{matrix} \right]$$
where  $ \tilde{\rm I}_{\tau_{i}} = {\rm I}_{\tau_{i}}, \; \tau _{0} , \; \tau _{1}$ and τ 2 are selected delays for calculating the slope.
However, if τ 1 is at the centre point between τ 0 and τ 2, it can be shown from Equation (5) that the slope can be calculated by the following equation
 $$M_S ( \tau _0 ,\tau _2 )=\frac{\tilde{\rm I}_{\tau_{2}}-\tilde{\rm I}_{\tau_{0}}}{\tau_2-\tau_0}=\frac{{\rm I}_{\tau_{2}}-{\rm I}_{\tau_{0}}}
{{\rm I}_{0}[\tau_2-\tau_0]}$$
where τ 0 and τ 2 can have any values and the τ 1 is the mean value of τ 0 and τ 2.
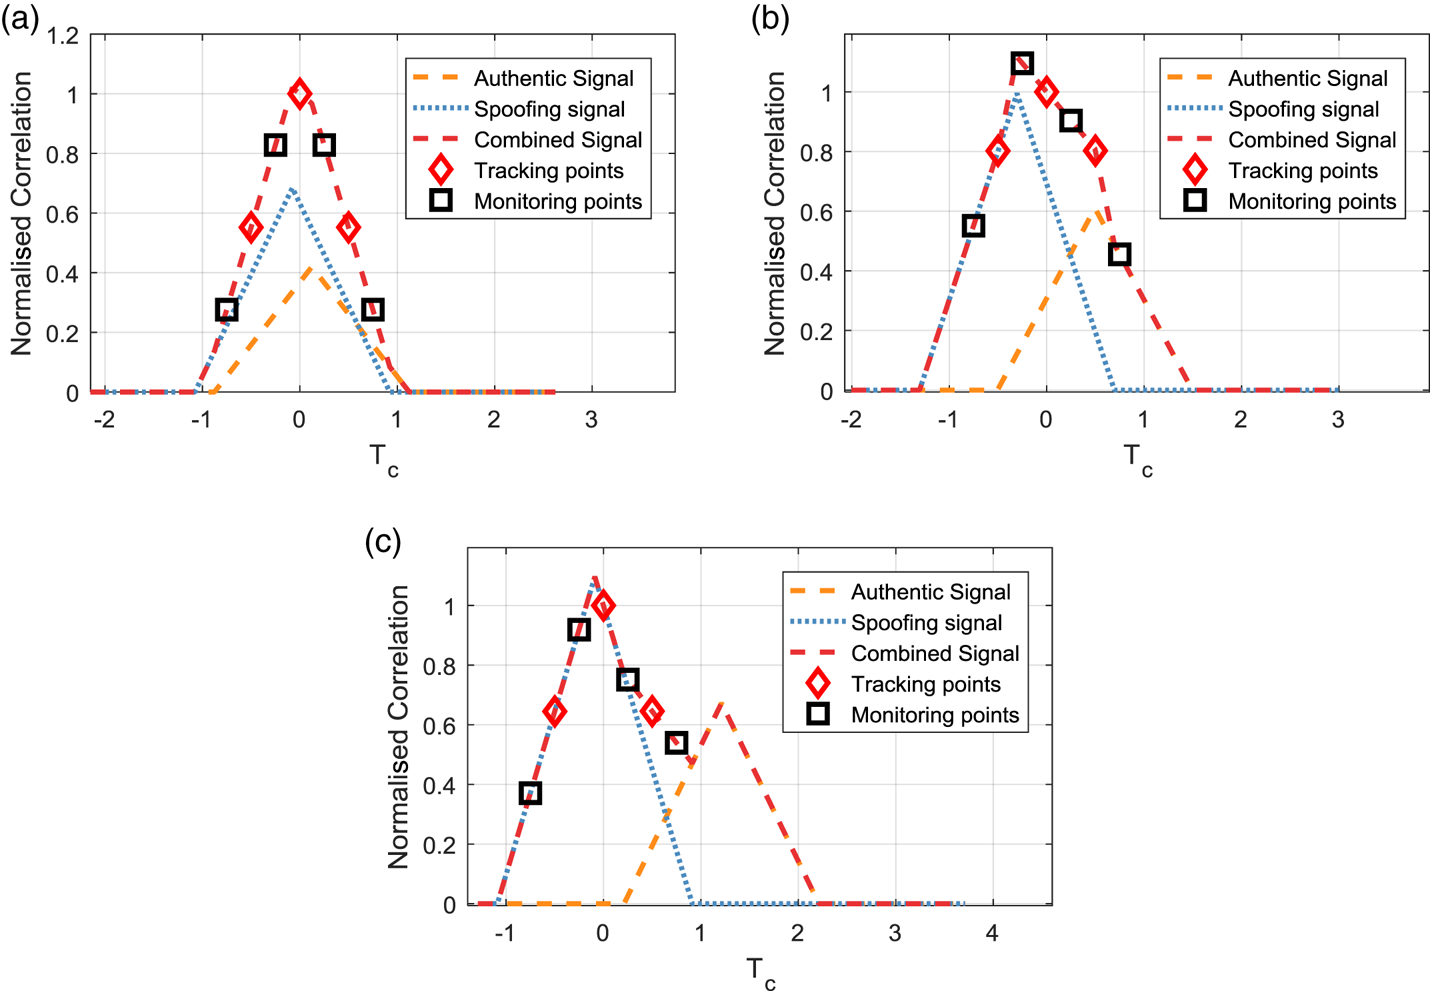
In order to understand the effect of multipath or spoofing, a direct and counterfeit signal is simulated with fixed spoofer power advantage and different time delays between the spoofing and authentic signal. The slope on the early and late side of the prompt tracking point is calculated using Equation (6). Figure 2 depicts the constituent signals ACF, the combined signal ACF, the tracking points and monitoring points at 25% and 75% of chip period (0·25T c and 0·75T c) on the ACF. The spoofer power advantage considered here is 0·8 dB corresponding to the matched power case. The tracking results are shown for delays of 0·2, 0·8 and 1·3 chips between the two signals. It can be observed that the slope value changes as the delay between the signal changes.
Slope of ACF at 25% and 75% of the tracked chips on both sides of the prompt tracking point, for spoofer power advantage of 0·8 dB: (a) the distortion in ACF is very low when the spoofing signal is 0·2 chip away from the authentic signal and slope values are not affected significantly, (b) spoofing signal is 0·8 chip away from the authentic signal due to which slope value has changed significantly, and (c) shows the spoofing signal as 1·3 chips away from the authentic signal due to which the slope value has changed drastically.

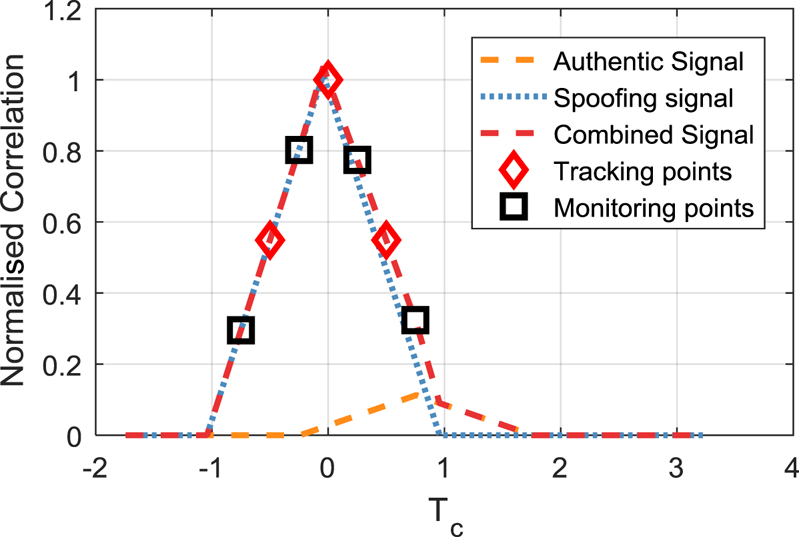
Figure 3 shows the same receiver parameters as shown in Figure 2, for the spoofer power advantage of 9 dB that corresponds to overpowered cases. It can be observed here that with such high spoofer advantage, there is little change in slope value of the measured ACF.
Slope of ACF between 25% and 75% of the tracked chips on both sides of the prompt tracking point, for spoofer power advantage of 9 dB and spoofing signal as 0·8 chips away from the authentic signal.

3.2. Metric formulation
The choice of placement of monitoring correlators is a critical factor in metric formulation. Noise will be enhanced if the monitoring correlators are very close to each other, because of the factor of τ 2 − τ 0 in the denominator of the Equation (6). To make a reasonable separation, the monitoring correlators used in this study are at 10%–90% and 25%–75% of the chip period.
Equation (6) can be used to calculate early and late side slopes, where M s( − τ 1, − τ 0) produces early slope value and M s(τ 1, τ 0) produces late slope value for (τ 0, τ 1) monitoring correlators. In order to find an effective metric for spoofing detection, several metrics have been formulated consisting of slope metrics and the symmetric and asymmetric difference of slope metrics. The slope metrics are
 $$\begin{align} M_{S1} &=M_S ( {0{\cdot} 1,0{\cdot} 9} ) \\ M_{S2} &=M_S ( {{-}0{\cdot} 1,{-}0{\cdot} 9}) \\ M_{S3} &=M_S ( {0{\cdot} 25,0{\cdot} 75}) \\ M_{S4} &=M_S ( {{-}0{\cdot} 25,{-}0{\cdot} 75}) \\ \end{align}$$
In order to create symmetric difference metrics from early and late pairs of slope measurement, their values are added in the following metric,
 $$\begin{align} M_{D1} &=M_{S3} +M_{S4} \\ M_{D2} &=M_{S1} +M_{S2} \end{align}$$
where the M S1–M S4 values are defined in Equation (7) and the M D1 and M D2 are symmetric differential slope metrics. The asymmetrical one-sided differential metrics can be formed by taking the difference of metrics on early or late sides as follows,
 $$\begin{align} M_{D3} &=M_{S3} -M_{S1} \\ M_{D4} &=M_{S4} -M_{S2} \end{align}$$
where M D3 and M D4 are early and late side differential metrics. Considering the structure, the M D1 and M D2metrics are similar to the double delta metric as described in Pirsiavash et al., (Reference Pirsiavash, Broumandan and Lachapelle2017), except for the choice of monitoring correlators. However, M D3 and M D4 are novel in the sense that they use the one-sided monitoring correlators in metric formulation. The double delta metric is defined as follows:
 $$M_{{\rm DT}} =\frac{(I_{-0\cdot 1} -I_{+0\cdot 1} )-(I_{-0\cdot 05} -I_{+0\cdot 05} )}{I_0 }.$$
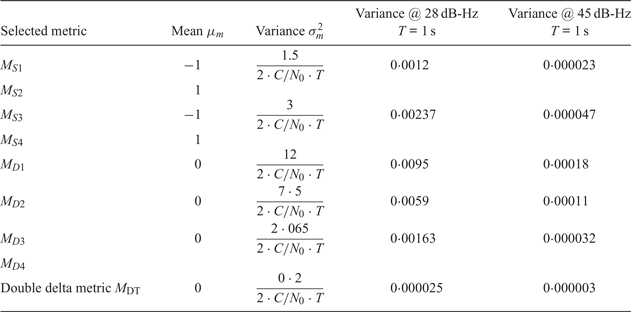
Next, we calculate the nominal variation of the metrics that occurs due to the influence of thermal noise, as given in Irsigler (Reference Irsigler2008) for the slope metrics, given in Equations (7–9). Details of variance calculation are given in Appendix A.
Table 3 summarises the metrics and their variance for different C/N0 values.
Summary of slope based metrics, calculated statistics including expected value and variance formulas and values at different C/N 0.

The variance calculated and presented in Table 3 is based on only the C/N0 value of the signal. The values have been calculated here for the purposes of having a reference to the clean signal. The calculated variance may also be used as a sanity check on the calculated threshold.
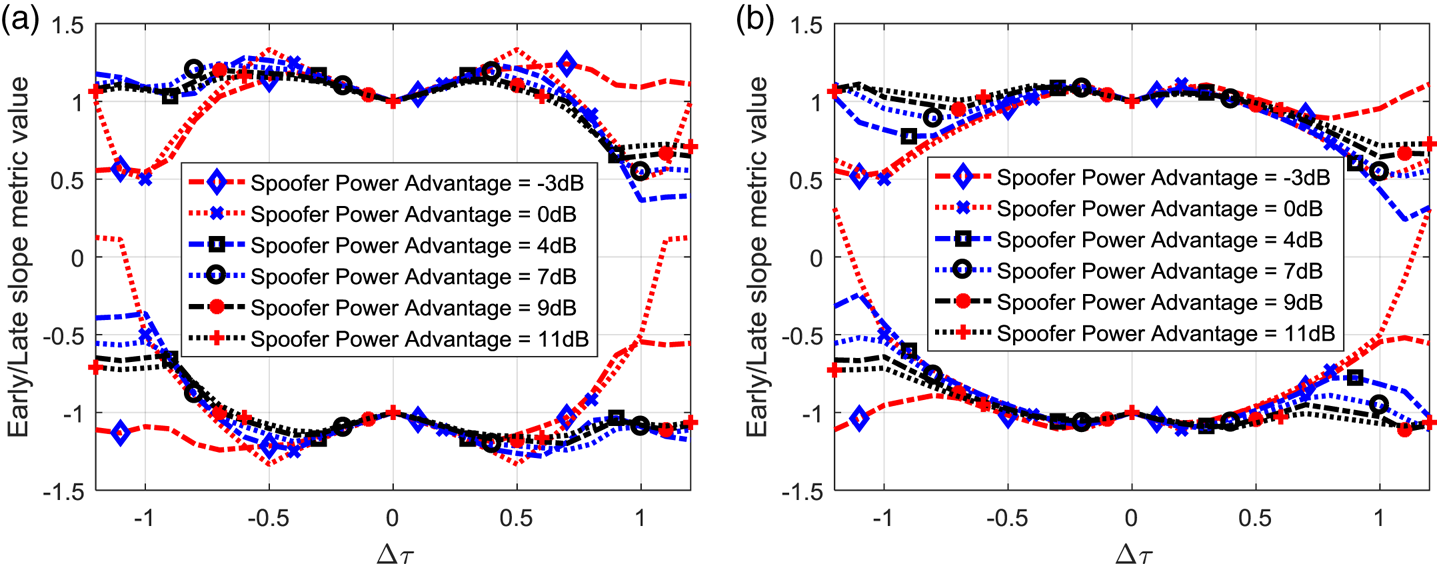
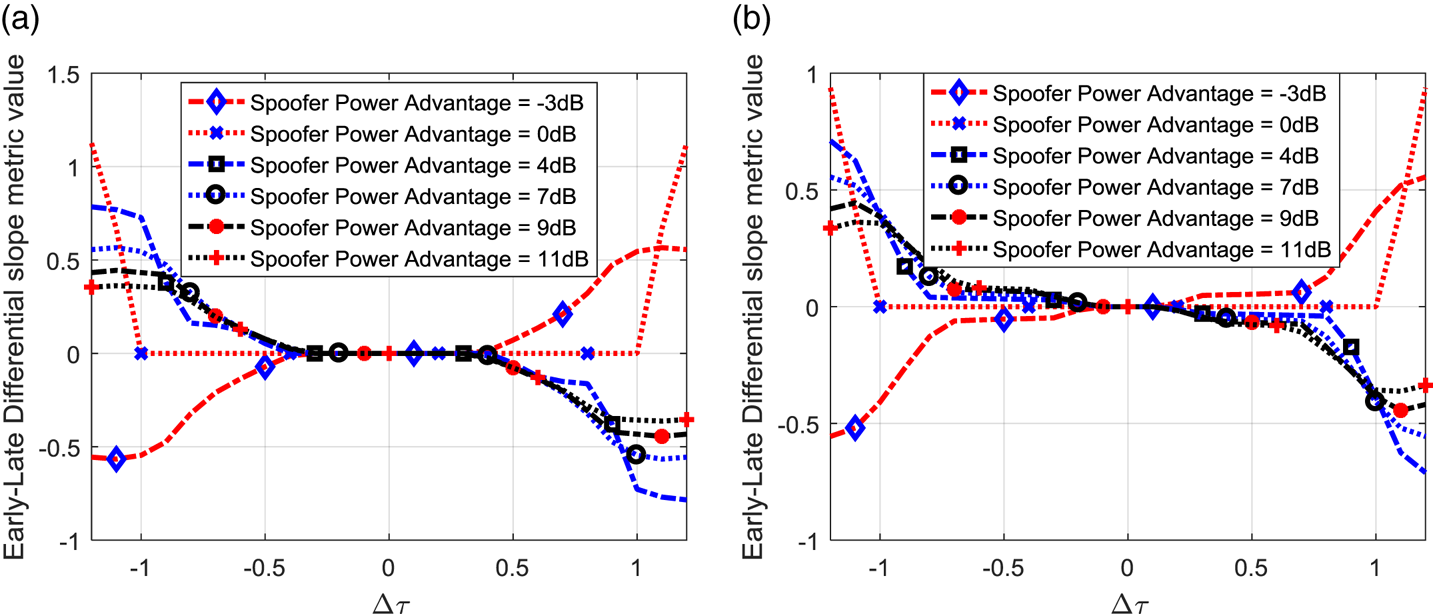
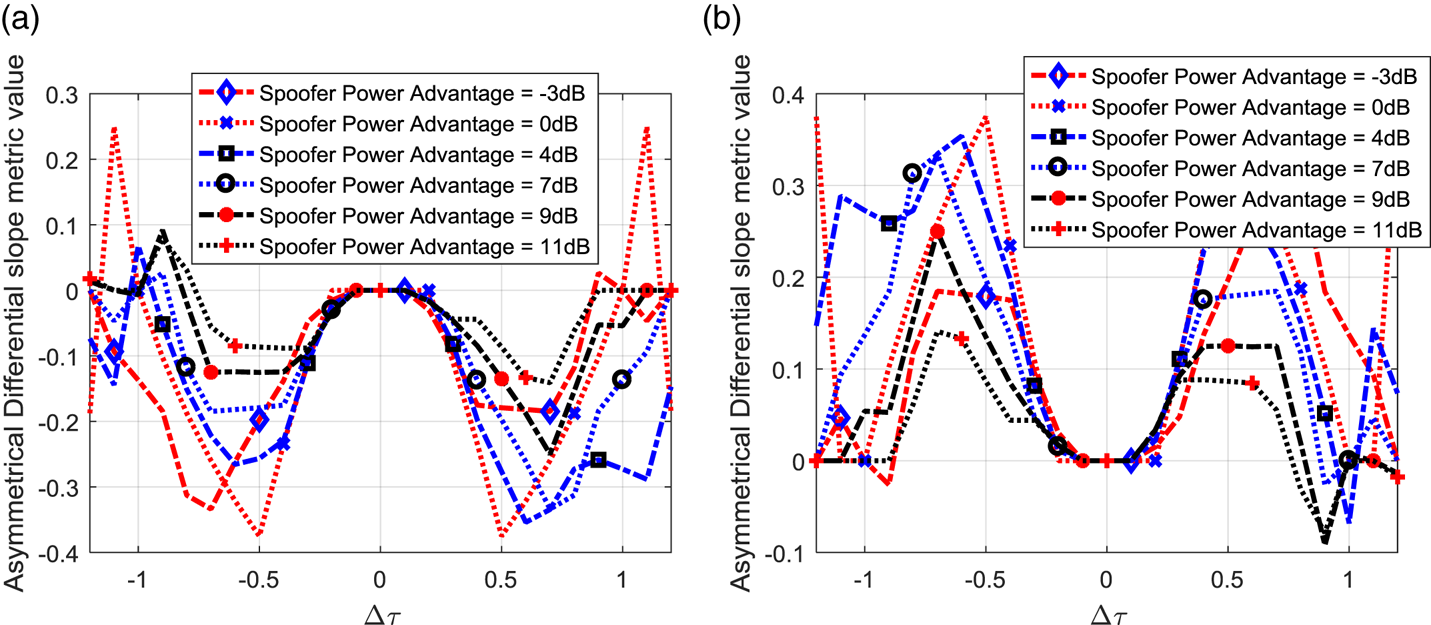
In order to develop a metric suitable for the detection of a spoofing attack, we have simulated the spoofing attack scenario for a different power ratio between authentic and spoofer signal power. Slope metric values for different delays between authentic and spoofing signals are shown in Figures 4–6. Figure 4 contains the slope metrics (M S1–M S4) values. It can be noted here that the slope metric values change from their typical un-spoofed position (when Δ τ = 0) for even a very small change in the spoofing and authentic signal delay. Figure 5 contains the symmetrical differential slope metrics (M D1, M D2). The metrics have a low sensitivity (metric value does not change from the typical value) for small delays in the authentic and spoofing signals; however, they also have low sensitivity for the matched power cases. Figure 6 contains the asymmetrical one-sided differential slope metrics (M D3, M D4). It shows that there is very little change in the slope values for the small delay between the authentic and spoofing signal, even if the power ratio varies. For the larger delays, however, the value of the slope changes considerably. This makes the choice of the asymmetrical one-sided difference slope metric more suitable for spoofing detection, as spoofing eventually has a large delay when the spoofer drags the signal away from the authentic signal (Humphreys et al., Reference Humphreys, Ledvina, Psiaki, O'Hanlon and Kintner2008).
Slope value for monitoring correlators at (a) 25%–75% location at early and late side and (b) 10%–90% location at early and late side. Authentic and spoofing signals are simulated for different delay profiles and Spoofer Power Advantage.

Symmetric differential slope metric values for monitoring correlators at (a) 25%–75% locations and (b) 10%–90% locations. Authentic and spoofing signals are simulated for different delay profile and spoofer power advantage.

Non-symmetrical one-sided differential slope value for monitoring correlators at 10%–90% and 25%–75% location for (a) early correlators and (b) late correlators. Authentic and spoofing signals are simulated for different delay profiles and spoofer power advantage.

3.3. Threshold calculation
A threshold for every metric is necessary for the detection process (Phelts et al., Reference Phelts, Walter and Enge2003). In order to calculate a reasonable threshold, statistical analysis has been performed to implement a Neyman Pearson (NP) detector. Here, we consider two hypotheses: the null hypothesis, H0, which is considered when there is no spoofer present, and the alternate hypothesis, H1, which is considered when the spoofer is present.
H0: When the spoofer is not present, the correlation results contain power from an authentic signal, thermal noise, the multipath components, and other variations. Under the null hypothesis
- (10)
 $$H_0 :M_x \cong \mu _m$$
where M x is any slope metric value and μ m is its mean value.
H1: When the spoofer is present, the correlation results contain the power from spoofing signal too. The expected value of the metric is changed under the spoofing, hence
- (11)$$H_1 :M_x \ne \mu _m$$


In order to build an NP detector in the absence of completely defined distribution of alternate hypothesis, the likelihood function can be defined from Equations (10) and (11), as
 $${\mathcal L}( {M_x } )=| {M_x -\mu _m } |$$
Using the likelihood function, the P FA for a given threshold γ can be calculated from the following,
 $$P_{{\rm FA}} ( \gamma )=\rho (| {M_x -\mu _m }|>\gamma \vert H_0 )$$
where γ is the detection threshold, ρ (·) is the probability function and M x is the desired slope based metric.
If P FA is given, the detection threshold γ can be determined by inverting the probability function. As the slope based metrics are linear combinations of the accumulator outputs which are Gaussian (Huang et al., Reference Huang, Lo Presti, Motella and Pini2016; Pirsiavash et al., Reference Pirsiavash, Broumandan and Lachapelle2017), they are considered Gaussian with theoretical statistics given in Table 3, the threshold can be calculated using,
 $$\gamma =\sqrt 2 \sigma _m erfc^{-1}(2\cdot P_{{\rm FA}} )$$
where erfc −1 is the inverse Gaussian function.
The probability of detection (P D) or detection rate can be theoretically calculated by
 $$P_D ( \gamma )=\rho (| {M_x -\mu _m } |>\gamma \vert H_1 )$$
As the statistical distribution of the disturbance due to the spoofing cannot be determined, however, an empirical solution for finding the detection rate has therefore been chosen in the results section, below.
3.4. Spoofing detector
Using the threshold, a statistical detector can be built from Equations (13) and (15)
 $${\begin{array}{@{}c@{}}\hspace*{3pc} {H_0 } \\ | {M_x -\mu _m } |\lessgtr\gamma\\ \hspace*{3pc} {H_1 } \\ \end{array} }$$
A combination of metrics can also be used to form a detector. In this case Equation (16) can be used for detection using individual metrics and their detection results can be combined to achieve the final results, as below,
 $$\begin{array}{@{}l@{\quad}l@{}} {| {M_{x_1 } -\mu _{m_1 } } |>\gamma _1 \hbox{ or } |{M_{x_2 } -\mu _{m_2 } } |>\gamma _2 } & {\mbox{decide }H_1 }\\ {\mbox{otherwise}} & {\mbox{decide }H_0 } \\\end{array}$$
where the subscripted values correspond to two different metric values and threshold.
4. RESULTS
In order to gain an insight into slope based metrics, detectors based on the metrics listed in Table 3 and a combination detector have been considered for examination, using the datasets described previously. The non-spoofing datasets have been used for the P FA calculation and the spoofing datasets have been used for calculation of P D.
A software defined receiver (SDR) (Borre et al., Reference Borre, Akos, Bertelsen, Rinder and Jensen2006) with additional monitoring correlators has been used to generate tracking results. The integration time (T) has been selected as 1 s, whereas the correlation result is produced every 1 ms, and post-correlation integration for metric calculation has been carried out by coherent integrators. The SDR produces tracking and monitoring results every T seconds for each tracking channel. The value of each metric under study is calculated and a detection is considered if the metric value is greater than the threshold.
The study also includes a combination detector for the examination using M D3 and M D4. The detector is formed as described by Equation (17). A single threshold for both constituent metrics has been used during the measurement of P FA and P D for the combination detector.
4.1. Selection of threshold for specific P FA
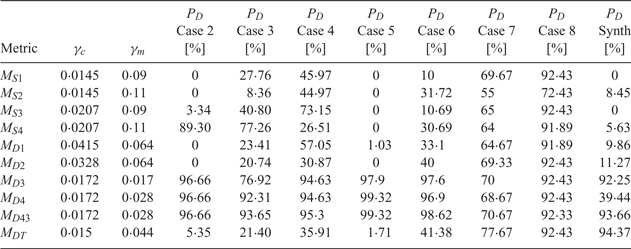
To calculate the measured threshold (γ m) for 0·1% P FA, an arbitrary starting value of threshold is selected for each spoofing detection metric, for which detection is decided using Equation (16), using the data from the available set of satellites in non-spoofing cases. P FA is calculated as the number of samples in which spoofing is detected out of total samples in which the spoofing is tested, which is effectively the averaging of detection in all satellites. The threshold value has been iteratively varied and a value is finally selected which gives the required P FA of 0·1%. Before the detection process, the data samples that have C/N0 below 28 dB-Hz have been removed from the dataset, to avoid normalisation issues that may occur under low signal-to-noise ratio. The measured threshold computed through the described method for each metric is given in Table 4.
Results of slope metrics including calculated and measured thresholds and P D for each case from TEXBAT and synthetic data for 0·1% P FA.

The calculated threshold (γ c) has been computed using Equation (14) for C/N0 at 45 dB-Hz and P FA of 0·1%. The C/N0 has been chosen, based on the average carrier-to-noise ratio in the complete dataset. The result of the calculated threshold is also shown in Table 4.
4.2. Measurement of P D
To calculate P D, a non-spoofing dataset has been used. The measured threshold (γ m) that produces specific P FA is used in the detector. The spoofing period has been considered to be from the onset of spoofing until the end of the dataset, as given by the spoofing delay profile (spoofer delaying/advancing the spoofing signal compared with authentic signal) as described by Humphreys et al. (Reference Humphreys, Bhatti, Shepard and Wesson2012) and Lemmenes et al. (Reference Lemmenes, Corbell and Gunawardena2016), and synthetic data delay profile as described by Khan et al. (Reference Khan, Iqbal and Khan2018).
By using the metrics values and employing Equation (16), the detection is declared for each measurement in each channel. The detection rate (P D) has been calculated as the number of samples in which spoofing is detected out of total samples in which the spoofing is tested using measured threshold (γ m), for each satellite, for each case listed in Table 2, effectively averaging the detection rate of all satellites. The detection rate (P D) for each spoofing case is also listed in Table 4.
4.3. Discussion of results
The results of the experiments are summarised in Table 4 with thresholds and detection rates for each metric under study in different spoofing cases. It can be seen that the simple slope metrics, symmetric difference metrics, and the double delta metric could not perform well for spoofing detection. The measured threshold for these metrics is also found to be comparatively higher, showing that there are more nominal variations in these metrics. This indicates that these methods are more sensitive to the multipath and hence may be better suited for the multipath detection. On the other hand, the metric M D3 and M D4 (asymmetric one-sided differential metrics on early and late side) performed better with high detection rate for the same rate of false alarms. They also have a comparatively smaller threshold and a small difference between measured threshold (γ m) and the calculated threshold (γ c), suggesting that these metrics are less sensitive to the multipath and other nominal disturbances. It can also be observed that there is a difference between the detection rates of M D3 and M D4 metrics which is due to the pull-off direction of the spoofer. The spoofer always tries to adjust the pull-off direction of the spoofing signal such that the authentic signal appears as multipath. This may not be possible, however, in position-push cases where each satellite signal has to be steered such that a different position is deduced by the victim receiver and hence a different pull-off direction in some channels is necessary. Due to this fact, one metric has a higher detection rate than the other one. Therefore, the performance of a combination detector M D43 which uses the results of both metrics surpasses that of the other detectors.
It can also be observed that method M D43 performs better in case 2 and case 5 where the spoofer power advantage is very high. The high detection rate could be attributed to two phenomena. The first is the fact that the method is found good for even a very high spoofer advantage, as evident from Figure 6, which shows a significant metric value for different spoofer power advantages. Second, the overpowered cases are more similar to the multipath cases, but due to the random nature of multipath, and the inherent averaging in the method, it could differentiate between the multipath and spoofing. It can also be noted that case 2 and case 5 are time-push cases, which means that the spoofer delay profile is the same for all the channels, so detection is similar for each channel, which is not the case with position-push cases. Also in over-powered cases, the variation in signals due to spoofing starts early.
The results show that the slope based detector, when compared with some recent studies in which the results are reported quantitatively (Wang et al., Reference Wang, Li and Lu2017; Wesson et al., Reference Wesson, Gross, Humphreys and Evans2018; Gross et al., Reference Gross, Kilic and Humphreys2019), performs equally well. However, these methods require a larger number of correlators and a detector that is based on a complex detection procedure. On the other hand, the method proposed in this study uses a smaller number of monitoring correlators and the metric is composed of a simple linear combination of correlator value and detector output that is produced by applying a threshold. The structure of the slope metric based detector is therefore simpler than the comparable methods, and therefore it produces less computational burden. It is also evident from Table 4 that the double delta metric, whilst demonstrating good performance in detecting multipath (Irsigler, Reference Irsigler2008), does not show a similar performance in the detection of spoofing.
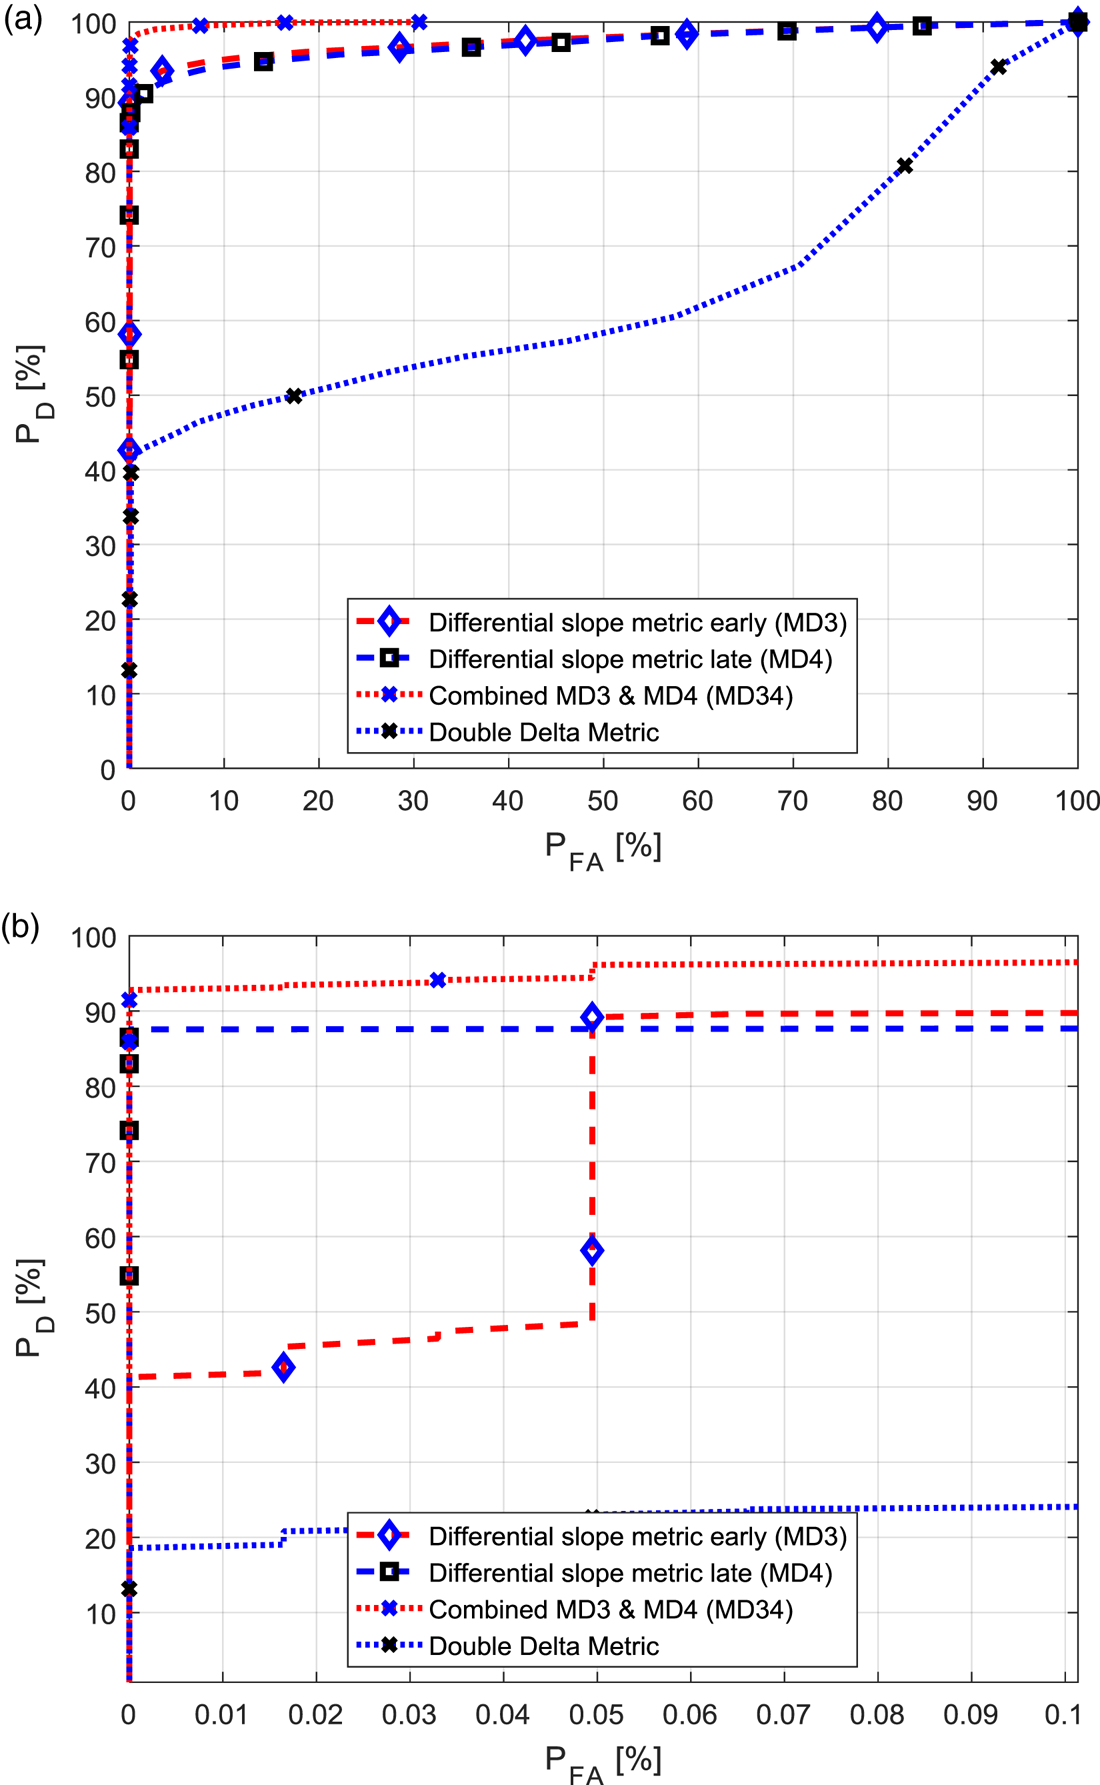
In order to gain a complete insight into the performance of the detectors, the receiver operating characteristics (ROC) curve of selected detectors has been constructed and is given in Figure 7. For the purposes of building the ROC curve, the P FA (using non-spoofing dataset) and P D values (using spoofing dataset) have been calculated and plotted as the threshold used in both calculations is varied simultaneously. The ROC curve is built by using the signals from all available satellites in the complete datasets used in this study. Looking into the ROC it can be seen that the Area Under the Curve (AUC), which is an important parameter in comparing detector performance, of the detector based on M D3 and M D4 is almost similar showing similar performance by them. However the AUC of the combination detector (M D43) is much higher.
ROC curve of slope metric based detectors: (a) complete ROC (b) expanded view of ROC for performance comparison in low PFA.

Looking into the expanded view of the ROC curve it can be seen that the performance of the combination detector on the selected dataset is high for even a lower threshold value, suggesting that the threshold in the experiments can be further lowered with a very small decrease in detection rate but a significant decrease in false alarm rate.
5. CONCLUSION
The study presented here has focussed on detecting spoofing attacks. This paper has proposed various slope based metrics for spoofing detection in intermediate/sophisticated spoofing attacks. The detectors based on asymmetrical differential slope metrics have been found to be robust and sensitive to spoofing attacks in matched power as well as overpowered cases as deduced from the simulation and demonstrated through experimental results. A combination detector based on two slope metrics has also been discussed in this paper and has been found to outperform other detectors. The combination detector has performed equally well in static and dynamic cases and on synthetically generated spoofing attacks. The detector performs better because of its sensitivity to the longer delay between authentic and spoofing signal, which can be attributed to spoofing. The double delta metric, well known for multipath detection, is also tested with the same method and found not to be suitable for spoofing detection, which may be attributed to the use of only legacy correlators. In most cases the distortions due to the spoofing do not affect the legacy correlators.
The slope metrics have been analysed in simulation and a theoretical variance of each metric has also been calculated that has been used as sanity check and can be used as a theoretical limit to the threshold. In the future, studies may be conducted to investigate the utilisation of more complex detectors and usage of the slope metric in multipath mitigation and other related studies.
APPENDIX A. METRIC VARIANCE CALCULATION
To calculate variance due to noise in the slope metrics (M S1–M S4) of a form  $( ( I_{\tau _{2} } -I_{\tau _{1} } ) /( \vert {X-Y} \vert I_{\tau _{0} } ) ) $ as given in Equation (6) following the equation from Irsigler (Reference Irsigler2008) can be used
 $$\begin{align} \sigma _m =\frac{2R( {\tau _0 } )[ {1-R( {\tau _2 -\tau _1 } )} ]+[ {R( {\tau _2 } )-R( {\tau _1 } )} ][ {2R( {\tau _1 -\tau _0 } )-2R( {\tau _2 -\tau _0 } )+((R( {\tau _2 } )-R( {\tau _1 } ))/(R( {\tau _0 } )))} ]}{2(\tau _2 -\tau _1 )^2CNo\cdot T\cdot R^3( {\tau _0 } )} \end{align}$$
where τ 2, τ 1 and τ 0 are the relative delay of the in-phase measurement correlator in reference of prompt correlator, i.e. τ 0 = 0, R() is the autocorrelation function, CN 0 is the carrier-to-noise ratio and T is the integration time.
For the differential slope metric (M D1–M D4), which generally has a form  $( ( I_{\tau _{2} } -I_{\tau _{1} } ) /( \vert {\tau _{2} -\tau _{1} } \vert I_{\tau _{0} } ) ) -( ( I_{\tau _{4} } -I_{\tau _{3} } ) /( \vert {\tau _{4} -\tau _{3} } \vert I_{\tau _{0} } ) ) $, the variance can be also calculated by using the method given in Irsigler (Reference Irsigler2008). Using the referenced method, the variance can be calculated from the following equation
 $$\sigma _m =\frac{ADA^T}{2\cdot CNo\cdot T}$$
where
 $$\begin{align}{A&=\left[ {\frac{1}{| {\tau_2 -\tau_1 } |R( {\tau_0 } )}\frac{-1}{| {\tau_2 -\tau_1 } |R( {\tau_0 } )}\frac{1}{| {\tau_4 -\tau_3 } |R( {\tau_0 } )}\frac{-1}{| {\tau_4 -\tau_3 } |R( {\tau_0 } )}\frac{R( {\tau_2 -\tau_1 } )}{| {\tau_2 -\tau_1 } |R^2( {\tau_0 } )}} \right. \\ &\quad -\left. \frac{R( {\tau_4 -\tau_3 } )}{| {\tau_4 -\tau_3 } |R^2( {\tau_0 } )} \right] \\ D&=\left[ {{\begin{matrix} 1 & {R( {\tau_2 -\tau_1 } )} & {R( {\tau_2 -\tau_4 } )} & {R( {\tau_2 -\tau_3 } )} & {R( {\tau_2 -\tau_0 } )} \\ {R( {\tau_1 -\tau_2 } )} & 1 & {R( {\tau_1 -\tau_4 } )} & {R( {\tau_1 -\tau_3 } )} & {R( {\tau_1 -\tau_0 } )} \\ {R( {\tau_4 -\tau_2 } )} & {R( {\tau_4 -\tau_1 } )} & 1 & {R( {\tau_4 -\tau_3 } )} & {R( {\tau_4 -\tau_0 } )} \\ {R( {\tau_3 -\tau_2 } )} & {R( {\tau_3 -\tau_1 } )} & {R( {\tau_3 -\tau_4 } )} & 1 & {R( {\tau_3 -\tau_0 } )} \\ {R( {\tau_0 -\tau_2 } )} & {R( {\tau_0 -\tau_1 } )} & {R( {\tau_0 -\tau_4 } )} & {R( {\tau_0 -\tau_3 } )} & 1 \\ \end{matrix} }} \right]}\end{align}$$
where the τ 1, τ 2, τ 3, and τ 4 are the relative delays of measurements with reference to the reference correlator τ 0.