I. INTRODUCTION
The phase diagram of the Al–Cu–Y ternary system has been studied deeply, and the ternary compounds of Al–Cu–Y system were studied extensively. At the same time, several ternary compounds have been reported, such as Al7.6Cu4.4Y, AlCuY, Al7Cu2Y3, Al8.43Cu2.59Y3, Al5.4Cu11.6Y2, Al1.05Cu9.93Y, Al4.745Cu6.255Y (Krachan et al., Reference Krachan, Stel'makhovich and Kuz'ma2003), Al8Cu4Y (Buschow et al., Reference Buschow, van Vucht and van den Hoogenhof1976), Al6Cu6Y (Felner, Reference Felner1980), Al2.04Cu2.96Y (Kadir et al., Reference Kadir, Sakai, Uehara and Eriksson2001), Al7Cu5Y (Drake et al., Reference Drake, Capan, Young, Nambu, Kuga, Xiong, Karki, Nakatsuji, Adams, Young and Chan2010), but there were no reports about the AlCu4Y ternary compound. The related compounds with the similar crystal structures had been reported too, such as AlCo4 RE (RE = Y, Dy, Gd, Nd, Pr, Sm, Tm, Tb, Ce, La), AlNi4RE (RE = Ce, Dy, Er, Gd, Ho, La, Nd, Pr, Sm Tb, Tm), and AlCu4 RE (RE = Ce, Dy, Er, Gd, Ho, La, Nd, Pr, Sm, Tb, Tm, Yb) (ICSD Database, 2014.02). In this paper, we present the X-ray powder diffraction pattern and crystal structure with the Rietveld refinement method for the well-crystallized AlCu4Y compound.
II. EXPERIMENTAL
A. Synthesis
The sample of high-purity AlCu4Y compound was prepared by melting with stoichiometric elemental constituents with 99.99 wt% Al, 99.99 wt% Cu, and 99.9 wt% Y coming from China New Metal Materials Technology Co., Ltd. under high-purity argon atmosphere in a vacuum arc furnace. In the process of melting, titanium was melted firstly as an oxygen capture agent. In order to fuse together and uniformly of the composition elements, melting processes (three times in the experiment) have been executed many times, and the weight losses of the sample were <1 wt%. The sample of the AlCu4Y compound was enclosed in an evacuated quartz tube and annealed at the temperature of 1123 K for 30 days, and then cooled down to room temperature by the rate of 18 K h−1. Finally, the compound was ground to powder with the particle size smaller than 10 µm in a steel mortar.
B. Data collection
The X-ray powder diffraction data of AlCu4Y ternary compound were collected at room temperature by the Rigaku SmartLab X-ray powder diffractometer, and using the CuKα radiation equipped with a diffraction beam graphite monochromator. The diffractometer was operated at voltage 40 kV and current 150 mA, and the scan range of Bragg angle (2θ) was from 10° to 100° with the step size of 0.02° and the count-time of 2 s step−1. In order to reduce the instrumental errors, the internal standard method with high-purity silicon has been used, and the X-ray powder diffraction data for the mixture of AlCu4Y and SRM Si were collected. The whole pattern of AlCu4Y was calibrated by linear fit with reference material SRM Si. The RIR value was calculated by the highest peak intensity ratio between AlCu4Y and corundum from the X-ray powder diffraction pattern that were collected by the mixture of 50 wt.% AlCu4Y and 50 wt.% corundum.
III. CONCLUSIONS
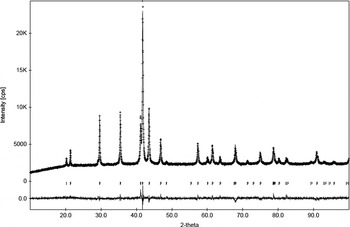
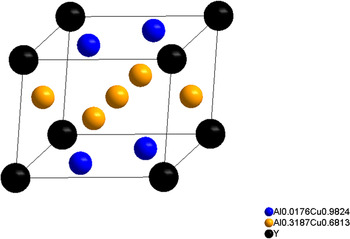
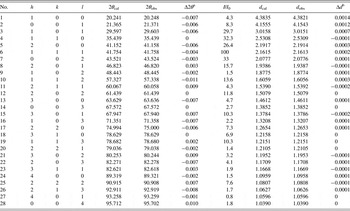
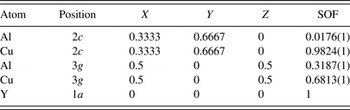
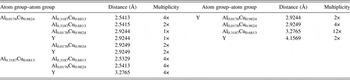
All peaks were indexed successfully in the experimental X-ray diffraction pattern of AlCu4Y by Jade 6.5 (Materials Data Inc., 2002) software with the hexagonal structure. The Smith–Snyder figure-of-merit F N (Smith and Snyder, Reference Smith and Snyder1979) is F 28 = 169.8(0.0061, 33). The intensity ratio RIR value is 1.96. The X-ray powder diffraction data for AlCu4Y are listed in Table I. It was found that AlCu4Y and AlCo4Y (Ido et al., Reference Ido, Konno, Cheng, Wallace and Sankar1990) have the similar crystal structure type (P6/mmm, No.191) by comparing the crystal structure information of AlCu4Y with that of AlCo4Y. The cell parameters were obtained with a = 5.0658(1) Å, c = 4.1569(1) Å, V = 92.38 Å3, Z = 1, and the density is 6.66 g cm−3 by Rietveld refinement of the X-ray powder diffraction pattern with DBWS9807 program (Young, Reference Young, Larson and Paiva-Santos2000). The observed, calculated, and residuals of X-ray powder diffraction pattern for AlCu4Y after the Rietveld refinement are showed in Figure 1, and the atomic positions and occupancy of AlCu4Y after Rietveld refinement are listed in Table II with the goodness-of-fit parameters: R p = 2.57%, R wp = 3.34%, R B = 6.70%, R F = 5.27%, and S = 1.69. The SOF of Al atom is 0.3187(1) in 3g positions, but only 0.0176(1) in 2c positions, and the total Al atoms in unit cell are 0.9913 that match with the chemical formula of AlCu4Y. The Al atom prefers to occupy the 3g position because the atomic radius of Al is 1.43 Å that is bigger than the atomic radius of Cu with 1.28 Å, and the 3g position has larger gap than the 2c position. But if the 2c positions are all occupied by Cu atoms, then the goodness-of-fit parameters become worse with R p = 2.82%, R wp = 3.93%, R B = 9.42%, R F = 7.41%, and S = 1.99, and the total Al atoms are 0.9798 in unit cell. So it is appropriate that Al atoms occupy 2c positions with SOF 0.0176 and 3g positions with SOF 0.3187. The structure diagram of unit cell for AlCu4Y has been drawn and shown in Figure 2. The distances between the selected atoms or atom groups for AlCu4Y have been listed in Table III.
Observed, calculated, and residuals of X-ray powder diffraction pattern for AlCu4Y after refinement.

(Colour online) Unit-cell structure of AlCu4Y.

X-ray powder diffraction data for AlCu4Y (CuKα 1, with λ = 1.5406 Å)

a Δ2θ = 2θ cal − 2θ obs.
b Δd = d cal − d obs.
Atomic positions and occupancy of AlCu4Y with Rietveld refinement.

Distances between the selected atoms or atom groups for AlCu4Y.

SUPPLEMENTARY MATERIAL
For supplementary material for this article, please visit http://dx.doi.org/10.1017/S0885715615000627.
ACKNOWLEDGEMENTS
This work was financially supported by the Department of Science and Technology of Guangxi Zhuang Autonomous Region (Project number 2014AA01018) and the Department of Education of Guangxi Zhuang Autonomous Region (Project number YB2014386).