


1. INTRODUCTION
Lasers with pulse-width in the picosecond regime are applied in an ever-increasing number of areas, such as material processing, holography, plasma diagnosis based on Thomson scattering, laser ranging, etc. Especially in the research of plasma diagnosis and laser ranging, in order to obtain higher spatial resolution (below 5 cm), short pulse width below 150 ps is particularly necessary. Mode-locking is usually applied in the generation of picosecond laser pulses (Su et al., Reference Su, Wang, Liu, Zheng, Su and Xu2012; Ai et al., Reference Ai, Chen, Xu, Chang, Chen, Li, Yang and Ma2012), but the obtained pulse energy generally ranges from several nanojoules to hundreds of microjoules. To get higher energy lasers with picosecond pulse duration, the regenerative amplifier system has been applied to amplify the mode-locked pulses (Ai et al., Reference Ai, Chen, Xu, Chang, Chen, Li, Yang and Ma2012). However, this amplifier system has some disadvantages such as the complicated structure and the low amplification efficiency. In addition, short pulses obtained by this method have a wide spectrum which is not suitable for laser ranging which needs a perfect coherent laser source.
With Q-switching technique, single frequency nanosecond laser pulses whose energy is higher than that generated by mode-locking technique can be obtained easily (Schellhorn, Reference Schellhorn2010; Dai et al., Reference Dai, Ju, Yao, Shen, Wang and Wang2012). And this kind of pulse then can be amplified by master-oscillator-power-amplifier system efficiently (Siebold et al., Reference Siebold, Hein, Wandt, Klingebiel, Krausz and Karsch2008). During the past decades, stimulated Brillouin scattering (SBS) has attracted researcher's general attention owing to its broad applications. The application region mainly include pulse compression (Yoshida et al., Reference Yoshida, Hatae, Fujita, Nakatsuka and Kitamura2009; Velchev & Ubachs, Reference Velchev and Ubachs2005; Xu et al., Reference Xu, Feng and Diels2014; Marcus et al., Reference Marcus, Pearl and Pasmanik2008; Hasi et al., Reference Hasi, Zhong, Qiao, Guo, Li, Lin, He, Fan and Lü2012), laser beam combination (Kong et al., Reference Kong, Shin, Yoon and Beak2009; Reference Kong, Yoon, Beak, Shin, Lee and Lee2007), Brillouin amplification (Guo et al., Reference Guo, Lu and Wang2010; Reference Gao, Liu, Bi and Hu2013), optical limiting applied for the high power protection (Hasi et al., Reference Hasi, Guo, Lu, Fu, Gong, Geng, Lu, Lin and He2009), and so forth. With SBS pulse compressing technique, a nanosecond laser pulse can be compressed to a hundred picosecond laser pulse with high energy conversion efficiency (Hon, Reference Hon1980; Neshev et al., Reference Neshev, Velchev, Majewski, Hogervorst and Ubachs1999; Kuwahara et al., Reference Kuwahara, Takahashi, Matsumoto and Kato2000; Velchev & Ubachs, Reference Velchev and Ubachs2005; Marcus et al., Reference Marcus, Pearl and Pasmanik2008; Yoshida et al., Reference Yoshida, Hatae, Fujita, Nakatsuka and Kitamura2009; Hasi et al., Reference Hasi, Zhong, Qiao, Guo, Li, Lin, He, Fan and Lü2012; Omatsu et al., Reference Omatsu, Kong, Park, Cha, Yoshida, Tsubakimoto, Fujita, Miyanaga, Nakatsuka, Wang, Lu, Zheng, Zhang, Kalal, Slezak, Ashihara, Yoshino, Hayashi, Tokizane, Okida, Miyamoto, Toyoda, Grabar, Kabir, Oishi, Suzuki, Kannari, Schaefer, Pandiri, Katsuragawa, Wang, Lu, Wang, Zheng, He, Lin, Hasi, Guo, Lu, Fu, Gong, Geng, Sharma, Sharma, Rajput, Bhardwaj, Zhu and Gao2012). This laser transformation system does not need complicated optical structure and much expenditure, so it is an effective way to obtain high energy single frequency hundred picosecond laser pulses.
Since it was reported for the first time in the 1980s, this kind of technique for pulse-compressing has attracted the attention of many researchers all around the world. In 1980, Hon (Reference Hon1980) presented that pulse compression can be realized by injecting laser pulse into tapered fiber or focus cell, which is filled with Brillouin active material. The experimental results showed that a 20 ns Nd:YAG laser pulse was compressed to 2 ns with the compression ratio of 10, when the laser was injected into a tapered fiber. In 2000, Kuwahara coupled 20 ns KrF laser pulses into 10 atm SF6 and 350 ps short pulses was obtained with the energy conversion efficiency of about 50.8% (Kuwahara et al., Reference Kuwahara, Takahashi, Matsumoto and Kato2000). Yoshida et al. (Reference Yoshida, Fujita, Nakatsuka, Ueda and Fujinoki2007) compressed 13 ns Q-switched laser pulses to 1 ns pulses with the highest reflectivity of 95% without damage. And the next year, Marcus et al. (Reference Marcus, Pearl and Pasmanik2008) injected 2.5 ns laser pulse into quartz slab and achieved an output of 175 ps short pulse which to our knowledge is the shortest one in the world with a solid material based on SBS. When it comes to the stability of the compressed laser pulses, solid material is more suitable for SBS medium than gaseous material. However, solid material cannot be used in high power laser system because it has a very low optical breakdown threshold and can be damaged permanently under this kind of high power radiation. So in order to realize pulse compression under high power condition, liquid medium has drawn the researchers' attention much more in the recent years (Guo et al., Reference Guo, Hasi, Zhong, Jin, Lin, He and Lu2012; Omatsu et al., Reference Omatsu, Kong, Park, Cha, Yoshida, Tsubakimoto, Fujita, Miyanaga, Nakatsuka, Wang, Lu, Zheng, Zhang, Kalal, Slezak, Ashihara, Yoshino, Hayashi, Tokizane, Okida, Miyamoto, Toyoda, Grabar, Kabir, Oishi, Suzuki, Kannari, Schaefer, Pandiri, Katsuragawa, Wang, Lu, Wang, Zheng, He, Lin, Hasi, Guo, Lu, Fu, Gong, Geng, Sharma, Sharma, Rajput, Bhardwaj, Zhu and Gao2012; Yoshida et al., Reference Yoshida, Hatae, Fujita, Nakatsuka and Kitamura2009). In 2009, Yoshida et al. (Reference Yoshida, Hatae, Fujita, Nakatsuka and Kitamura2009) realized high compression ratio pulse compressing with FC-40 as nonlinear medium. FC-40 has a very short phonon lifetime of about 240 ps which is good for pulse compression, and it has a high load capacity which makes it run normally even under the condition of several joules injection or high repetition frequency. Without the phenomenon of optical breakdown, the 13 ns pulse width, 1064 nm wavelength Nd:YAG laser pulse is compressed about 65 times to 160 ps, with the energy conversion efficiency higher than 80%. However, there lacks stability analysis of the compressed pulses in their paper. In 2005, Velchev and Ubacks (Reference Velchev and Ubachs2005) presented the theory model of the compressing process, and obtained 320 ps short pulse output compressed from a 5 ns pump light. The statistical standard deviation was 40 ps, and the corresponding RMS was 13.1%. In practice, this kind of short pulses cannot meet the need of engineering in some domain. So the problem how to obtain shorter and more stable compressed pulse suitable for practical application is imperative to be solved.
In this paper, we employed the compact two-cell structure to investigate pulse compressing property of SBS and analyzed the temporal stability of the compressed pulse. In the experiment, we chose an 8 ns Nd:YAG laser as the pump light, FC-40 as the Brillouin medium, and obtained an average width of Stokes pulses of about 136 ps while the minimum can reach 123 ps. The highest energy conversion efficiency is about 85%, and at this condition the single pulse energy of the output laser pulse is above 300 mJ. The RMS of the Stokes light is 4.1% which is three times smaller than the results reported in Velchev and Ubachs (Reference Velchev and Ubachs2005), showing a better stability.
2. NUMERICAL SIMULATION
The purpose of our work is to obtain hundred picosecond laser pulses with the SBS pulse compression. According to the research results reported previously, the pulse-width of the compressed output laser is limited by the decay time of the phonon field. It means that, to get short compressed pulse duration, the phonon lifetime of the medium should be shorter than, or at least comparable with the goal pulse-width. In this case, the transient nature of the process has to be taken into account. This kind of pulse compression can be described by the following coupled-wave equations (Velchev et al., Reference Velchev, Neshev, Hogervorst and Ubachs1999).
 $$\displaystyle{{\partial A_1 } \over {\partial z}} + \displaystyle{n \over c}\displaystyle{{\partial A_1 } \over {\partial t}} = i\displaystyle{{{\rm \omega} {\rm \gamma} _e } \over {2nc{\rm \rho} _0 }}{\rm \rho} A_2 - {\rm \alpha} A_1 \comma$$
 $$- \displaystyle{{\partial A_2 } \over {\partial z}} + \displaystyle{n \over c}\displaystyle{{\partial A_2 } \over {\partial t}} = i\displaystyle{{{\rm \omega} {\rm \gamma} _e } \over {2nc{\rm \rho} _0 }}{\rm \rho} ^{\ast} A_1 - {\rm \alpha} A_2 \comma \; $$
 $$\displaystyle{{\partial ^2 {\rm \rho} } \over {\partial t^2 }} + \lpar \Gamma _B - i2{\rm \omega} _B \rpar \displaystyle{{\partial {\rm \rho} } \over {\partial t}} - i\Gamma _B {\rm \omega} _B {\rm \rho} = \displaystyle{{{\rm \gamma} _e k_B^2 } \over {4{\rm \pi} }}A_1 A_2^{\ast} \comma \; $$
where A 1, A 2, and ρ are field amplitudes of pump, Stokes, and acoustic waves, respectively. n is the effective refractive indices of the material; c is the light velocity in vacuum; ω is the angular frequency of the pump laser; ρ0 is the field amplitude of the material density while there is no incident laser; γe is electrostriction coefficient; α is the absorption coefficient of the material; k B is the wave vector of the acoustic wave; ωB and ΓB are Brillioun shift and Brillouin bandwidth, respectively. The Brillouin gain coefficient can be calculated with above mentioned parameters by 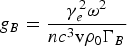 $g_B = \displaystyle{{{\rm \gamma} _e^2 {\rm \omega} ^2 } \over {nc^3 {\rm v}{\rm \rho} _0 \Gamma _B }}$, where v represents the velocity of the acoustic wave. By numerically calculating this three-wave coupled-wave equations, the SBS progress can be predicted in advance and the experimental parameters can be optimized.
In the numerical simulations, we used the compact two-cell structure, and the parameters are set as follows: the wavelength of pump light is λ= 1.064 µm, the pulse width of pump light with Gaussian shape is 8 ns, the refraction index of the nonlinear material is 1.28, the Brillouin gain coefficient is 1.8 cm/GW, the Brillouin shift is 1075 MHz, the Brillouin bandwidth is 410 MHz, the phonon time is 240 ps, and the absorption coefficient is 10−3cm−1(Hasi et al., Reference Hasi, Zhong, Qiao, Guo, Li, Lin, He, Fan and Lü2012; Yoshida et al., Reference Yoshida, Hatae, Fujita, Nakatsuka and Kitamura2009). The beam size used in our simulation for laser intensity calculation is 9 mm.The length of the amplifier cell and that of the generator cell is 1000 mm and 800 mm, respectively. The focal-length of the lens in front of the amplifier cell is 1500 mm and that of the lens in front of the generator cell is 600 mm.
The calculated waveforms of the Stokes light and the pump light under different incident laser energy are shown in Figure 1. It can be seen from the picture that the input Gaussian 8 ns laser pulses can be compressed to hundreds of picosecond Stokes pulses, and the compressed pulse width decreases with the increase of the pump energy. When the pump energy exceeds 300 mJ, the pulse-width of the output Stokes will be below 200 ps.
Calculated waveform with different pump energy.

3. EXPERIMENTAL SETUP
We investigated experimentally the pulse compression based on SBS and the experimental setup is shown as Figure 2. The experiment was carried out with a single mode injection seeded Continuum Nd:YAG laser, which have an output wavelength of 1064 nm, line-width of 90 MHz, pulse width of 8 ns, repetition rate of 1 Hz, divergence angle of 0.45 mrad, beam diameter of 9 mm and the highest output energy of 600 mJ. This p-polarized laser transmits through optical isolation system, a half-wave plate, a polarizer, a quarter-wave plate, and then becomes circularly polarized, finally injects into the SBS compressor. The half-wave plate and the polarizer are utilized to control the energy injected into the SBS cell. F1 and F2 are used to focus the laser into the generator L2, F1 is a long focus lens which is placed before L1 to reduce the spot size and enhance the laser intensity in the amplifier cell. In our experimental setup, the length of L1 is 1000 mm, L2 is 800 mm, F1 is 1500 mm and F2 is 600 mm. Initiated from the focus plate, the Stokes light transmitting backward is excited, and interacts with the forward pump. In the process of the interaction between the backward Stokes and forward pump, the front edge of Stokes has the priority to be amplified and then compression of the laser pulse is realized. Finally, compressed laser pulses (Stokes) are output from the polarizer and are injected into the detection system. The polarizer and the quarter-wave plate compose a separation system to prevent the backward Stokes from injecting into the Nd: YAG laser, which will damage it. A photodiode with 12 ps response time (New Focus 1454) and a digital oscilloscope (Tektronix DPO7254, bandwidth 12.5 GHz, sample rate 100 Gs/s) are used to detect and record the output Stokes waveform, at the same time the energy meter (OPHIR PE50BB-DIF-V2) is used to detect the output Stokes energy.
Schematic diagram of the experimental setup. λ/2-the half wave plate, λ/4-the quarter wave plate, L1-length of the amplification cell, L2-length of the generation cell, F1-the focal length of Lens1, F2-the focal length of Lens2.
In the experiment, the heavy fluorocarbon FC-40 is selected as the nonlinear medium. Under the condition of the pump wavelength of 1.064 µm, the parameters of the medium are identical with what we set in the numerical calculation.
4. EXPERIMENTAL RESULTS AND DISCUSSION
Figure 3 shows the pulse-width of the compressed Stokes and energy conversion efficiency with different pump energy. The separated dots are experimental data, and the value of each point is the average value of 30 pump light pulses. The measured pulse widths are averaged over the whole beam. The solid line is the numerical calculation result. It can be seen from Figure 3a that the experimentally obtained data have a good agreement with the numerically calculated curve, and the pulse width of the Stokes is gradually decreasing, with the increase of the energy of the pump light. It is because that with the increase of the pump energy, the front edge of the backward Stokes light interacts with this pump light and obtains much higher amplification. When the pump energy is low, the Stokes width decreases quickly; whereas when the pump energy is high, the Stokes width decreases slowly and tends to a particular value. That means the width is approach to the limit value of pulse compressing. When the pump energy is 340 mJ, the shortest Stokes width was achieved. The corresponding average value of 30 times detection is about 136 ps. But when the pump energy becomes higher, the Stokes pulse width shows a slight increase; two reasons for the phenomenon are as followed: first, it can be attributed to the threshold effect of the SBS. With the increase of pump energy, the proportion of the part of the Gaussian pump pulse that is higher than SBS threshold grows larger and this part will last for a relatively longer time. Thus, the pump duration lasts longer than the exact time of the complete interaction between the forward pump and the backward Stokes, and the residual part of the pump pulse which has not interacted with the first Stokes pulse will solely generate a second backward Stokes pulse. So, two backward Stokes are detected together and show a wider pulse width. Second, optical breakdown, self-focusing, and other nonlinear effects will compete with the SBS progress and influence pulse compressing to some extent under the condition of higher pump energy. Since the Stokes pulse width changes continuously with pump energy variation, this system can serve to realize the output laser pulse with the continuously tunable width.
Numerically calculated and experimentally detected Stokes pulse width (a) and energy conversion efficiency (b) under different pump energy.
In Figure 3b, both the experimental data and the calculated curve show that with the increase of pump energy, the energy conversion efficiency increases. When the pump energy is low, the energy conversion efficiency increases rapidly; when the pump energy is higher than 150 mJ, the energy conversion efficiency increases slowly and tends to a saturation condition attributed to the gain saturation generated by pump depleting. When the pump energy is higher than 400 mJ, the energy conversion efficiency obtains its highest value of 85%. It can be seen from the picture that the two curves have a good agreement with each other.
Figure 4 shows the waveform recorded by the digital oscilloscope (DPO71254) under the condition of the pump energy of 340 mJ. The left one (earlier one) shows the near-Gaussian-shape pump light waveform whose pulse width is 8.1 ns, while the right one (later one) shows the compressed Stokes waveform whose pulse width is 123 ps. In this case, the pump-to-Stokes pulse compression ratio is about 66. The inserted picture illustrates the detail of the output pulse. It can be seen from this picture that there is no intensity fluctuation at the tail of the output pulse, which is obviously shown in Yoshida's work (Yoshida et al., Reference Yoshida, Hatae, Fujita, Nakatsuka and Kitamura2009).
Typical waveform during pulse compression.
Figure 5a indicates the stability of the Stokes pulses when the pump energy is 340 mJ. It can be seen that the majority of the curve is fluctuating between 123 ps and 147 ps with the RMS of 4.1%. Figure 5b indicates the fluctuation of pump pulses and the RMS is 1.1%. According to the traditional explanation, without the seed injecting, the process of SBS initiates from spontaneous Brillouin scattering caused by thermally induced sound waves, so the randomness is inevitable. This character of the sound wave influences the stability of the pulse width and the amplitude of Stokes light. In addition, the vibration of the circumstance and the convection of the medium under ordinary temperature also have and influence on the stability of Stokes light.
The pulse-width stability of (a) Stokes pulses and (b) pump pulses.
5. CONCLUSIONS
In conclusion, this paper demonstrates the realization of a highly efficient laser pulse-width conversion technique (from nanosecond to hundred-picosecond) based on SBS pulse compression with a generation-amplification structure. The heavy fluorocarbon FC-40 was used as the nonlinear medium. With an 8 ns pulse width, 1064 nm wavelength Q-switched Nd:YAG laser as the pump light, we obtained the output of short pulses of which the average width is 136 ps and the minimum one is 123 ps. The stability of the output pulses is about 4.1%, the energy conversion efficiency is about 85%, and the single pulse energy is above 300 mJ. The energy of hundred picoseconds laser pulses can be scaled up to some extent when the pump lasers with larger beam size and higher energy are injected into the medium cell, without the generation of other competing nonlinear effects. Therefore, this kind of laser pulse-width transformation technology shows a high flexibility in practice.
ACKNOWLEDGEMENT
This work is supported by the National Natural Science Foundation of China (Grant No. 61138005 and No. 61378007).



