I. INTRODUCTION
A yield point in polymers is conventionally accepted as the local maximum in the stress–strain curve. At this point, a material ceases to deform elastically in a recoverable manner and undergoes permanent (irreversible) plastic deformation. The yielding phenomenon in semicrystalline polymers has been associated with a morphological change where a spherulitic structure transforms into a fibrillar one.Reference O’Connell and McKenna1–Reference Schultz3 This change occurs through shearing and fragmentation of the crystalline lamellae into blocks which rearrange into the form of parallel microfibrils. The double yield phenomenon has been studied in polyethylene and related copolymers, and their blends and the influence of branching, molecular weight, crystal thickness distribution, and degree of crystallinity have been investigated under different conditions of tensile loading and thermal history.Reference Popli and Mandelkern4–Reference Butler, Donald and Ryan16 Double yielding has also been reported for other semicrystalline polymeric systems such as poly(tetramethylene terephthalate) and its copolymers,Reference Muramatsu and Lando17 polyamide 6 and its composites,Reference Shan, Yang, Xie, Li, Chen and Yang18, Reference Shan, Yang, Yang, Xie, Li and Feng19 polybutylene terephthalate,Reference Shibaya, Ishihara, Yamashita, Yoshihara and Nonomura20 polypropylene,Reference Schrauwen, Janssen, Govaert and Maijer11 and polycarbonate/polyethylene blends.Reference Pan, Li, Ning and Yang21 It has been thought for a long time that the double yield phenomenon is a characteristic of semicrystalline polymers. However, the existence of double yielding in a nanostructured amorphous polymer was recently reported.Reference Adhikari, Buschnakowski, Henning, Goerlitz, Huy, Lebek, Godehardt, Michler, Lach, Geiger and Knoll22
The shape of the stress–strain curve (σ,γ) in the double yield region may exhibit comparable values of the stress of the two maxima or a dominant value of either maximum. It is expected that different deformation mechanisms exist for each yield process. However, the proposed explanation has not been unique. Some possible deformation models and mechanisms have been postulated. For example, it has been proposed that the onset of plastic deformation in semicrystalline polymers is governed by two structurally well-defined processes: a slip of the crystal blocks past each other in the mosaic crystalline structure (called heterogeneous slip) and a homogeneous shear of the crystal blocks (called homogeneous slip).Reference Seguela and Rietsch5, Reference Séguéla and Darras7, Reference Gaucher-Miri and Séguéla10, Reference Yamada and Takayanagi23 These features were discussed in terms of two thermally activated rate processes of plastic deformation.Reference Séguéla and Darras7 Some authors have referred to these types of deformation as fine slip and coarse slip.Reference Schrauwen, Janssen, Govaert and Maijer11, Reference Butler, Donald and Ryan16 Both processes could explain the two yield maxima observed. Analogous findings from tensile experiments were reportedReference Brooks, Ducket and Ward6, Reference Brooks, Unwin, Duckett and Ward14 and showed that the mechanism operating at the first yield point marked the onset of plastic (recoverable) strain, while the mechanism which governs the second yield point is effectively irrecoverable and was associated with a sharp necking of the samples. The yield points have been interpreted mechanically as the yield of two dashpots and the model used to describe the yield is of two Voigt elements (a spring in parallel with a thermally activated Eyring dashpot) in series,Reference Gaucher-Miri and Séguéla10 two nonlinear Maxwell elements in parallel,Reference Brooks, Ducket and Ward6 or as two distinct thermally activated rate processes (parallel association of two Eyring dashpots).Reference Spathis and Kontou24
Another possible explanation for the mechanisms involved in the double yield phenomenon was based on the postulate of a partial melting-recrystallization process during deformation.Reference Popli and Mandelkern4, Reference Lucas, Failla, Smith, Mandelkern and Peacock8 In this regard, recent studies by one of the authorsReference Manzur and Rivas25, Reference Manzur26 were reported on the variations of the degree of crystallinity and mean crystal size as a function of uniaxial elongation on the double yield behavior of a linear low-density polyethylene (LLDPE). Wide-angle x-ray scattering (WAXS) was utilized and the results showed a decrease and then an increase of the degree of crystallinity around the second yield point, suggesting that indeed melting and recrystallization occurs in this region. The mean size of crystallites also detected the partial melting.Reference Manzur and Rivas25, Reference Manzur26
Synchrotron x-ray scattering is a powerful and unique technique that enables the study of polymeric systems in-situ and in real time. Small-angle x-ray scattering (SAXS) probes the microstructure in a scale from approximately 2 to 100 nm, whereas WAXS probes the atomic structure from approximately 0.1 to 2 nm. The combination of high flux and modern instrumentation has enabled the study of polymers under shear and extensional deformation,Reference Agarwal, Somani, Weng, Mehta, Yang, Ran, Liu and Hsiao27–Reference Liu, Hsiao, Fu, Ran, Toki, Chu, Tsou and Agarwal32 to elucidate the crystallization phenomena in semicrystalline polymers,Reference Mitchell, Pople, Andresen and Brownsey33 and to characterize the shear-induced orientation in structured complex fluids.Reference Romo-Uribe, Mather, Chaffee, Han, Briber, Han and Peiffer34–Reference Soubiran, Staples, Tucker and Penfold37 In particular, synchrotron WAXS was applied to uniaxially deformed LLDPE, and it was shown that there is a martensitic transformation around the second yield point as well as interlamellar shearing.Reference Agarwal, Somani, Weng, Mehta, Yang, Ran, Liu and Hsiao27–Reference Butler, Donald and Ryan29 The WAXS studies by one of usReference Manzur and Rivas25, Reference Manzur26 confirmed the martensitic transformation but showed that this has a small contribution to the microstructural changes during the second yielding of LLDPE.
This research focuses on a detailed study of the changes in the nanostructure of LLDPE in the strain regions before, within, and after the double yielding. Uniaxial tensile deformation was applied, and the nanostructure was monitored using time-resolved SAXS. The stress–strain trace was recorded simultaneously to avoid any ambiguity between bulk and microscopic measurements.
II. EXPERIMENTAL
A. Materials
The polymer studied here was a linear LLDPE Dowlex 2101 manufactured by the Dow Chemical Co. (Midland, MI). The polymer has a density of 924 kg/m3 and a melt index of 1.6 g/10 min (190 °C, 2.16 kg), as specified by the manufacturer. Sheets with a uniform average thickness of 1.1 mm and 26 mm width were prepared using a single-screw Brabender extruder. The temperatures at the different zones (two zones in the barrel and one zone in the die) were set at the same value of 150 °C. The extruder’s screw was adjusted at an angular speed of 70 rpm. From these sheets, samples with the standard dumbbell shape with an average width of 5 mm were punched out for tensile tests.
B. In situ SAXS-stress–strain experiments
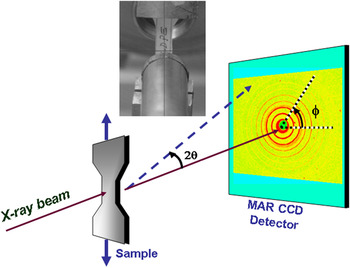
Uniaxial stretching experiments were carried out using a modified tabletop stretching apparatus from Instron Inc. model 4410 (Norwood, MA) described by Hsiao and coworkers.Reference Agarwal, Somani, Weng, Mehta, Yang, Ran, Liu and Hsiao27 The instrument enabled the sample to be stretched symmetrically, therefore, ensuring that the collimated x-ray beam always impinged the same area on the sample during the deformation process. The clamp-to-clamp distance was fixed at 40 mm, and the deformation was carried out at a constant rate of 5 mm/min. Time-resolved x-ray and stress–strain measurements were carried out simultaneously. Synchrotron SAXS measurements were carried out at the Advanced Polymers Beamline (X27C) in the National Synchrotron Light Source, Brookhaven National Laboratory, in Upton, NY. The x-ray radiation was tuned to a wave length of λ = 1.37 Å. A 3-pinhole collimation system was used, and the incident beam was collimated to 600 μm diameter. The two-dimensional (2D) SAXS patterns were recorded using a MAR CCD x-ray detector (MARUSA, Norderstedt, Germany) having a resolution of 512 × 512 pixels (pixel size = 79 μm). The sample-to-detector distance was calibrated using silver behenate and was determined to be 1.70 m. SAXS patterns were recorded every 10 s. Intensity traces are plotted as a function of the magnitude of the scattering vector q (=(4π sin θ) / λ), where 2θ is the scattering angle. Figure 1 depicts the experimental setup.
Experimental setup for in situ small-angle x-ray scattering (SAXS) and stress–strain experiments.

C. Thermal analysis
The thermal transitions were characterized by differential scanning calorimetry using a Pyris1 DSC (Perkin Elmer Inc., Waltham, MA). Temperature and enthalpy calibration were carried out using analytical grade indium (T m = 156.61 °C) and tin (T m = 231.95 °C) and corrections were made for the instrument “baseline.” Samples weighing about 10 mg were loaded into standard aluminum pans. The scans were carried out at 20 °C/min and under nitrogen atmosphere.
III. RESULTS AND DISCUSSION
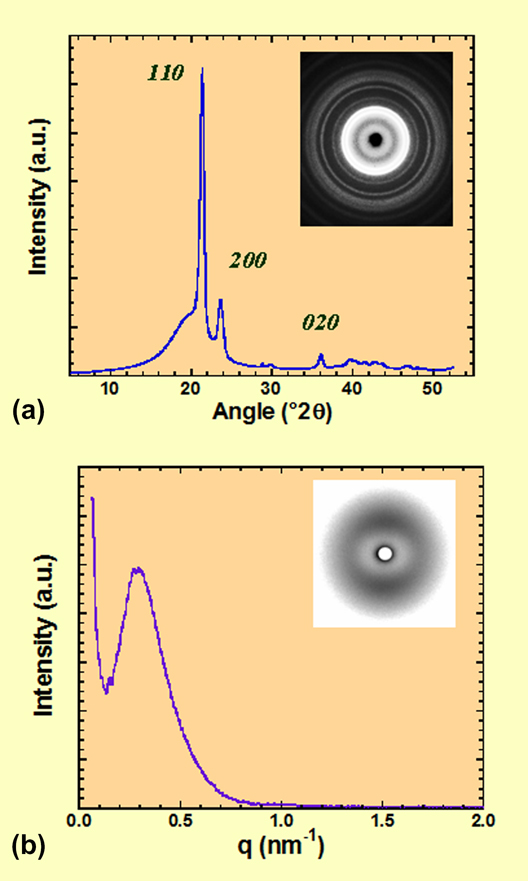
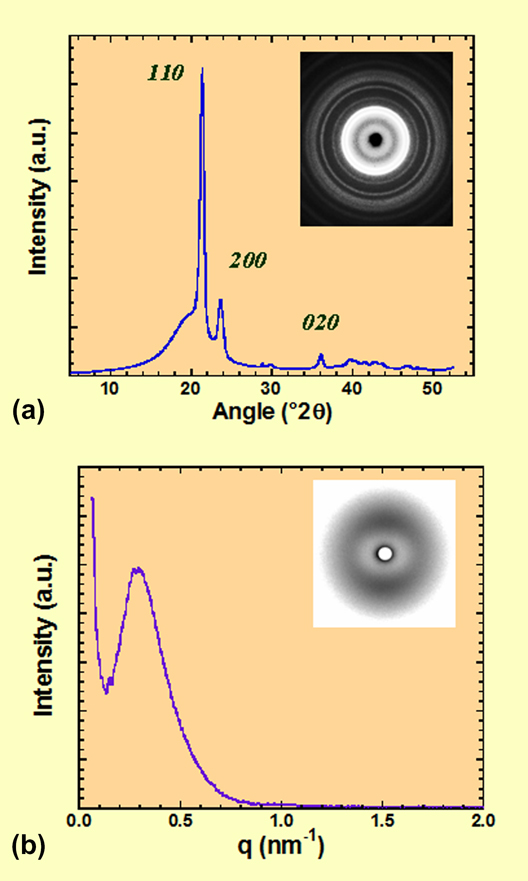
The LLDPE extruded sheets showed an endothermic maximum denoting the melting transition temperature at 123 °C; the onset of melting occurred at 110.6 °C. The enthalpy of fusion was determined to be 110 J/g. From the enthalpy value, the degree of crystallinity χ was estimated to be 37.5% (using the value of heat of fusion of perfect crystalline polyethylene of 293 J/gReference Wunderlich38). The WAXS trace obtained in symmetrical reflection mode (using a Cu target and graphite monochromator) is shown in Fig. 2(a). The inset shows the corresponding 2D WAXS pattern obtained in transmission mode. The pattern shows Debye–Scherrer rings typical of polycrystalline materials. The rings are of uniform intensity, which shows that there is no preferred molecular orientation in the as-extruded sheets. The intensity trace showed crystalline reflections at 21.39° 2θ (4.15 Å), 23.67° 2θ (3.76 Å), and 36.11° 2θ (2.49 Å) that correspond to the 110, 200, and 020 reflections of an orthorhombic crystalline structure typical of polyethylene.Reference Butler, Donald, Bras, Mant, Derbyshire and Ryan28 On the other hand, the SAXS intensity trace of the as-extruded sheet shown in Fig. 2(b) showed a single broad reflection with a maximum at q max = 0.292 nm−1. This pattern is indicative of lamellar morphology, and the long spacing associated with this reflection is 21.5 nm (D = 2π / q max). It was observed some degree of anisotropy in the corresponding 2D SAXS pattern [shown in the inset of Fig. 2(b)], with higher levels of intensity located on the meridional (vertical) axis. This means that there is some degree of orientation in the long-range structure, and this is a consequence of the thermomechanical history associated with the shear and elongation of the sample during the extrusion process.
(a) Wide-angle x-ray scattering (WAXS) intensity trace and (b) SAXS intensity trace of as-extruded low-density polyethylene (LLDPE). Corresponding two-dimensional patterns are shown as insets.
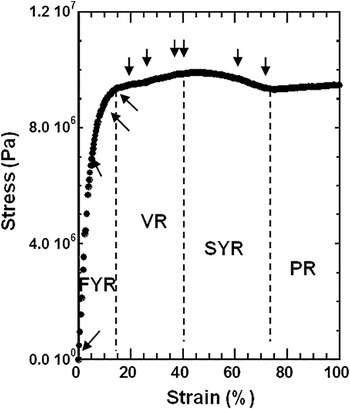
The stress–strain trace obtained at a rate of deformation of 5 mm/min is shown in Fig. 3. The trace shows the typical double yield points with a valley region (VR) in between. The first yield point occurred at an elongation of about 15%, while the second yield point occurred at about 42%. The stress–strain trace shows four regions of the elongation: a first yield region (FYR) for strains smaller than approximately 15%, a VR for strain between 15 and 42%, a second yield region (SYR) for strains between 42 and 75%, and finally a plateau region (PR) for strains greater than 75%, also denoted cold drawn region. The PR above 75% strain corresponds to cold drawing where deformation occurs at constant stress. Above the first yield point, the material ceases to deform elastically in a recoverable manner and undergoes permanent (irreversible) plastic deformation. On the other hand, further deformation above 75% strain the material suffers plastic (irreversible) deformation leading eventually to a fiber-like morphology (see below).
Stress–strain trace for LLDPE obtained at 5 mm/min strain rate and room temperature.

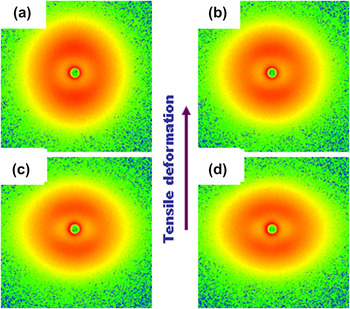
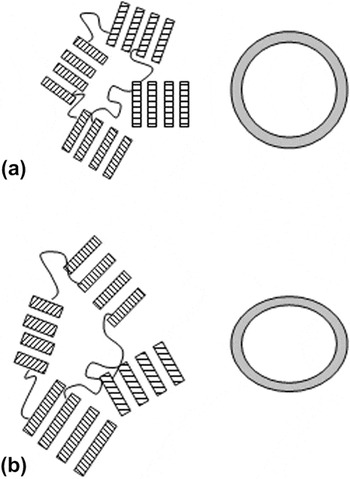
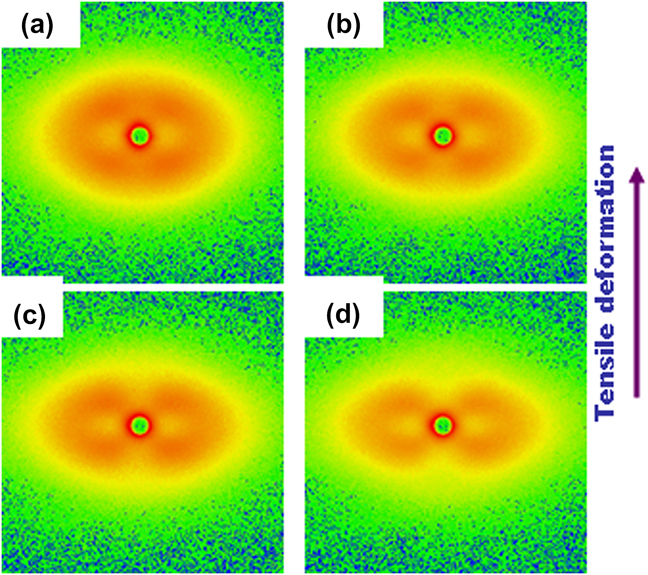
Figure 4 shows a series of selected SAXS patterns obtained at the strains within the FYR (indicated by the first four arrows, from left to right, in the stress–strain trace of Fig. 3). As mentioned above, the SAXS pattern of the undeformed sample [Fig. 4(a)] shows long-range order with an intensity maximum at q = 0.292 nm−1. There is some anisotropy in the intensity distribution, with higher concentration of intensity on the meridional (vertical) axis due to the shear and elongation flow suffered during the extrusion processing of the sample. In the region below the first yield point (SAXS patterns b, c, and d of Fig. 4), the tensile stress increases the anisotropy in the microstructure, consequently the SAXS patterns become ellipsoidal in shape where the meridional reflection shifts gradually to lower angles, whereas the equatorial scattering shifts to larger angles. There is also an overall decrease of intensity. Real and scattering space are reciprocal; therefore, the shift to smaller angles along the meridional axis indicates that the long-range spacing is growing in this direction. On the other hand, the shift to larger angles along the equatorial axis indicates that the long-range periodicity is shrinking along this axis. This trend is continued up to about the first yield point (∼15% strain). In this region, the strain in the material is carried predominantly within the amorphous fraction. WAXS showed that there was no discernible orientation until the first yield point was reached, in agreement with earlier reports.Reference Manzur and Rivas25, Reference Manzur26Figure 5 illustrates schematically the increase in long-range spacing within the elastic FYR. Note that the lamellar spacing increases and the chains in the amorphous regions slightly stretch along the tensile (vertical) axis.
In situ SAXS patterns obtained simultaneously to stress–strain trace within the elastic region [first yield region (FYR)]. Patterns correspond to the strains of: (a) 0, (b) 6, (c) 11, and (d) 15%.

Schematic illustration of the increase of lamellae spacing within the elastic region, FYR. (a) Lamellar clusters with isotropic orientation. (b) Lamellar clusters with increased long-range spacing and amorphous regions slightly deformed under the tensile stress.

The SAXS pattern obtained about the first yield point [Fig. 4(d), strain ≈ 15%) shows the beginning of splitting of each meridional reflection into two off-meridional reflections.
Figures 6(a)–6(d) show selected SAXS patterns obtained within the VR, as shown by arrows in Fig. 3. These patterns show that the VR between the two yield points (15–42% strain) is characterized by the gradual splitting of the meridional reflections into off-meridional reflections (four-point pattern). As the tensile deformation proceeds, the off-meridional reflections rotate toward the equatorial axis. That is, the azimuthal angle between the meridional reflections and the equatorial axis decreases. There is also the appearance of intense small-angle amorphous scattering concentrated around the beam stop. It has been suggested that the transformation of the meridional reflection into off-meridional reflections originates from exhaustion, or “lock” of the interlamellar shear due to almost complete extension of the chain segments immobilized by adjacent crystals and by trapped entanglements.Reference Galeski, Bartczak, Argon and Cohen39
In situ SAXS patterns obtained simultaneously to stress–strain trace between the first and second yield points (i.e., within the valley region, VR). Patterns correspond to the strains of: (a) 22, (b) 27, (c) 38, and (d) 42%.

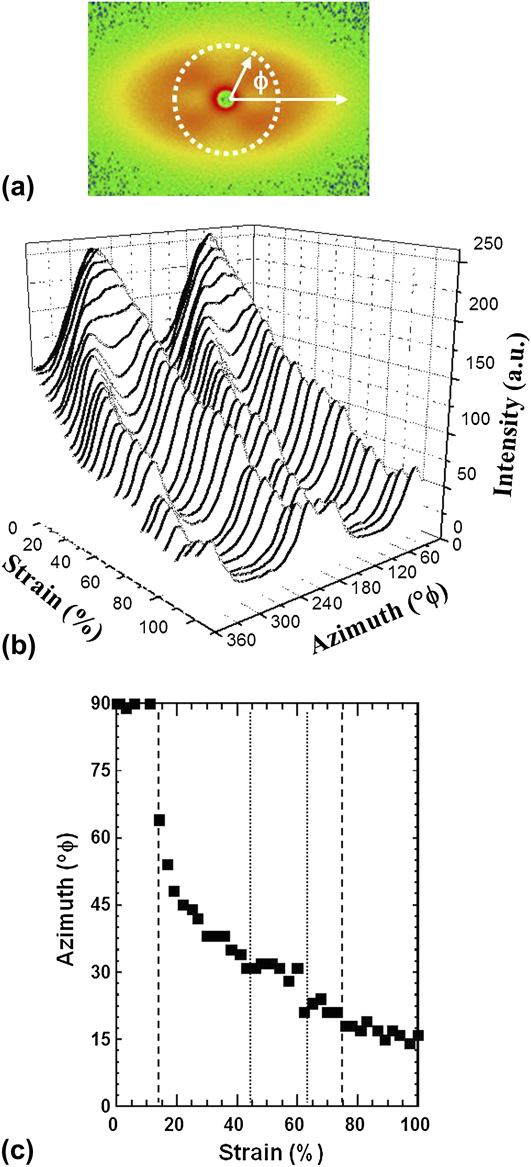
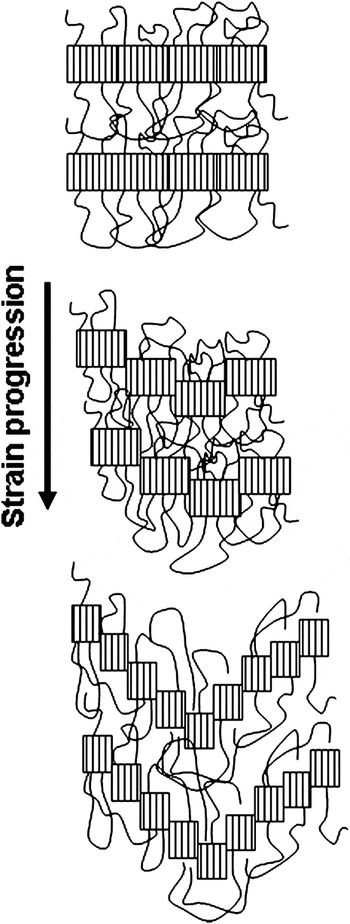
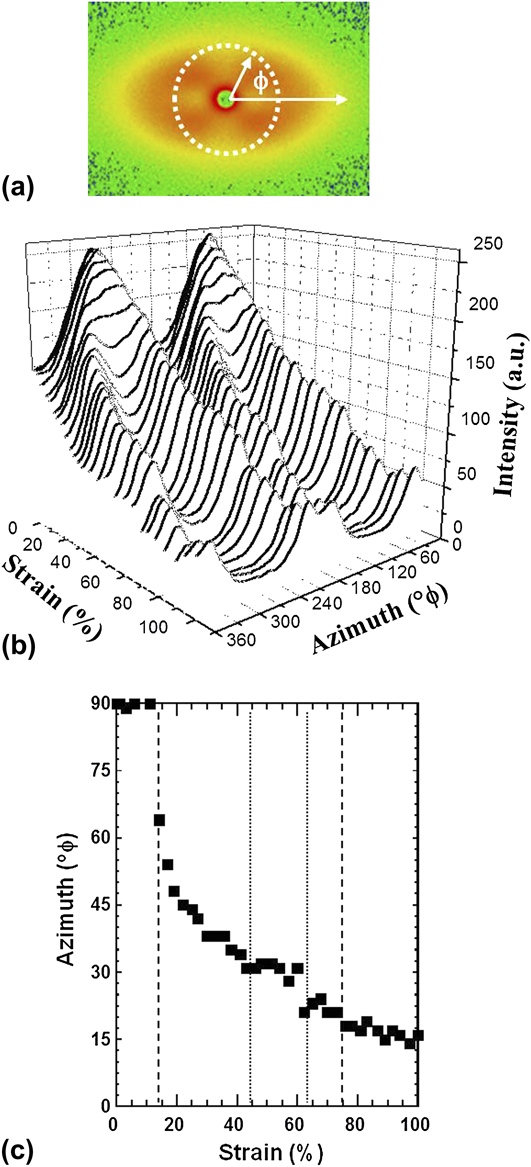
The rotation of the off-azimuthal scattering as a function of strain described above is clearly appreciated by extracting the intensity around the azimuth. Figure 7(a) illustrates the procedure to extract the intensity, at constant q, where φ = 0° corresponds to the equatorial axis and φ = 90° corresponds to the meridional axis. Figure 7(b) shows the three-dimensional (3D) plot of intensity traces as a function of strain deformation and azimuthal angle, at constant q of 0.292 nm−1, i.e., around the long-range maxima. The plot clearly shows the transformation from two maxima (within the FYR) to four maxima in the VR and afterward. Moreover, the plot also shows the rotation of the maxima as the strain deformation increased, where the four maxima tend to merge at the equatorial axis, i.e., φ = 0° and φ = 180°, as summarized in Fig. 7(b). Figure 8 illustrates the deformation of lamellae under tensile deformation where shear forces rotate and deform the lamellae to produce a “staggered roof” morphology responsible for the four-spot SAXS pattern.Reference Wilke, Bratrich, Heise and Peichel40, Reference Androsch, Stribeck, Lupke and Funari41
Intensity traces as a function of strain deformation and azimuthal angle, at constant q = 0.292 nm−1. (a) Schematic illustration of intensity extraction, ϕ = 0° (360°) corresponds to the equatorial axis. (b) Intensity traces around the azimuth. (c) Azimuthal angle, ϕ, as a function of strain.
Schematic illustration of lamellar fragmentation and deformation due to tensile deformation.

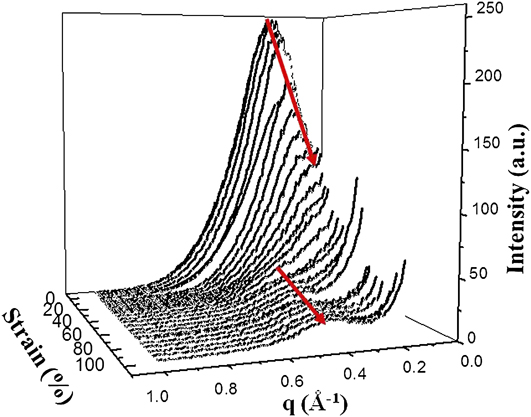
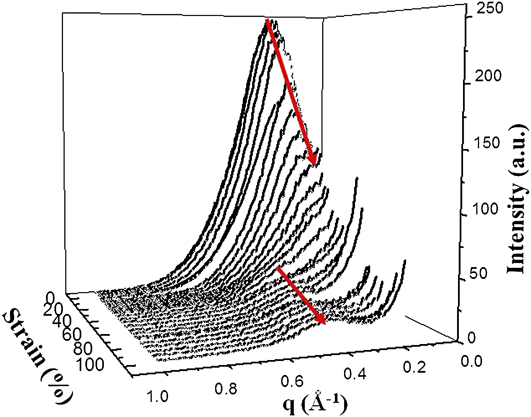
The SYR is very broad and extends from about 42–75% strain. The patterns in Figs. 9(a) and 9(b) exemplify that this region may be characterized by (i) further rotation of the off-meridional reflections as well as thinning of these reflections, (ii) by the increase of small-angle amorphous scattering due to the production of microvoidsReference Alexander42 (also termed microcracksReference Wilke, Bratrich, Heise and Peichel40), (iii) by the shifting of long-period equatorial scattering to larger angles, and (iv) by the reappearance of a meridional reflection. These features are clearly appreciated from the 3D plot of intensity traces extracted along the meridional axis as a function of strain deformation and as a function of the magnitude of the scattering vector, q, shown in Fig. 10.
In situ SAXS patterns obtained simultaneously to stress–strain trace within the second yield region (SYR). Patterns correspond to the strains of: (a) 60 and (b) 73%.

Meridional (extrusion axis) intensity traces as a function of the magnitude of the scattering vector q and strain deformation.
The nanostructural changes occurring in this region (SYR) may be rationalized as follows: because of the connectivity between crystalline lamellae and amorphous regions, both phases must deform simultaneously and cooperatively. Thus, further accommodation of the strain at such conditions must lead to a fast increase of the stress due to network orientation and hardening. Furthermore, there should be an additional concentration of stress in the neighborhood of crystalline–amorphous junction points where tie molecules cross the interface. This process will lead to local cooperative breaking of neighboring lamellae and formation of lamellar kinks. As a result, two lamellar populations develop, each oriented at some acute angle with respect to the tensile axis, which give rise to the four off-meridional reflections (see Fig. 8). Such limited breaking of lamellae relieves some constraints in the amorphous component and some relaxation of the molecular network, which in turn allows for further interlamellar shear.
The SAXS pattern obtained around the maximum of the second yield point [Fig. 9(a), ∼60% strain] shows considerable thinning of the off-meridional reflections and the appearance of a new, rather weak meridional reflection. At strains around and beyond the second yield point, the molecular network would be again near its extensibility limit. However, due to very intense intralamellar slips, lamellae are already thinned considerably, which eventually precipitate slip instabilities and consequently chain slip localization. As a result, an intense fragmentation of lamellae into smaller crystalline blocks occurs, followed by unconstrained rotation of these blocks, which results in the production of a new long period along the tensile axis.
These considerations are supported by the SAXS data shown as 3D plot of the intensity traces along the meridional axis as a function of scattering angle and strain deformation (Fig. 10). This plot clearly summarizes the morphological changes associated with the uniaxial deformation. There is an initial shifting of intensity maxima toward smaller scattering angles suggesting a flow-induced crystallization process. Increasing the strain, the meridional reflection disappears and this is accompanied with an increase of diffuse small-angle intensity. Finally, in the second yield point region, there is a strain-induced meridional reflection at larger scattering angles.
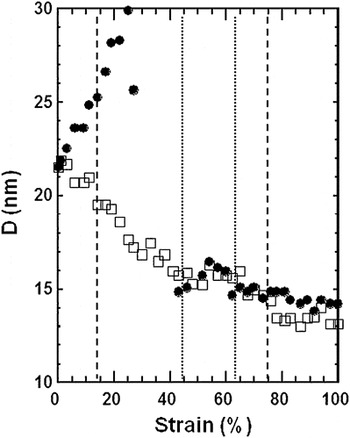
Figure 11 quantifies the evolution of the long period D along the meridional (filled circles) and equatorial (open squares) axes as a function of strain. Up to the first yield point, the material is elastic and deformations are fully recoverable. This process has been associated with an interlamellar shear process and leads to a reorientation of the lamellae, with little or no destruction of the lamellae themselves.Reference O’Connell and McKenna1, Reference Brooks, Unwin, Duckett and Ward14 Moreover, the results in Fig. 11 show significant increase in the long spacing D in this region suggesting a flow-induced crystallization process. Degree of crystallinity measurements agree with these results.Reference Manzur and Rivas25, Reference Manzur26 It is suggested that the tensile deformation of amorphous regions around the original lamellae favor their crystallization and contribute to the increase of D. The fracture of the lamellae occurs in the VR causing a splitting of the meridional reflections into off-meridional reflections and reduction of D along the equatorial axis. Here heterogeneous slip accompanied with lamellae fragmentation begins to take place before the occurrence of the second yield point leading to partial transformation of the material into a fibrillar structure.Reference Gaucher-Miri and Séguéla10
Long-range lamellar spacing along the equatorial (□) and meridional (●) axes.

The second yield point is related to permanent deformation in the specimen, so this yield is associated with a more drastic breakdown in the structure of the polyethylene.Reference Brooks, Ducket and Ward6–Reference Feijoo, Sanchez and Muller9, Reference Brooks, Unwin, Duckett and Ward14, Reference Butler, Donald and Ryan16 The reduction in the D size (occurring before the second yield point) may indicate that the crystalline lamellae, constituting the unoriented material, deformed until the lamellae fragmented. These decrements in the D size may also be associated to melting of smallest crystals. Strikingly, we observed an increment of the long period D values with the elongation at the beginning of the SYR (40 to ∼60% strain, Fig. 11) It is suggested that this increase in D can be ascribed to a recrystallization associated with an observed increase in degree of crystallinity.Reference Manzur and Rivas25, Reference Manzur26 To explain this effect, we suggest that partial melting is produced on the thinnest or less perfect lamellae. Moreover, as these regions melt, molecular chains become available to crystallize on the more perfect crystal lamellae still remaining in the material. This would explain the increase in long-range spacing D as well as the increase in the yield stress at the second yield point. Furthermore, one of us reported an increase in degree of crystallinity within the SYR, in agreement with the findings reported here.Reference Manzur and Rivas25, Reference Manzur26 Therefore, the subsequent decrement of the D values with the elongation after the SYR can be ascribed to the fracture of the newly formed crystalline lamellae.
The abrupt decrement in D observed at the very beginning of the SYR may be in part due to the effect of melting, but the following increment is certainly due to recrystallization. The observed increment of the stress at the second yield point could be expected since, in general, the mechanical properties of polymers and, in particular, the yield stress for linear polyethylene increases with the degree of crystallinity.Reference Kennedy, Peacock and Mandelkern43 Therefore, the increase of crystallinity in the second yield zone, detected through the long spacing D values, must cause the formation of the second yield maximum seen in the stress–strain curve (Fig. 3).
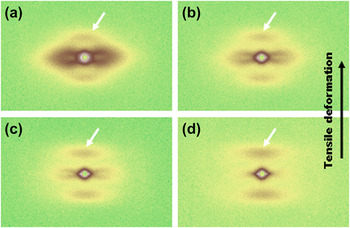
Finally, large deformations in the PR of cold drawing lead eventually to fibril morphology. In this region, the new long period meridional reflection observed in the pattern shown in Fig. 9(b) shifts to even larger scattering angles as the strain increases (i.e., opposite effect to that seen in the region below the first yield point and at the second yield point). Figures 12(a)–12(d) show a series of SAXS patterns obtained after the SYR, i.e., within the cold draw region, and the SAXS patterns correspond to (a) 100, (b) 123, (c) 137, and (d) 153% strain. The patterns show well-defined meridional reflections shifting toward larger q as the strain increased. That is, the lamellar long spacing decreased as strain increased. On the other hand, it is clearly visible the appearance of small-angle amorphous intensity indicating the formation of microvoids (microcavities) in the interlamellar regions during deformation.Reference Butler, Donald and Ryan16 As the strain increased, it can be seen that the small-angle amorphous intensity developed from ellipsoidal-shaped to diamond-shaped indicating the gradual elongation of the microvoids along the extrusion axis.Reference Wilke, Bratrich, Heise and Peichel40, Reference Alexander42 The tensile deformation applied to LLDPE produced deformation and disintegration of lamellae followed by fibrillation. AlexanderReference Alexander42 has shown that microvoids are a logical consequence of the fact that macromolecules cannot efficiently fill all space. Thus, the voids may be unfilled spaces around polymer chains, around fibrils, or between lamellae.Reference Butler, Donald and Ryan16
In situ SAXS patterns obtained simultaneously to stress–strain trace. Patterns correspond to the cold drawn region, strains of: (a) 100, (b) 123, (c) 137, and (d) 153%.

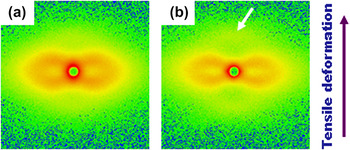
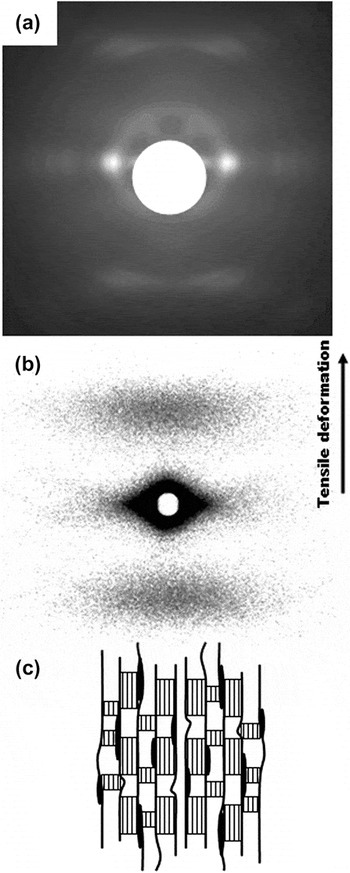
Finally, Fig. 13(a) shows the WAXS pattern obtained at 160% strain. The pattern shows well-concentrated equatorial reflections indicative of the preferred molecular alignment along the tensile axis (vertical, as shown by the arrow). On the other hand, Fig. 13(b) shows the SAXS pattern also obtained at 160% strain. The SAXS pattern shows only broad meridional maxima and intense diamond-shaped diffuse scattering. The meridional maxima are the signature of lamellar morphology. The lamellae that remained during cold drawing are smaller in extension as deduced from the horizontal spread of the meridional reflections. On another hand, the small-angle diffuse scattering is diamond-shaped with the long axes of this diffuse scattering located on the equatorial axis indicating that the microvoids are oriented along the tensile axis. The SAXS diffraction pattern shown in Fig. 13(b) then corresponds to a nanostructure with lamellar structure and anisotropic microvoids oriented along the tensile axis.Reference Butler, Donald and Ryan16, Reference Wilke, Bratrich, Heise and Peichel40, Reference Alexander42 At high stages of deformation (i.e., in the cold drawn region) above 100% strain, the small-angle scattering evolved into a diamond-shaped diffuse scattering (see Figs. 12 and 13), with the longer dimension parallel to the equatorial axis. According to the reciprocity between the dimension of an inhomogeneity and the angular extent of the small-angle scattering, this indicates some elongation of the microvoids in the meridional direction [as shown schematically in Fig. 13(c)]. The increase in equatorial scattering at the expense of meridional scattering is usually observed in drawn polymer fibers.Reference Alexander42
(a) WAXS patterns and (b) SAXS patterns of LLDPE extruded sheet obtained at 160% strain deformation, room temperature. (c) Schematic illustration of microvoids (microcavities) in the interlamellar regions oriented along the fibril direction.Reference Butler, Donald and Ryan16, Reference Wilke, Bratrich, Heise and Peichel40, Reference Alexander42

IV. CONCLUSIONS
Time-resolved synchrotron SAXS was applied to study in detail the nanostructure evolution during uniaxial deformation of linear LLDPE at room temperature. Lamellae deformation, thinning, and re-formation with a new long period were detected during a first and second yield points. The results of this investigation suggest that a melting and recrystallization process characterizes the SYR. These results correlate with an increase of degree of crystallinity and crystal size reported recently by one of the authorsReference Manzur and Rivas25, Reference Manzur26, Reference Manzur44 and would explain the yield stress in this region.
ACKNOWLEDGMENTS
Thanks to Dr. Igor Sics for assistance with the SAXS experiments, and to Prof. B. Hsiao (SUNY-Stony Brook) for useful discussions. The financial support of DGAPA, Universidad Nacional Autonoma de Mexico (PAPIIT Project IN109810) is also acknowledged.