

Introduction
Banana is the fourth most important crop in the developing world. India is the world's largest producer of bananas and plantains, accounting for almost one-fifth of the global production (Padmanaban et al., Reference Padmanaban, Sundararaju, Velayudhan and Sathiamoorthy2001a, Reference Padmanaban, Sundararaju and Sathiamoorthy2001b; Mustaffa and Sathiamoorthy, Reference Mustaffa, Sathiamoorthy, Molina, Eusebio, Roa, Van Den Bergh, Maghuyop and Borromeo2004; Gailce Leo Justin et al., Reference Gailce Leo Justin, Leelamathi and Nirmaljohson2008). Odoiporus longicollis (Olivier) [Order: Coleoptera, Superfamily: Curculionidae, Family: Rhynchophoridae, Genus: Odoiporus, Species: O. longicollis (Olivier)], commonly known as banana stem weevil or banana pseudostem weevil, is a serious pest of bananas in Nepal and India (Simmonds, Reference Simmonds1966; Thapa, Reference Thapa and Neupane1993; Sripriya et al., Reference Sripriya, Padmanaban and Uma2000). Worldwide distribution of O. longicollis (Olivier) includes diverse geographical locations in Africa and Asia (Valmayor et al., Reference Valmayor, Davide, Stanton, Treverrow and Rao1994). Odoiporus longicollis (Olivier) is a monophagous pest of banana, and the larvae and adults cause severe damage affecting the production of bananas (Shukla and Kumar, Reference Shukla and Kumar1970; Ostmark, Reference Ostmark1974; Visalakshi et al., Reference Visalakshi, Nair, Beevi and Amma1989). The larvae feed voraciously on the tissues of the succulent sheath and reach the true stem. Infestation by this pest can occur at different developmental stages of the banana plant. Infestation at the pre-flowering stage results in non-emergence of the flower. Due to the tunnelling activity of the larvae, the stem rots and falls down, due to loss of tensile strength (Padmanaban and Sathiamoorthy, Reference Padmanaban and Sathiamoorthy2001). The banana plants are also damaged indirectly by the tunnelling activity of the larvae, because the damaged areas provide easy access to rot-promoting organisms (Gold et al., Reference Gold, Pena and Karamura2001). The loss varies from 10% to almost 90% depending on the stage of plant growth at which pest infestation occurs and also the efficiency of the management or cultivation practice that is followed (Padmanaban and Sathiamoorthy, Reference Padmanaban and Sathiamoorthy2001).
The present strategies for the control of this pest mainly include cultural practices and use of pesticides. Cultural practices, which include selection of clean planting material, systematic trapping of adult weevils with pseudostem traps, mulching and field sanitation, requires high labour input and material requirements, which are not economical (Sikora et al., Reference Sikora, Bafokuzaka, Mbwana, Oloo, Uronu and Seshu Reddy1989; Padmanaban and Sathiamoorthy, Reference Padmanaban and Sathiamoorthy2001). The use of pesticides also has the following drawbacks: (i) pesticides are not environment friendly; (ii) as the weevils and larvae are cryptic, they are not easily accessible to the pesticides; (iii) there is a possibility of this pest developing resistance to some of the commonly used pesticides (Padmanaban and Sathiamoorthy, Reference Padmanaban and Sathiamoorthy2001). Biological control methods, which include the use of arthropods, entomopathogenic nematodes, fungi, and organisms such as Beauveria bassiana, Steinernema and Heterorhabditis spp., are still in their preliminary stages (Padmanaban and Sathiamoorthy, Reference Padmanaban and Sathiamoorthy2001). Moreover, their economic cost and efficacy limits their use for large-scale use.
Management of O. longicollis (Olivier) is a pre-requisite to sustaining productivity and to obtaining higher economic returns of bananas and plantains. A critical aspect for developing a successful integrated pest management (IPM) strategy for the control of this pest is the study of the population structure of the pest, i.e. assessing the genetic variability of the pest between and within locations and how this variability is partitioned geographically. In the present work, the rDNA internal transcribed spacers I and II have been used to assess the genetic diversity of O. longicollis individuals collected from six hotspot locations in India.
The ribosomal gene cluster has become a useful tool for classifying/diagnosing organisms at various taxonomic levels. The arthropod rDNA consists of tandem arrays of a repeating unit of genes encoding the external transcribed spacer, 18S, 5.8S, and 28S rRNA, and two internal transcribed spacers: ITS1 located between 18S and 5.8S genes, and ITS2 located between 5.8S and 28S genes. The low level of evolutionary constraint on these spacers and the process of concerted evolution reduces the intra-specific diversity as compared to inter-specific divergence and this leads to the fixation of alternative DNA variants in geographically isolated populations (Navajas et al., Reference Navajas, Lagnel, Gutierrez and Boursot1998). Hence these regions have been highly useful for studying phylogenetic relationships at the inter- and intra-population level in insects (Collins and Paskewitz, Reference Collins and Paskewitz1996; Tang et al., Reference Tang, Toe, Back and Unnasch1996; Mukabayire et al., Reference Mukabayire, Boccolini, Lochouarn, Fontenille and Besansky1999; Depaquit et al., Reference Depaquit, Ferté, Léger, Killik-Kendrick, Rioux, Killick-Kendrick, Hanafi and Gobert2000; Muccio et al., Reference Muccio, Marinucci, Frusteri, Maroli, Pesson and Gramiccia2000; Bebee et al., Reference Bebee, Maung, van den Hurk, Ellis and Cooper2001; Presa et al., Reference Presa, Pardo, Martínez and Bernatchez2002; Young and Coleman, Reference Young and Coleman2003; Yahia et al., Reference Yahia, Ready, Hamdani, Testa and Guessous-Idrissi2004; Lorenz-Lemkwe et al., Reference Lorenz-Lemkwe, Muschner, Bonatto, Cervi, Salzano and Freitas2005; Weider et al., Reference Weider, Elser, Crease, Mateos, Cotner and Markow2005).
In the present work, we used the primary sequences of both these ITS regions to study the genetic diversity of O. longicollis weevils collected from six locations in India. Our results indicate that these locations are not genetically differentiated, suggesting gene flow between the locations. Such information is vital, since gene flow and dispersal of the pest are important factors to consider while designing and implementing management programmes for its effective control.
Materials and methods
Sample collection
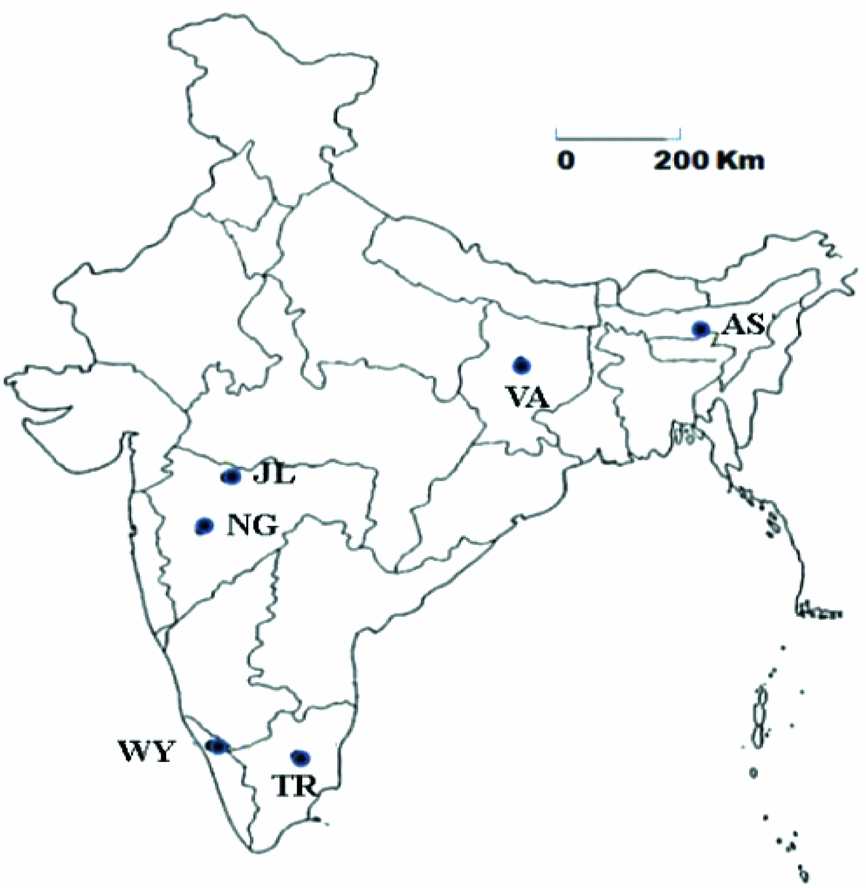
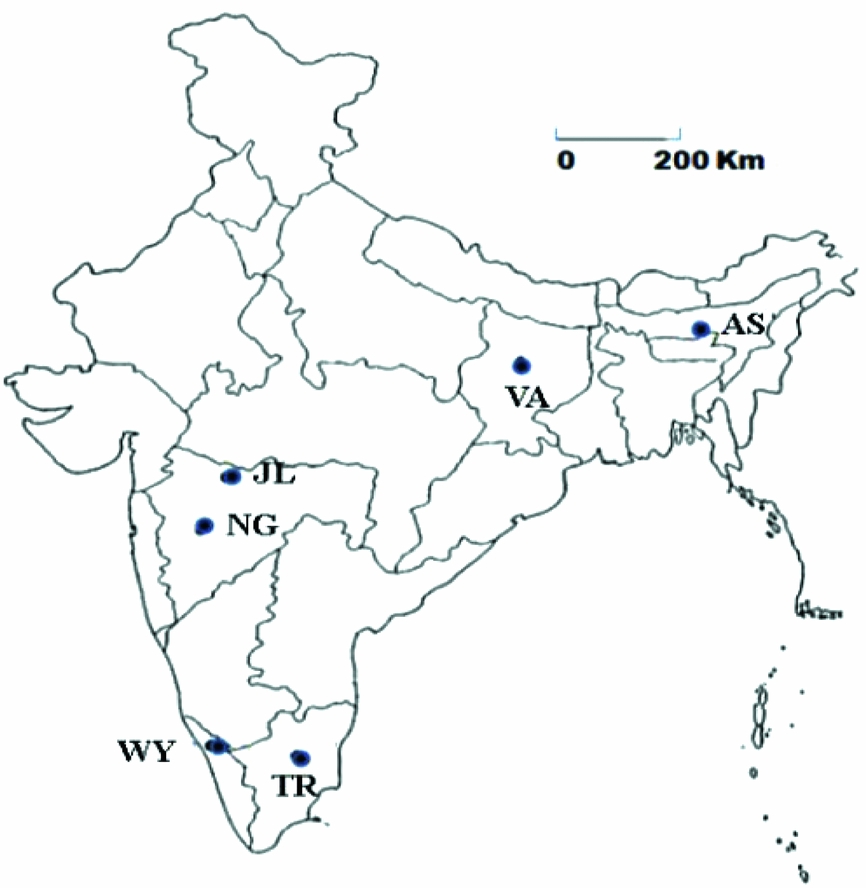
Five adults (three females and two males) of O. longicollis (Olivier) were collected from infested banana stems in banana fields from each of the following six locations: Kamrup (Assam), Vaishali (Bihar), Wayanad (Kerala), Jalgaon and Narayangaon (Maharashtra) and Trichy (Tamil Nadu) (Fig. 1), i.e. a total of 30 individuals. In each location, the five individuals were collected within an area of 500 m2.
Geographic distribution of the locations of Odoiporus longicollis (Olivier) used in this study. The letters are abbreviations referring to the collection sites. The states are given in parentheses and the geographical coordinates are shown in square brackets. AS: Kamrup (Assam) [26° 18′ 57.89″ N; 91° 35′ 54.22″ E]; VA: Vaishali (Bihar) [26° 0′ 15.99″ N; 85° 4′ 50.00″ E]; WY: Wayanad (Kerala) [11° 42′ 11.54″ N; 76° 5′ 0.24″ E]; JL: Jalgaon (Maharashtra) [20° 59′ 52.74″ N; 75° 34′ 0.15″ E]; NG - Narayangaon (Maharashtra) [19° 7′ 22.45″ N; 73° 58′ 37.65″ E]; TR: Trichy (Tamil Nadu) [19° 53′ 35.28″ N; 73° 43′ 52.63″ E].
DNA extraction
Total genomic DNA was extracted from individual beetles as described by Shankar et al. (Reference Shankar, Kulkarni and Sunil Kumar2015). Briefly, a whole beetle was crushed to a fine powder in liquid nitrogen using a mortar and pestle. The powder was suspended for 15 min at 65 °C in pre-warmed extraction buffer (100 mm Tris (pH 8), 50 mm of EDTA 500 mm NaCl, 1.25% SDS, 10 mm β-mercaptoethanol). This was followed by the addition of 400 µl of chilled 5 m potassium acetate per ml of the suspension. The suspension was then kept on ice for 1 h followed by centrifugation at 10,000 rpm for 10 min at 10 °C. An equal volume of chloroform/isoamyl alcohol mixture (24:1) was added to the supernatant and mixed, followed by centrifugation at 10,000 rpm for 10 min at 10 °C. The DNA was precipitated from the aqueous layer by mixing with 750 µl of isopropyl alcohol per ml of the aqueous layer. The tubes were kept overnight at room temperature to allow the DNA to precipitate. The precipitated DNA was collected by centrifugation at 10,000 rpm at 10 °C for 10 min and washed with 70% chilled alcohol. The DNA was air dried and dissolved in T10E1 buffer (pH 8.0). The DNA solution was treated with RNase (50 µg/ml) and the solution was deproteinized by mixing with an equal volume of phenol/chloroform: isoamyl alcohol mix and then precipitated as described above. The DNA was dissolved in T10E1 (pH 8.0). The concentration of the extracted DNA was determined by agarose gel electrophoresis using λ DNA of known concentration as a standard.
Amplification of the ITS1 and ITS2 fragments and DNA sequencing
ITS1 and ITS2 fragments were amplified using the primer pairs R5/R6 and R8/R9, respectively (Malloch et al., Reference Malloch, Fenton and Goodrich2001; Szalanski and Owens, Reference Szalanski and Owens2003). PCR was carried out in a total reaction volume of 25 µl consisting of 25 ng DNA, 0.1 mm dNTPs, 100 pmol of each primer and 0.5 U Taq DNA Polymerase. PCR conditions were as follows: pre-denaturation at 94 °C for 5 min followed by 30 cycles of denaturation at 94 °C for 45 sec; primer annealing at 54 °C for 45 sec; primer extension at 72 °C for 2 min; and then cycling was followed by a final extension at 72 °C for 20 min. The PCR product was elctrophoresed on an agarose gel and the band of the expected size was eluted from the gel using SNAP columns (Invitrogen). The PCR product was then cloned into pCR4 TOPO vector (Invitrogen) and transformed into E. coli Top10 host cells (Invitrogen), according to the manufacturer's instructions. Recombinants were selected by plating the transformed cells on LB medium containing 100 µg/ml of ampicillin. Colonies carrying the insert were identified by colony PCR, which was carried out by the same primer pair used to amplify the ITS1/ITS2 fragments using the PCR conditions as described above. DNA sequencing was carried out using the BigDye® Terminator v3.1 Cycle Sequencing Kit (Applied Biosystems, Life Technologies) and capillary electrophoresis was performed on a 3130 Genetic Analyzer (Applied Biosystems, Life Technologies). The ITS1 and ITS2 sequences have been deposited in GenBank (KF225405 – KF225431 for ITS1; KF225435 – KF225461 for ITS2) (Table S1).
Data analysis
DNA sequence data were analysed using Sequencing Analysis 5.2 software. Discrepancies in the DNA sequence chromatograms between forward and reverse sequences were resolved using the Chromas software v 2.01 (http://www.technelysium.com.au/chromas.html). EBI MUSCLE was used to generate the alignments of the sequences (Edgar, Reference Edgar2004a, b). DAMBE v 5.3.27 was used to estimate the extent of saturation of nucleotide substitutions using Xia's test (Xia, Reference Xia2013). The ITS1 and ITS2 sequence data sets were concatenated using DnaSP v 5.10 (Librado and Rozas Reference Librado and Rozas2009). The haplotype data file was generated using DnaSP v 5.10 and then imported into MEGA v6 to determine the best fit model for phylogenetic analysis and to generate the Maximum Likelihood trees (Tamura et al., Reference Tamura, Stecher, Peterson, Filipski and Kumar2013). Statistical support for the inferred nodes was obtained by bootstrapping (1000 replicates). DnaSP v 5.10 was used for: (i) determining haplotype and nucleotide diversity; (ii) estimating genetic differentiation; (iii) computing values for Tajima's D (Tajima, Reference Tajima1989), Fu's Fs (Fu, Reference Fu1997) and R2 (Ramos-Onsins and Rozas, Reference Ramos-Onsins and Rozas2002) tests; and (iv) studying the mismatch distribution and determining the raggedness (r) index of the mismatch distribution curves. The significance of all these tests was determined by coalescent simulations also implemented in DnsSP v 5.10. AMOVA and correlation between genetic distance and geographical distance were computed by Mantel test using GenAlEx v 6.501 software (Peakall and Smouse, Reference Peakall and Smouse2006). To describe the phylogeographic and genetic relationships between haplotypes, median-joining haplotype networks were computed using Network v 5.0 (Bandelt et al., Reference Bandelt, Forster and Röhl1999).
Results
Sequence analysis of the ITS1 region
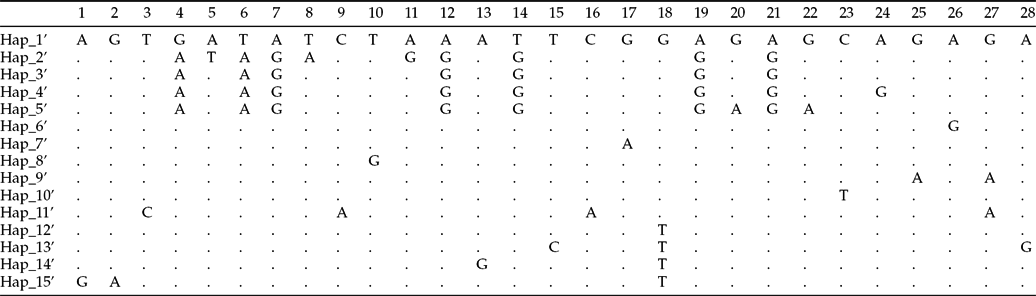
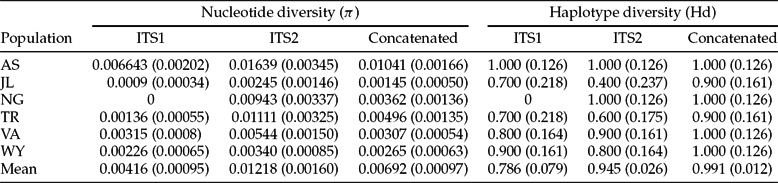
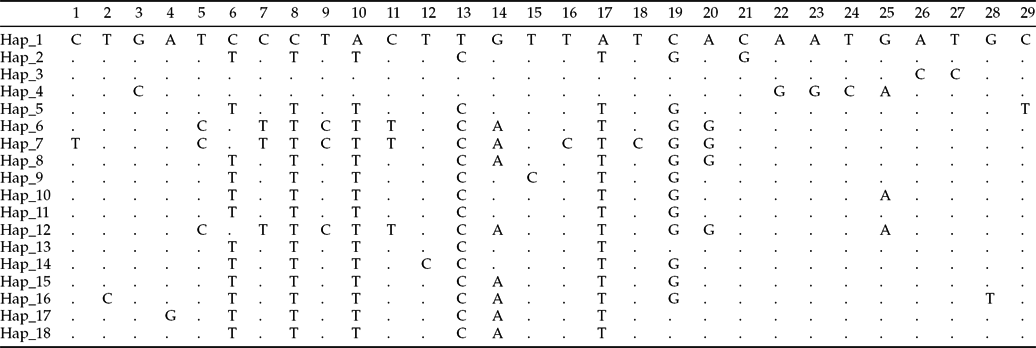
The presumptive boundaries between 18S and ITS1, and ITS1 and 5.8S were determined by comparison with the ITS1 sequence of southern corn rootworm (Genus Diabrotica; Coleoptera, Chrysomelidae) (Szalanski and Owens, Reference Szalanski and Owens2003). The length of the ITS1 sequences ranged between 885 bp and 909 bp and the base composition was biased with a mean GC content of 37.64% (Table S1). MUSCLE alignment of the 30 ITS1 sequences generated 837 invariable monomorphic sites and 28 variable sites, of which 12 were parsimony informative (Fig. S1a). The 28 polymorphic sites, of which 19 were transitions (16 A–G and three C–T transitions) and nine were transversions (four A–T, two A–C and three G–T), gave rise to 15 haplotypes (Table 1). The haplotypes differed in the number of simple repeats, which gave rise to 11 indels (Fig. S1a and Table S2a). The intra-location nucleotide diversity ranged from 0 (Narayangaon) to 0.00643 (SD ±0.00202) (Assam) with a mean nucleotide diversity of 0.00416 (SD ±0.00095, while the mean haplotype diversity (Hd) was 0.786 (SD ±0.079) (Table 2).
Variable nucleotide sites in the 16 haplotypes identified in the 30 ITS1 sequences of Odoiporus longicollis (Olivier) individuals.

AS: Kamrup; JL: Jalgaon; NG: Narayangaon; TR: Trichy; VA: Vaishali; WY: Wayanad.
Individuals having a particular IS1 haplotype are as follows:
HAP 1: AS 1, JL 1, JL 2, JL 4, NG 1, NG 2, NG 3, NG 4, NG 5, TR 1, TR 2, TR 5, VA 1, VA 4; HAP 2: AS 2;
HAP 3: AS 3; HAP 4: AS 4; HAP 5: AS 5; HAP 6: JL 3; HAP 7: JL 5; HAP 8: TR 3; HAP 9: TR 4;
HAP 10: VA 2; HAP 11: VA 3, VA 5; HAP 12: WY 1, WY 3; HAP 13: WY 2; HAP 14: WY 4; HAP 15: WY 5.
Diversity indices of the ITS1, ITS2 and concatenated ITS1+ITS2 sequences of the individuals of Odoiporus longicollis (Olivier) from six locations

AS: Kamrup; JL: Jalgaon; NG: Narayangaon; TR: Trichy; VA: Vaishali; WY: Wayanad. Standard deviation values are indicated in parentheses.
Geographical structure and demographic analysis
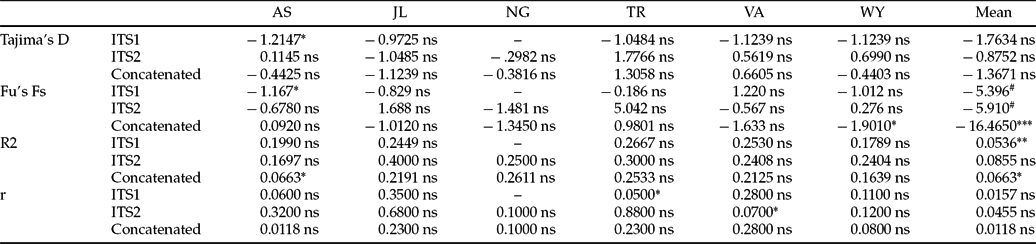
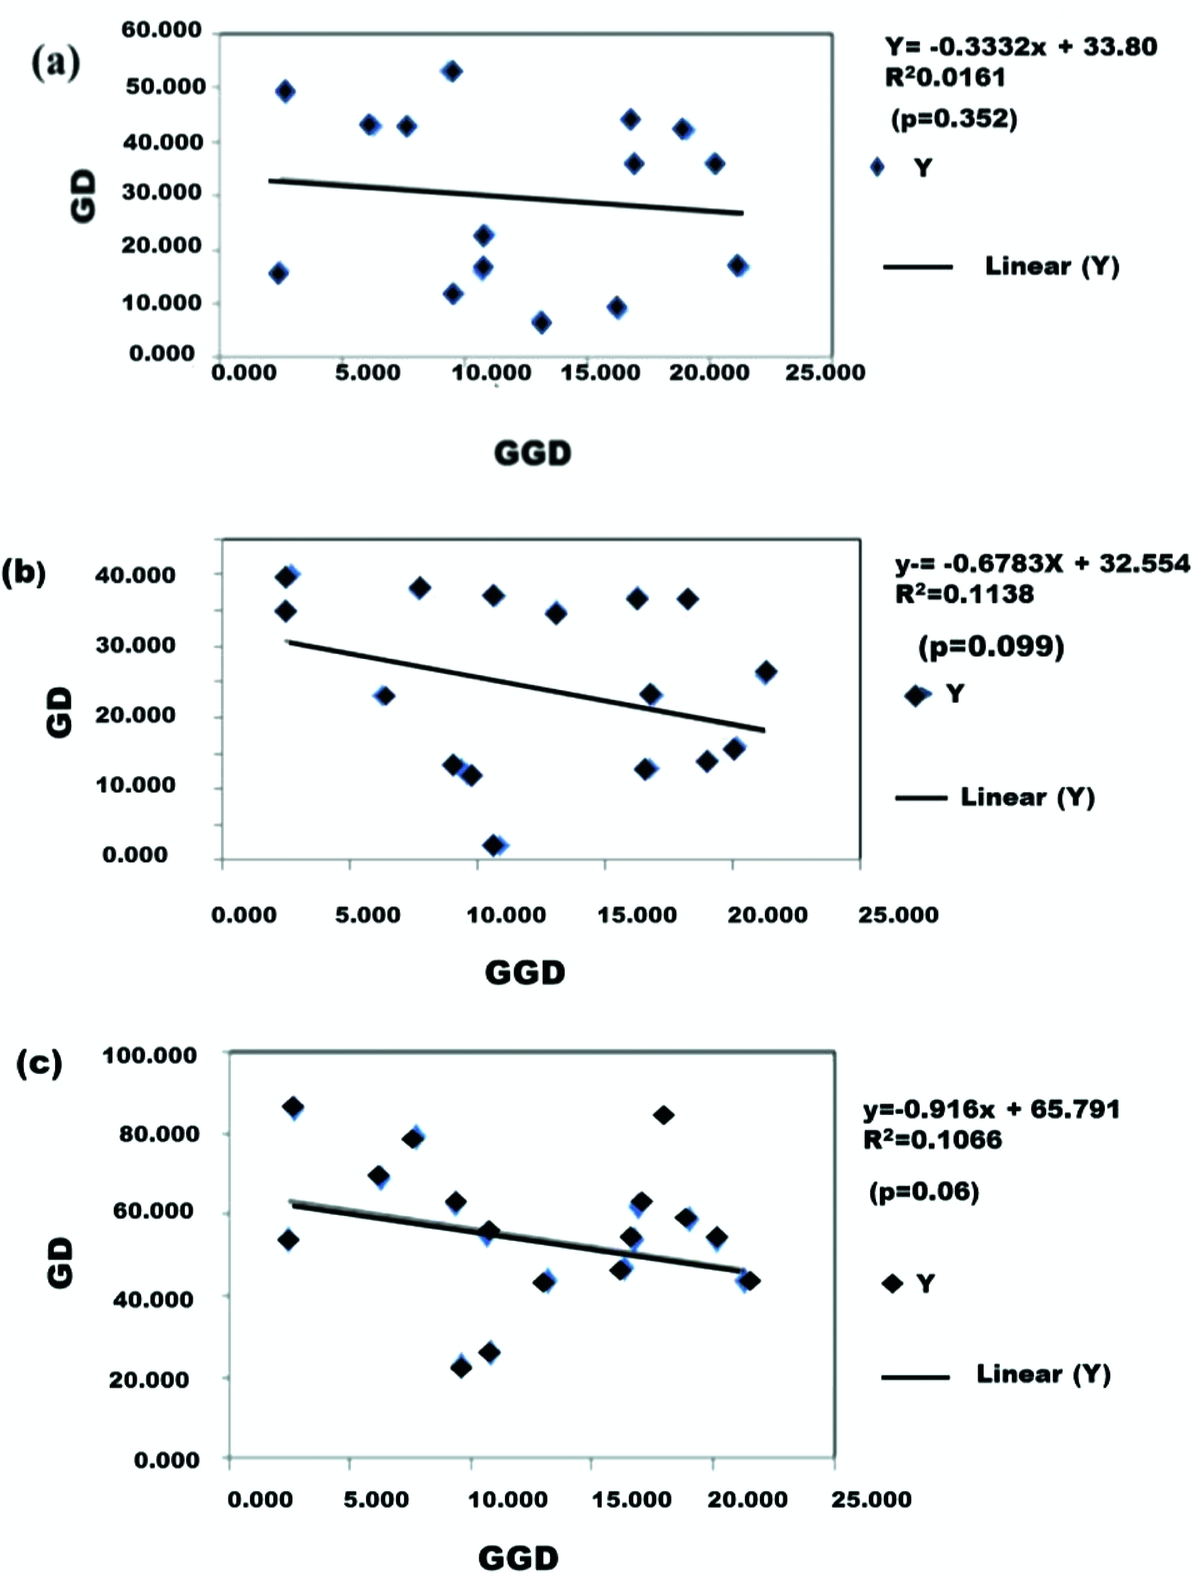
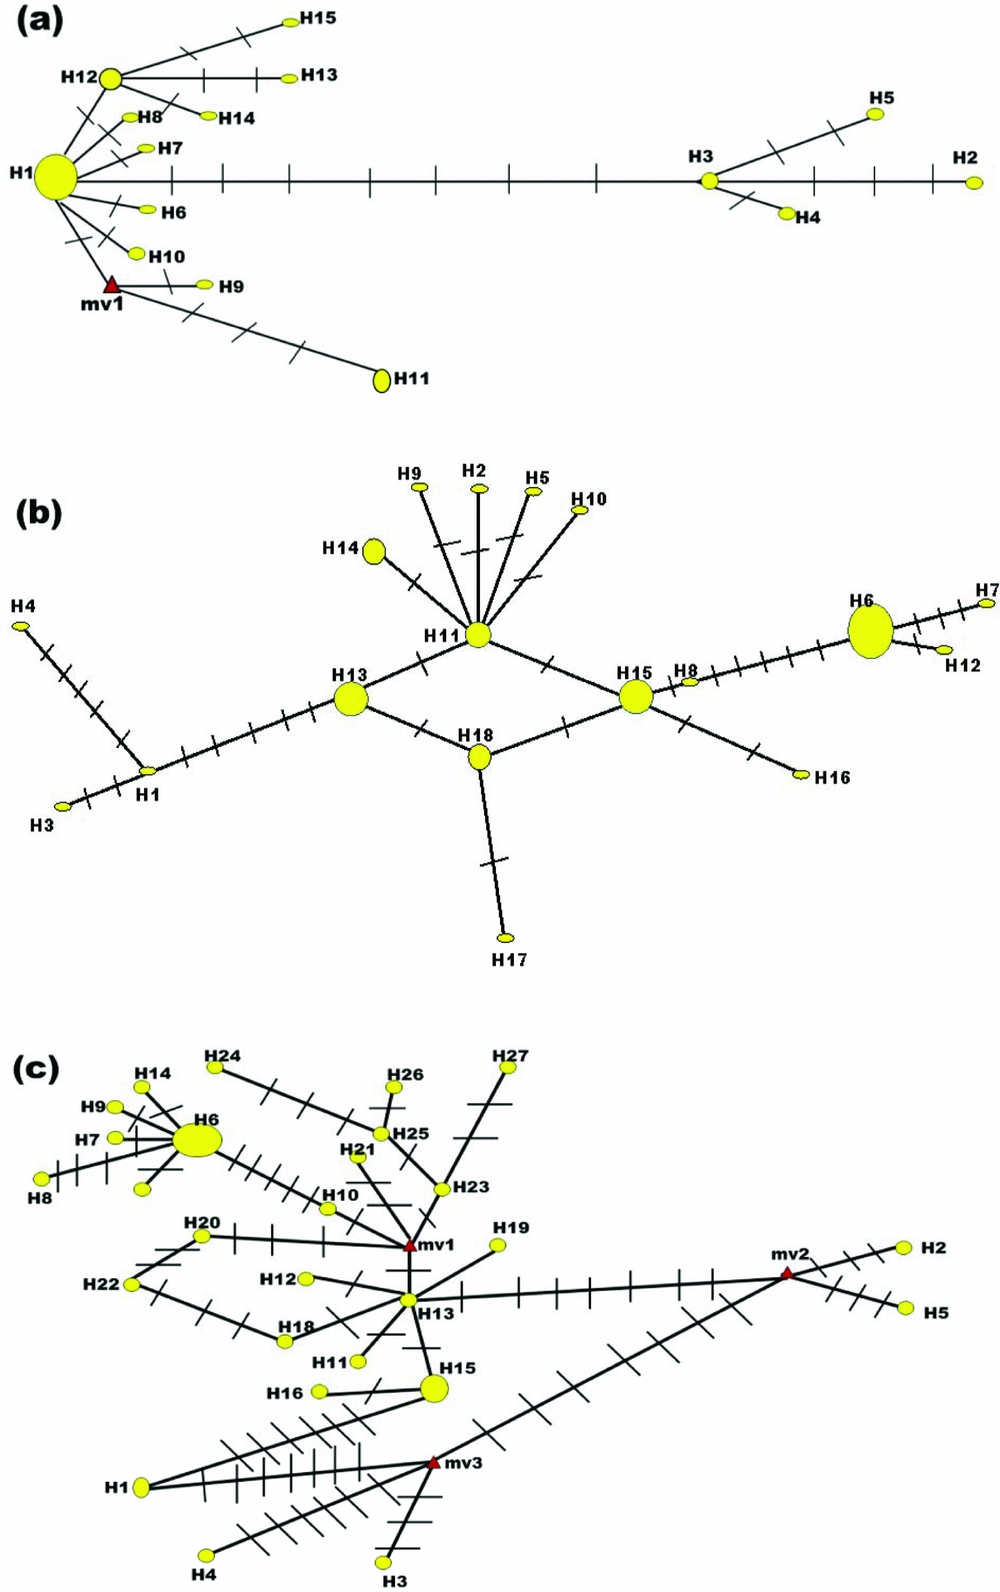
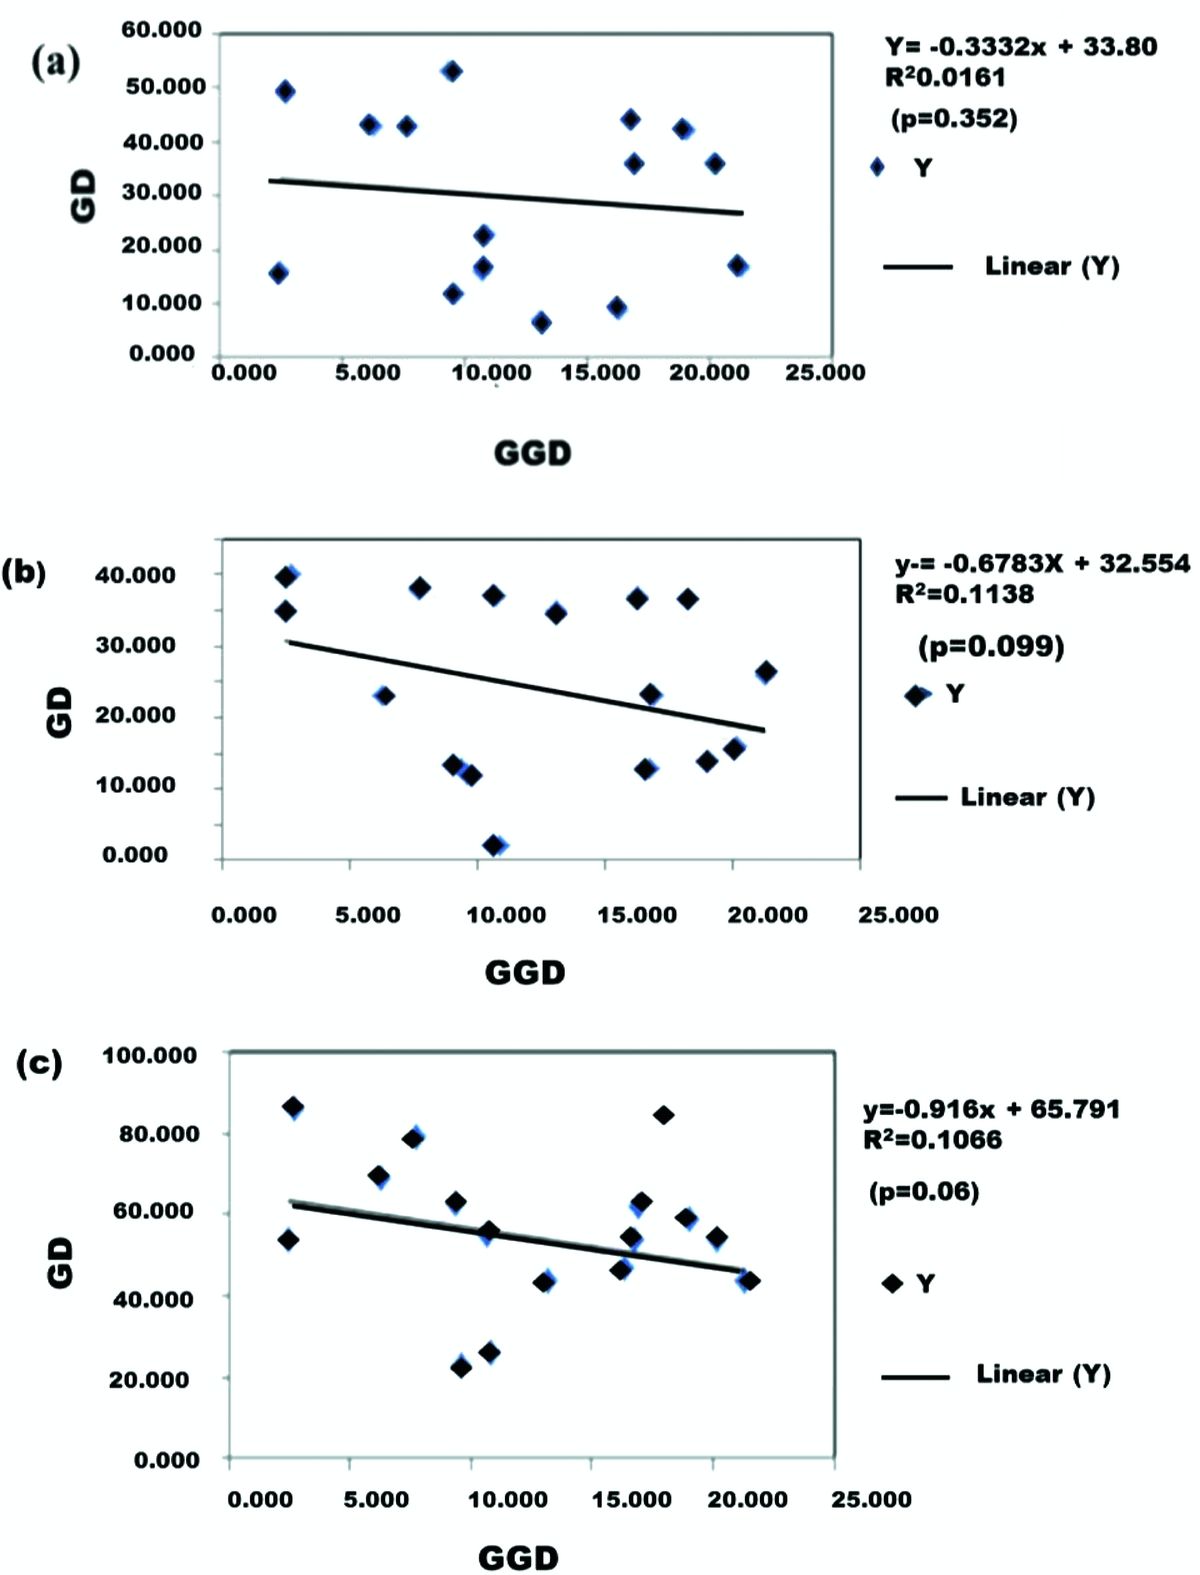
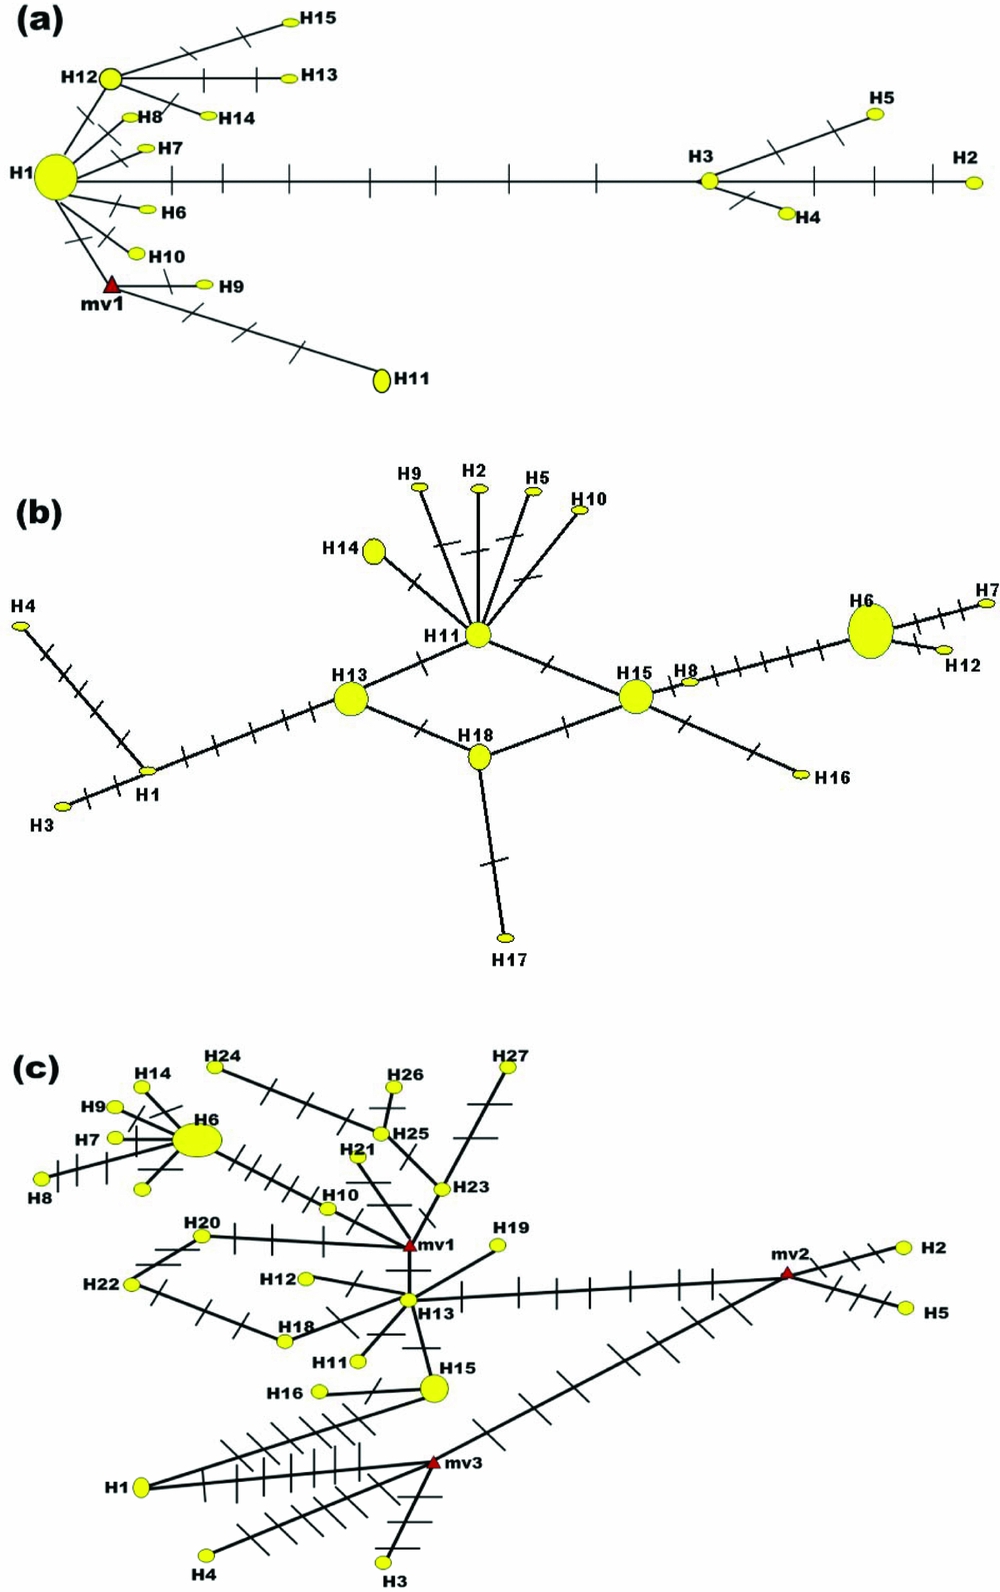
Results of AMOVA show that the genetic variation within locations was 47% while that between locations was 53%, indicating relatively little geographical structure (Table S3a). Genetic differentiation estimates using DnaSP v.5.10. for the entire dataset (Gst: 0.127; Nm: 1.72; χ 2 = 86.571; P=0.0872; df = 70), as well as between pairs of locations were non-significant confirming no geographical sub-structuring, thereby suggesting gene flow between the locations (Table 3). The absence of geographical structure was also confirmed by the Mantel test, which showed lack of strong correlation between genetic distance and geographical distance (R 2 = 0.0161; P = 0.352) (Fig. 2a). The haplotype network shows the most frequent haplotype 1, which is present in 14 individuals from five locations, with many singleton haplotypes around it, which could be a signature of a rapid population expansion (Fig. 3a). The values of the various parameters of demographic analysis are shown in Table 4. The negative Tajima's D value indicates an excess of rare nucleotide site variants compared to what would be expected under a neutral model of evolution. However, this negative value was non-significant. Fu's Fs, which is more powerful in detecting population expansion, was negative and significant (P<0.02), indicating an excess of rare haplotypes over what would be expected under neutrality. Value of R2 was also significant confirming population expansion. The mismatch distribution curves were unimodal and the r (raggedness index) values for the mismatch distributions were non-significant, confirming population expansion (Table 4, Fig. S2a).
Estimates of genetic differentiation between individuals of Odoiporus longicollis (Olivier) from six locations based on the ITS1 sequence data

AS: Kamrup; JL: Jalgaon; NG: Narayangaon; TR: Trichy; VA: Vaishali; WY: Wayanad. Overall: χ2 = 86.571 (df = 70); Fst: 0.4813, Nm = 0.27; Gst = 0.1270. Nm = 1.72 (ns) (ns: non-significant P value; *: 0.01<P<0.05).
Results of demographic tests

AS: Kamrup; JL: Jalgaon; NG: Narayangaon; TR: Trichy; VA: Vaishali; WY: Wayanad. (ns: non-significant p value; *0.01<P<0.05; **0.001<P<0.01; ***P<0.001); #P<0.02.
Correlation between genetic distance (GD) and geographic distance (GGD) (Mantel test) based on (a) ITS1 region, (b) ITS2 region, and (c) concatenated data of ITS1 + ITS2.
Haplotype network inferred using the ‘Median Joining’ option in Network v 5.0.01. (a) ITS1, (b) ITS2, (c) concatenated data of ITS1 + ITS2. The nodes are shown as yellow circles and are proportional to the haplotype frequency. Each number across a median represents a mutated nucleotide position. The red triangles are unsampled or missing intermediates. H: haplotype.
Phylogenetic analysis based on the ITS1 region
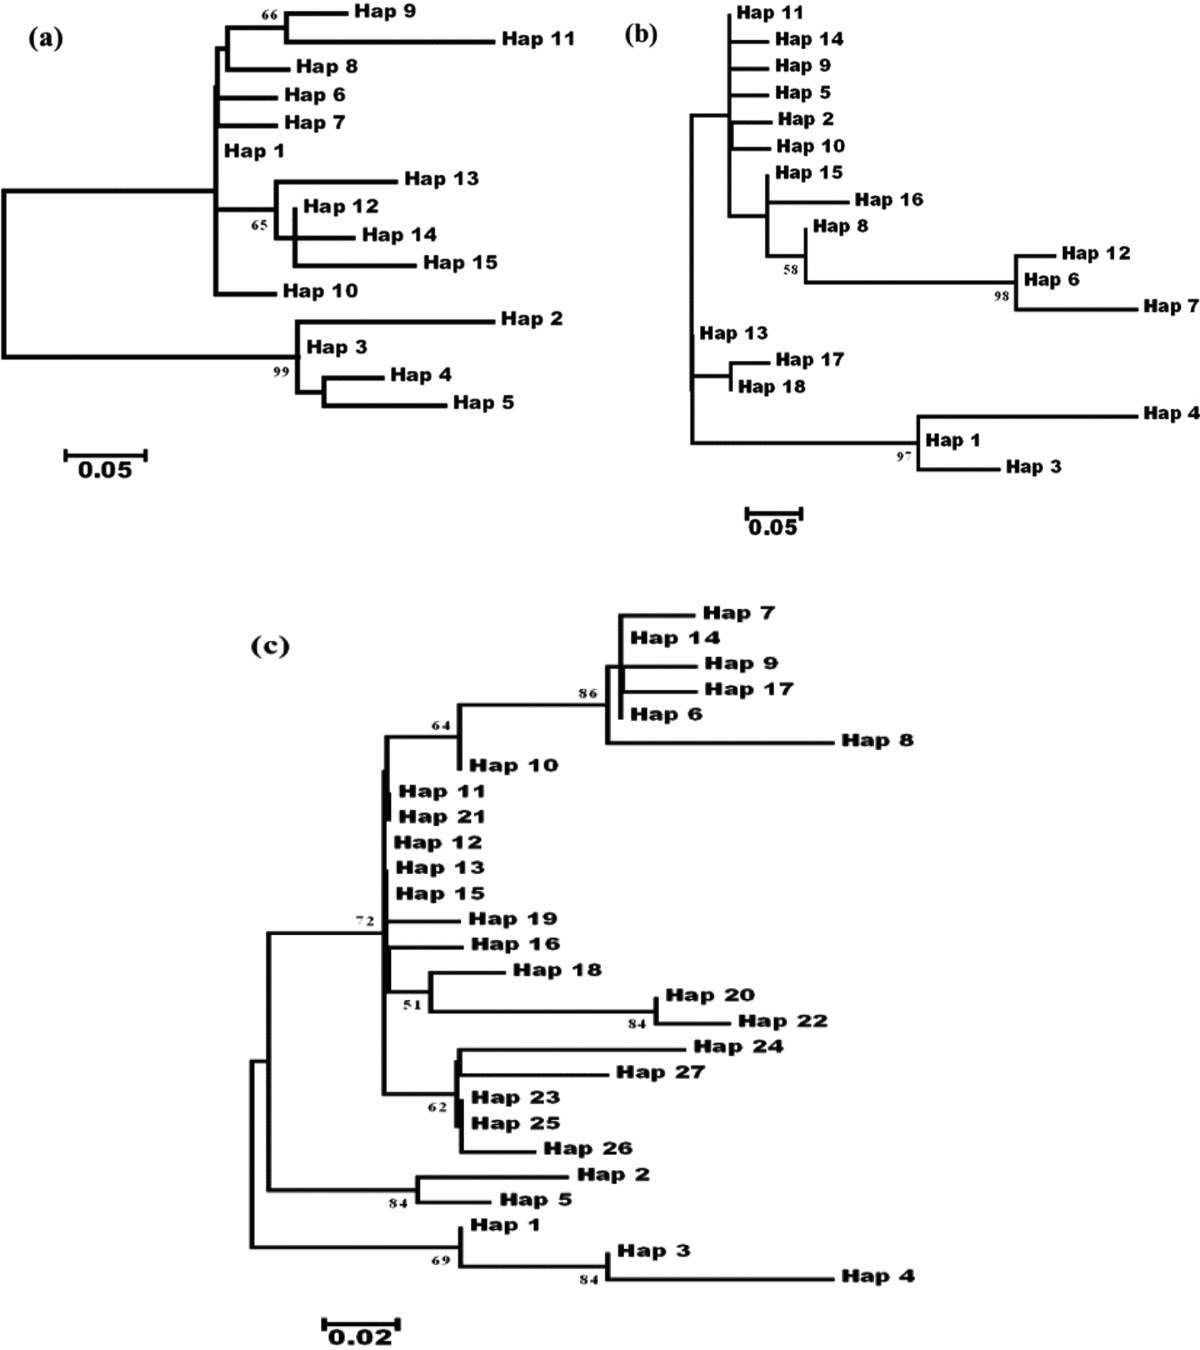
An important parameter to be considered for phylogenetic analysis is sequence divergence and extent of saturation of substitution in the sequences being examined. Sequence divergence should be such that the sequences under consideration should not be too conserved to contain few substitutions nor should they be too diverged to exhibit saturation that information required for building phylogenetic trees is lost. The extent of saturation in the ITS1 dataset was determined by the index of saturation (Iss) values (Xia et al., Reference Xia, Xie, Salemi, Chen and Wang2003). The Iss value of 0.0058, which was significantly less than the critical index of saturation (Iss.c) value of 0.7438, suggested that substitutions in this dataset have not reached saturation and hence, this data could be used for phylogenetic analysis. The Kimura 2 (K2) model was selected as the best fit model for the haplotype data as it gave the lowest Bayesian information criterion (BIC) score of 483.534 with log likelihood (lnL) of −157.204 and AICc of 374.561 (Kimura, Reference Kimura1980). The maximum likelihood tree of the haplotypes showed no resolution according to sampling locations, suggesting lack of sub-structuring and confirming gene flow between locations (Fig. 4a).
(a) Maximum likelihood tree of the ITS1 haplotypes based on the Kimura-2 –parametermodel; (b) Maximum likelihood tree of the ITS2 haplotypes based on the Kimura-2 –parametermodel; (c) Maximum likelihood tree of the haplotypes generated by the concatenated ITS1 + ITS2, based on the Jukes–Cantor model.

Sequence analysis of the ITS2 region
ITS2 sequences were determined for the same 30 adults of O. longicollis (Olivier) that were used for ITS1 analysis. The presumptive boundaries between 5.8S and ITS2 and ITS2 and 28S were determined by comparison with the ITS2 sequence of Anthonomus grandis (Tribe Anthonomini; Coleoptera, Curculionidae) (Roehrdanz et al., Reference Roehrdanz, Heilmann, Senechal, Sears and Evenson2010). The length of the ITS2 sequences ranged between 471 bp and 493 bp (Table S1). The overall base composition was T (31.8%), C (21.1%), A (22.9%), and G (24.1%). MUSCLE alignment of the 30 ITS2 sequences generated 513 characters, of which 426 were invariable and 29 were variable, of which 14 were parsimony informative (Fig. S1b). The 29 polymorphic sites, of which 22 were transitions (six A–G and sixteen C–T) and seven were transversions (two A–T, one A–C, three G–C and one G–T), gave rise to 18 haplotypes (Table 5). The haplotypes differed in the number of simple repeats, as well as in stretches of non-repeated nucleotides (Table S2b). The intra-population nucleotide diversity ranged from 0.00245 (0.00146) for Jalgaon to 0.01639 (SD 0.00345) for Assam with a mean nucleotide diversity of 0.01218 (0.00160), while the mean haplotype diversity (Hd) was 0.945 (SD 0.026) (Table 2).
Variable nucleotide sites in the 18 haplotypes identified in the 30 ITS2 sequences of Odoiporus longicollis (Olivier) individuals

AS: Kamrup; JL: Jalgaon; NG: Narayangaon; TR: Trichy; VA: Vaishali; WY: Wayanad.
Individuals having a particular ITS2 haplotype are as follows:
HAP 1: AS 1; HAP 2: AS 2; HAP 3: AS 3; HAP 4: AS 4; HAP 5: AS 5; HAP 6: JL 1, 2, 3, 5, TR 2. 4;
HAP 7: JL 4; HAP 8: NG 1; HAP 9: NG 2; HAP 10: NG 3; HAP 11: NG 4, VA 2; HAP 12: NG 5; HAP 13: TR 1, 3, 5; HAP 14: VA 1, 5; HAP 15: VA 3, WY 1, 5; HAP 16: VA 4; HAP17: WY 2; HAP18: WY 3, 4.
Geographical structure and demographic analysis
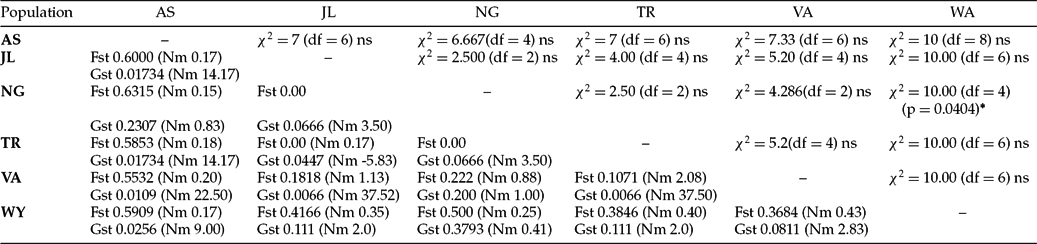
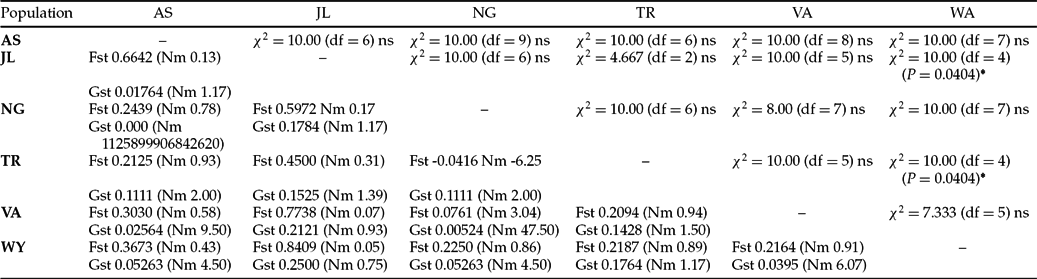
AMOVA analysis shows that of the total genetic variation, 64% was within locations while 36% was between locations, indicating relatively little geographical structure (Table S3b). Though the genetic differentiation estimate of the entire data was significant (Gst: 0.1667; Nm: 1.25; χ 2 = 120; P = 0.0075* (0.001<P<0.01); df = 85), the estimates for all pairs of locations were non-significant, with the exception of Wayanad/Narayangaon and Wayanad/Trichy where the genetic differentiation values were significant at P<0.05 (Table 6). The Mantel test showed a lack of strong correlation between genetic distance and geographical distance (R 2 = 0.1138; P = 0.099) (Fig. 2b). The star-shaped haplotype network is indicative of a signature of population expansion (Fig. 3b). The values of the various parameters of demographic analysis are shown in Table 4. The negative Tajima's D value was non-significant. Fu's Fs, which is more powerful in detecting population expansion, was negative and significant (P<0.02), indicating an excess of rare haplotypes over what would be expected under neutrality. The unimodal mismatch distribution curves and non-significant values of r (raggedness index) suggest population expansion (Fig. S2b).
Estimates of genetic differentiation between individuals of Odoiporus longicollis (Olivier) from six locations based on the ITS2 sequence data

AS: Kamrup; JL: Jalgaon; NG: Narayangaon; TR: Trichy; VA: Vaishali; WY: Wayanad. Overall: χ 2 = 120 (df = 85) **; Fst = 0.4223, Nm = 0.34; Gst = 0.1662, Nm = 1.25) (ns; non-significant P value; *0.01<P<0.05; **P = 0.0075, 0.01<P<0.001).
#: 1125899906842620.
Phylogenetic analysis based on the ITS2 region
The Iss value for the ITS2 data was 0.0152, which was significantly less than Iss.c (0.6978) suggesting that substitutions in this dataset have not reached saturation and hence, this data could be used for phylogenetic analysis (Xia et al., Reference Xia, Xie, Salemi, Chen and Wang2003). The Kimura-2 parameter model (Kimura, Reference Kimura1980) was selected as the best fit model for the ITS2 haplotype dataset, as it gave the lowest BIC score of 561.232 with lnL = −174.235 and AICc of 421.358. The Maximum likelihood tree generated using the haplotype data failed to reveal any phylogeographic distribution of the haplotypes (Fig. 4b).
Analysis of the concatenated data of ITS1 and ITS2
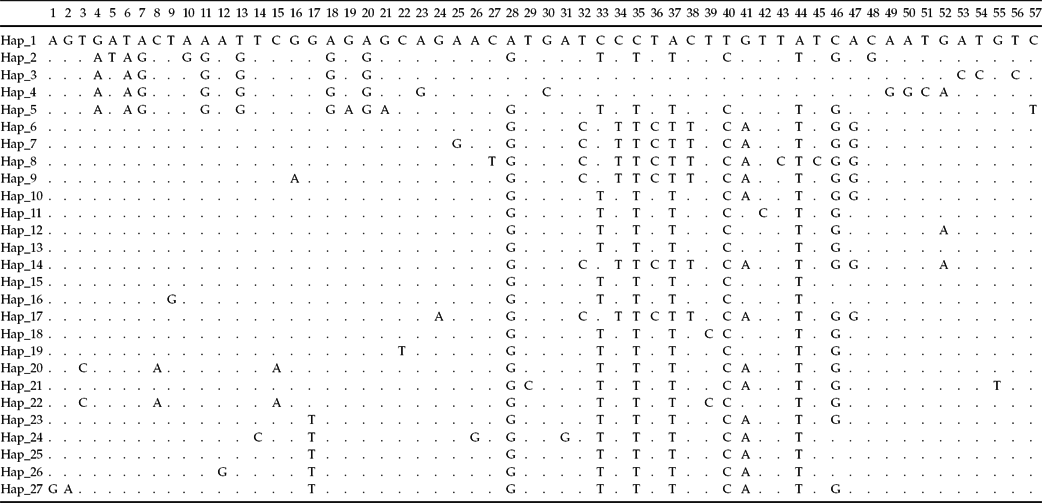
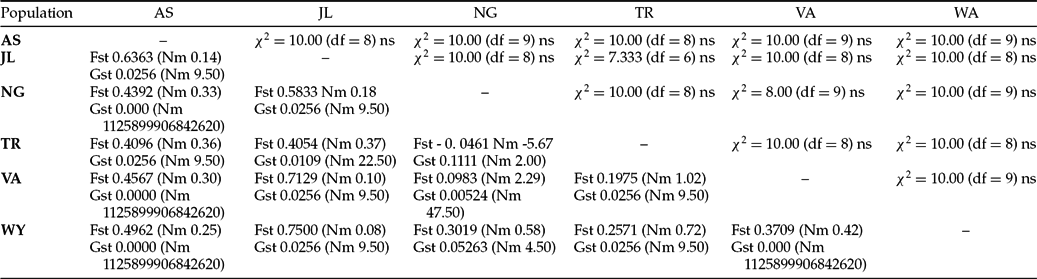
The concatenated dataset had 1442 sites, of which 57 were variable and 26 were parsimony informative, resulting in 27 haplotypes (Table 7) with haplotype diversity (Hd) and nucleotide diversity (π) of 0.991 (S.D. 0.012) and 0.00692 (S.D. 0.00097), respectively (Table 2). The intra-population nucleotide diversity ranged from 0.00145 (0.00050) for Jalgaon to 0.01041 (0.00166) for Assam with a mean nucleotide diversity of 0.00692 (0.00097), while the mean haplotype diversity (Hd) was 0.991 (0.012) (Table 2). The best fit model for the concatenated haplotype data was the Jukes–Cantor (JC) model with a BIC score of 900.254, lnL of −265.822 and AICc of 637.647 (Jukes and Cantor, Reference Jukes, Cantor and Munro1969). Genetic differentiation estimates for pairs of locations, as well as the overall data, were non-significant, suggesting absence of geographical sub-structuring (Table 8). This observation was also confirmed by Mantel test, which did not reveal a strong correlation between the geographic and genetic distance (R 2 = 0.1066; P = 0.06) (Fig. 2c). AMOVA analysis revealed that of the total variation, 55% and 45% was contributed by between locations and within locations, suggesting lack of sub-structuring (Table S3c). The maximum likelihood tree of the haplotypes also did not reveal any phylogeographic distribution of the haplotypes, suggesting lack of geographic sub-structuring (Fig. 4c). All the above observations suggest gene flow between the locations. The star-shaped haplotype network reveals a signature of population expansion (Fig. 3c). This was confirmed by the negative and significant values of Fu's Fs and R2 tests (Table 4) and by the unimodal mismatch distribution curves with non-significant r (raggedness index) values (Table 4, Fig. S2c).
Variable nucleotide sites in the 27 haplotypes identified in the 30 concatenated (ITS1 + ITS2) sequences of Odoiporus longicollis (Olivier) individuals

AS: Kamrup; JL: Jalgaon; NG: Narayangaon; TR: Trichy; VA: Vaishali; WY: Wayanad.
Individuals having a particular haplotype are as follows:
HAP 1: AS 1; HAP 2: AS 2; HAP 3: AS 3; HAP 4: AS 4; HAP 5: AS 5; HAP 6: JL 1, JL 2 TR 2; HAP 7: JAL3; HAP 8: JL 4; HAP 9: JL 5; HAP 10: NG 1; HAP 11: NG 2; HAP 12: NG 3; HAP 13: NG 4; HAP 14: NG 5; HAP 15: TR 1, TR 5; HAP 16: TR 3; HAP 17: TR 4; HAP 18: VA 1; HAP 19: VA 2; HAP 20: VA 3; HAP 21: VA 4; HAP 22: VA 5; HAP 23: WY 1; HAP 24: WY 2; HAP 25: WY 3; HAP 26: WY 4; HAP 27: WY 5.
Estimates of genetic differentiation between individuals of Odoiporus longicollis (Olivier) from six locations based on the concatenated ITS1 and ITS2 sequence data

AS: Kamrup; JL: Jalgaon; NG: Narayangaon; TR: Trichy; VA: Vaishali; WY: Wayanad. Overall: χ 2 = 142 (df = 130) (ns); Fst = 0.4531, Nm = 0.3; Gst = 0.0235, Nm = 10.36 (ns: non-significant P value).
Discussion
Genetic differentiation estimates based on the sequence analysis of the ITS1 and ITS2 regions support the occurrence of gene flow between the locations. No phylogeographical distribution of the haplotypes was evident from the phylogenetic trees, and this was also supported by the Mantel test and AMOVA analyses. Haplotype networks also revealed no evidence of phylogeographic structure. Certain haplotypes are shared between individuals sampled from different distant locations. For example, ITS1 haplotype 1 is shared by 14 individuals from Assam, Trichy, Jalgaon, Narayangaon, and Vaishali, while ITS2 haplotype 6 is shared by 6 individuals from Jalgaon and Trichy. Such a pattern where haplotypes are shared by individuals from different sampling areas provides strong evidence against geographic isolation and indicates that the weevils are capable of long distance movement. The high haplotype diversity and low nucleotide diversity suggest a rapid demographic expansion (Avise, Reference Avise2000). The star-shaped networks are a signature of demographic expansion, which was confirmed by the different demographic tests and the unimodal nature of the mismatch distribution curves.
Gene flow could occur in O. longicollis (Olivier), because the adult weevils are strong fliers and use host volatiles to locate their host (Padmanaban and Sathiamoorthy, Reference Padmanaban and Sathiamoorthy2001). Banana plantations are common in India, because they are grown not only in farmers’ fields but also in the backyard of small households, thereby facilitating the dispersal of weevils over long distances. The dispersal is also aided by the transport of agricultural goods. The larvae and pupae that reside within the pseudostem can survive the storage conditions during transport. These biological features increase the probability of establishment of these weevils in newer areas. Our parallel work on the analysis of the mitochondrial COI-tRNALeu-COII region of the same 30 individuals used in the present work gave highly significant values of genetic differentiation estimates, suggesting a male-biased gene flow in O. longicollis (Olivier) (Shankar et al., Reference Shankar, Kulkarni and Sunil Kumar2015). Gene flow between locations can prevent or slow down the process of genetic differentiation. Gene flow has been observed in flying insects, such as Monarch butterflies D. plexippus (Brower and Boyce, Reference Brower and Boyce1991), bumble bees Bombus terrestris (Estoup et al., Reference Estoup, Solignac, Cornuet, Goudet and Scholl1996), dragonflies Anax junius (Freeland et al., Reference Freeland, May, Lodge and Conrad2003), mosquitoes Anopheles nuneztovari (Fritz et al., Reference Fritz, Conn, Cockburn and Seawright1994), bark beetles (Gallego and Galián, Reference Gallego and Galián2001), and southern corn rootworm (Szalanski et al., Reference Szalanski, Roehrdanz, Taylor and Chandler1999). Knowledge about attributes such as gene flow and pest dispersal is essential for the success of IPM programmes (Aylor and Irwin, Reference Aylor and Irwin1999; Byrne, Reference Byrne1999). For example, locations that are isolated can be sequentially eradicated without a high risk of re-introduction; but, if there is a high level of gene flow between the population, then simultaneous eradication would be required. If gene flow exists between the locations, new individuals from other locations would colonize the area once more, thereby maintaining the overall genetic diversity. Thus knowledge about the effective population size and the geographic area that the locations occupy is relevant. The assessment of the dispersal potential will aid in devising strategies on how invasive species can be managed. Generally, species that experience restricted dispersal are better candidates for control than those that disperse widely.
Understanding gene flow is necessary, not only to ascertain factors that enable or prevent local adaptation of the pest species, but also for management of resistance to pesticides. Presently, methods, such as injection of systemic organophosphorus compounds, e.g. monocrotophos, into the stem, swabbing the stem with insecticides along with surfactants, swabbing with mud slurry containing the insecticide, spraying, and fumigation of the spaces between the leaf sheaths in the pseudostem, and fumigation of banana plants using Celphos (aluminium phosphide), are being used. Organochlorine insecticides are no longer being used to control this banana pest, due to the possibility of development of insecticide-resistant weevils (Padmanaban and Sathiamoorthy, Reference Padmanaban and Sathiamoorthy2001; Azam et al., Reference Azam, Tara, Ayri, Feroz and Ramamurthy2010; Shukla, Reference Shukla2010). Knowledge about gene flow could serve as a guideline for developing suitable control strategies and could give an idea as to how fast the resistance to a given control method could evolve and how broadly in a geographical sense; this method should be applied.
The high haplotype diversity, low nucleotide diversity and the star-like haplotype network are suggestive of a recent origin of most of the haplotypes. Many of the haplotypes in the haplotype networks differed in just a few nucleotides from the inner haplotypes. Sequencing of additional individuals from these six locations, as well as individuals from locations in additional geographical areas, would provide more information on the geographical centre of origin of this pest in India and the structuring of Indian populations of this agriculturally important banana pest.
Conclusions
Genetic differentiation, haplotype and demographic analyses of the ITS1 and ITS2 sequences from 30 individuals of banana pseudostem weevil that were collected from six hotspot locations in India suggest gene flow between the locations. This is in contrast to our earlier work wherein the analysis of the mitochondrial fragment COI-tRNALeu-COII of the same 30 individuals revealed a high level of genetic differentiation between the locations, thereby indicating a male-biased gene flow. Understanding gene flow in pest locations is an essential component of IPM and can aid in developing suitable control and insecticide management strategies for this economically important banana pest.
Acknowledgements
We wish to acknowledge the Department of Biotechnology, New Delhi, India, for a research grant to carry out this work (Project No. GAP 299626). We thank Dr B. Padmanaban, Senior Entomologist, National Research Centre for Bananas, Tiruchirapalli, India, for his help in collection of the weevils from Trichy, Narayangaon, Assam and Wayanad; Dr Kalita, Programme Coordinator, Krishi Vigyan Kendra, H. R. S. Campus, Kahikuchi, District Kamrup, Assam and Dr N. M. Patil, Entomologist, Banana Research Centre, Jalgaon, Maharashtra, for their help in collection of the weevils. We thank the Council of Scientific and Industrial Research (CSIR) for a fellowship awarded to PS.
Supplementary material
To view supplementary material for this article, please visit https://doi.org/10.1017/S1742758418000231