Introduction
The crayfish plague, caused by Aphanomyces astaci (Schikora), is the most devastating crayfish disease known to date (Cerenius et al. Reference Cerenius, Andersson, Söderhäll, Lamour and Kamoun2009; Jussila et al. Reference Jussila, Vrezec, Makkonen, Kortet, Kokko and Canning-Clode2015). Aphanomyces astaci is listed among the 100 worst invasive species in the world by the Global Invasive Species Specialist Group of the International Union for Conservation of Nature (IUCN; Lowe et al. Reference Lowe, Browne, Boudjelas and De Poorter2004), being the main reason for the reducing numbers of the native crayfish throughout Europe (Souty-Grosset et al. Reference Souty-Grosset, Holdich, Noël, Reynolds and Haffner2006). All the five European crayfish species, i.e. noble crayfish (Astacus astacus), stone crayfish (Austropotamobius torrentium), white-clawed crayfish (Austropotamobius pallipes), narrow-clawed crayfish (Astacus leptodactylus) and thick-clawed crayfish (Astacus pachypus), are susceptible to the disease, with catastrophic epidemics possible, and the three first-mentioned species are listed in the IUCN Red List as vulnerable, data deficient and endangered, respectively, with a decreasing population trend (IUCN, 2012).
During the past decades, phylogenetic studies on different A. astaci strains have been done to clarify the relationships within this species and the North American hosts that carry them. The random amplification of polymorphic DNA–polymerase chain reaction (RAPD–PCR) techniques firstly revealed certain genetic diversity in A. astaci (Huang et al. Reference Huang, Cerenius and Söderhäll1994; Diéguez-Uribeondo et al. Reference Diéguez-Uribeondo, Huang and Cerenius1995; Rezinciuc et al. Reference Rezinciuc, Galindo, Montserrat and Diéguez-Uribeondo2014). Thus, five genetic groups of A. astaci, named A, B, C, D and E, have been identified in Europe by using RAPD–PCR (Huang et al. Reference Huang, Cerenius and Söderhäll1994; Diéguez-Uribeondo et al. Reference Diéguez-Uribeondo, Huang and Cerenius1995; Kozubíková et al. Reference Kozubíková, Viljamaa-Dirks, Heinikainen and Petrusek2011). The RAPD–PCR group A (As) includes the strain of reference L1, which was isolated from native European crayfish A. astacus, and also a number of strains that seem to be related to the first invasion of A. astaci with an unknown host species in the 19th century. The RAPD–PCR group B (PsI) includes the strain of reference Pl, which was isolated from the North American crayfish species, Pacifastacus leniusculus, as well as other strains isolated from outbreaks in native European species and other P. leniusculus crayfish. The RAPD–PCR group C (PsII) comprises a single strain named Kv, isolated from an outbreak on signal crayfish in Kvarntorp (Sweden) that originated from Lake Pitt (Canada) (Huang et al. Reference Huang, Cerenius and Söderhäll1994). This group has not been detected since then (Söderhäll and Cerenius, Reference Söderhäll and Cerenius1999). The RAPD–PCR group D (Pc) includes the reference strain Pc and was first isolated from the red swamp crayfish (Procambarus clarkii) in Spain (Diéguez-Uribeondo and Söderhäll, Reference Diéguez-Uribeondo and Söderhäll1993; Diéguez-Uribeondo et al. Reference Diéguez-Uribeondo, Huang and Cerenius1995) and a number of strains, e.g. APO3 and Málaga5, isolated from outbreaks in native crayfish A. pallipes (Rezinciuc et al. Reference Rezinciuc, Galindo, Montserrat and Diéguez-Uribeondo2014). Finally, the RAPD–PCR group E (Or) comprises a reference strain Evira4805 isolated from the spiny-cheek crayfish (Orconectes limosus) naturalized in Europe (Kozubíková et al. Reference Kozubíková, Viljamaa-Dirks, Heinikainen and Petrusek2011) and a few strains isolated from outbreaks in native crayfish A. astacus, e.g. Li10, after that (Kozubíková-Balcarová et al. Reference Kozubíková-Balcarová, Koukol, Martín, Svoboda, Petrusek and Diéguez-Uribeondo2013).
Later, studies based on internal transcribed spacer (ITS)-regions indicated that A. astaci strains were genetically very similar since their intraspecific variation measured is close to zero (Diéguez-Uribeondo et al. Reference Diéguez-Uribeondo, Garcia, Cerenius, Kozubíková, Ballesteros, Windels, Weiland, Kator, Söderhäll and Martin2009; Makkonen et al. Reference Makkonen, Jussila, Henttonen and Kokko2011). It was postulated that this was a result of the clonal propagation via zoospores (Huang et al. Reference Huang, Cerenius and Söderhäll1994; Diéguez-Uribeondo et al. Reference Diéguez-Uribeondo, Garcia, Cerenius, Kozubíková, Ballesteros, Windels, Weiland, Kator, Söderhäll and Martin2009; Rezinciuc et al. Reference Rezinciuc, Sandoval-Sierra, Oidtmann, Diéguez-Uribeondo, Kawai, Faulkes and Scholtz2015). Additional studies exploring the A. astaci diversity in Europe were conducted on nuclear chitinase gene (Makkonen et al. Reference Makkonen, Jussila and Kokko2012a), amplified fragment length polymorphisms (AFLP; Rezinciuc et al. Reference Rezinciuc, Galindo, Montserrat and Diéguez-Uribeondo2014), and nuclear single-sequence repeat microsatellite markers (Grandjean et al. Reference Grandjean, Vrålstad, Diéguez-Uribeondo, Jelić, Mangombi, Delaunay, Filipová, Rezinciuc, Kozubíková-Balcarová, Guyonnet, Viljamaa-Dirks and Petrusek2014). Phylogenetic analyses using chitinase gene analyses (Makkonen et al. Reference Makkonen, Jussila and Kokko2012a) and AFLP–PCR (Rezinciuc et al. Reference Rezinciuc, Galindo, Montserrat and Diéguez-Uribeondo2014) indicate that all the strains of A. astaci split into two lineages: (i) one that comprises strains from RAPD–PCR groups A, B, C and E and (ii) a second one that comprises strains of RAPD–PCR group D. Furthermore, the chitinase gene sequencing and microsatellite markers have also been applied as a diagnostic tool to characterize the pathogen strains causing crayfish plague outbreaks (e.g. Panteleit et al. Reference Panteleit, Keller, Kokko, Jussila, Makkonen, Theissinger and Schrimpf2017). However, the application of the chitinase gene as a marker has been found limited due to its incapability to separate the RAPD–PCR groups B and E (Makkonen et al. Reference Makkonen, Jussila and Kokko2012a). For the microsatellites, the interpretation of the results is often hard due to the lack of possibility to confirm the amplification specificity and possible mixed infections from other oomycetes species often present in crayfish (Kozubíková-Balcarová et al. Reference Kozubíková-Balcarová, Koukol, Martín, Svoboda, Petrusek and Diéguez-Uribeondo2013). Both methods also fail in cases when the pathogen quantities in samples are low, i.e. the quantitative PCR (qPCR) shows agent levels of mid-A3 or lower (Vrålstad et al. Reference Vrålstad, Knutsen, Tengs and Holst-Jensen2009). Therefore, only a limited number of crayfish plague outbreak cases detected with qPCR can be further characterized with these applications.
The diversity, distribution and prevalence of A. astaci in its original distribution area in North America are still largely unknown. When novel species or crayfish from North America were introduced to Europe, likely also A. astaci has been repeatedly introduced with these animals (Makkonen et al. Reference Makkonen, Jussila and Kokko2012a; Jussila et al. Reference Jussila, Vrezec, Makkonen, Kortet, Kokko and Canning-Clode2015; Rezinciuc et al. Reference Rezinciuc, Sandoval-Sierra, Oidtmann, Diéguez-Uribeondo, Kawai, Faulkes and Scholtz2015). Nowadays, this threat should be minimized due to the EU regulation 1143/2014 on invasive alien species. The origin and geographic migration of a broad variety of organisms, including oomycetes, have been tracked by using mitochondrial DNA (mtDNA) (Martin et al. Reference Martin, Cappellini, Samaniego, Zepeda, Campos, Seguin-Orlando, Wales, Orlando, Ho, Dietrich, Mieczkowski, Heitman, Willerslev, Krogh, Ristaino and Gilbert2013, Reference Martin, Ho, Wales, Ristaino and Gilbert2014; Yoshida et al. Reference Yoshida, Schuenemann, Cano, Pais, Mishra, Sharma, Lanz, Martin, Kamoun, Krause, Thines, Weigel and Burbano2013). When working with clonally reproducing organisms such as A. astaci, the mitochondrial (mt) genome provides a valuable marker for population studies (Makkonen et al. Reference Makkonen, Vesterbacka, Martin, Jussila, Diéguez-Uribeondo, Kortet and Kokko2016). Thus, the aim of this study was to examine the potential applicability of mtDNA as a tool to track the origin and diversity of the crayfish plague pathogen A. astaci and provide a basis for developing an effective tool to further characterize the disease outbreaks and their origins. The A. astaci diversity in Europe, as well as in its original distribution in North America, are currently rather poorly known, but hopefully intensively studied in the future. As critical differences in the pathogen strains’ virulence properties in Europe have also been observed (e.g. Diéguez-Uribeondo et al. Reference Diéguez-Uribeondo, Huang and Cerenius1995; Makkonen et al. Reference Makkonen, Jussila, Kortet, Vainikka and Kokko2012b, Reference Makkonen, Kokko, Vainikka, Kortet and Jussila2014), the characterization of the strains causing the epidemics in the wild must be considered as a task with a high importance.
Materials and methods
Strains and species tested
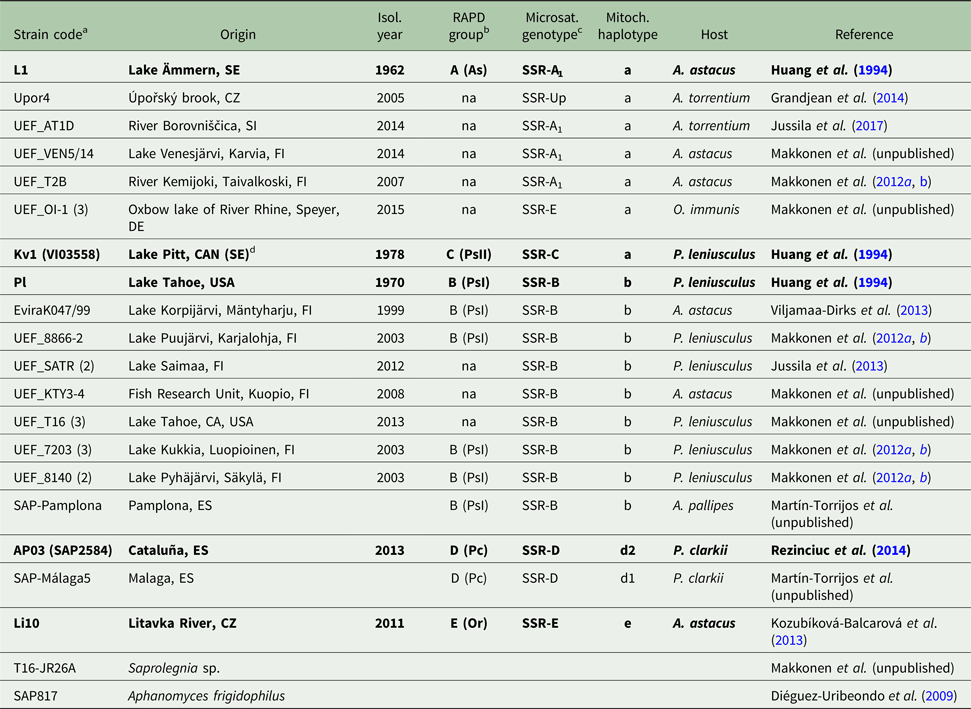
A total of 27 A. astaci strains from the culture collections of the University of Eastern Finland (Finland), Evira (Finland), Charles University of Prague (Czech Republic) and Real Jardín Botánico-CSIC (Spain) were sequenced in this study. The strains were representing the five currently recognized RAPD-groups in Europe (Table 1). In addition, two Saprolegniales species, Aphanomyces frigidophilus and Saprolegnia sp., were sequenced as a reference (Table 1).
The Aphanomyces astaci strains sequenced in this study

The strains considered as reference strains for each genotype based on RAPD and microsatellite results are bolded. na indicates no result available for RAPD genotype.
a With n of isolates sequenced from the same location given in brackets.
b RAPD-genotypes published in Huang et al. (Reference Huang, Cerenius and Söderhäll1994), Diéguez-Uribeondo et al. (Reference Diéguez-Uribeondo, Huang and Cerenius1995) and Viljamaa-Dirks et al. (2013).
c Microsatellite genotypes published by Grandjean et al. (Reference Grandjean, Vrålstad, Diéguez-Uribeondo, Jelić, Mangombi, Delaunay, Filipová, Rezinciuc, Kozubíková-Balcarová, Guyonnet, Viljamaa-Dirks and Petrusek2014).
d Isolated in Sweden from signal crayfish which originated from Pitt Lake, Canada.
Primer design
The annotated mt genome (KX405004) of A. astaci was used as a reference sequence for the primer design (Makkonen et al. Reference Makkonen, Vesterbacka, Martin, Jussila, Diéguez-Uribeondo, Kortet and Kokko2016) and the regions containing group-specific differences were selected based on alignments with A. astaci transcriptomic data produced at the University of Eastern Finland (Kokko et al. unpublished). The alignments and manual editions of the sequences were conducted in Geneious 8.0 (Kearse et al. Reference Kearse, Moir, Wilson, Stones-Havas, Cheung, Sturrock, Buxton, Cooper, Markowitz, Duran, Thierer, Ashton, Meintjes and Drummond2012). Primers were designed with the Primer3 program (Rozen and Skaletsky, Reference Rozen and Skaletsky2000). Two primer pairs amplifying the mitochondrial ribosomal rnnS (AphSSUF and AphSSUR) and rnnL (AphLSUF and AphLSUR) genes were designed (Table 2).
The primers

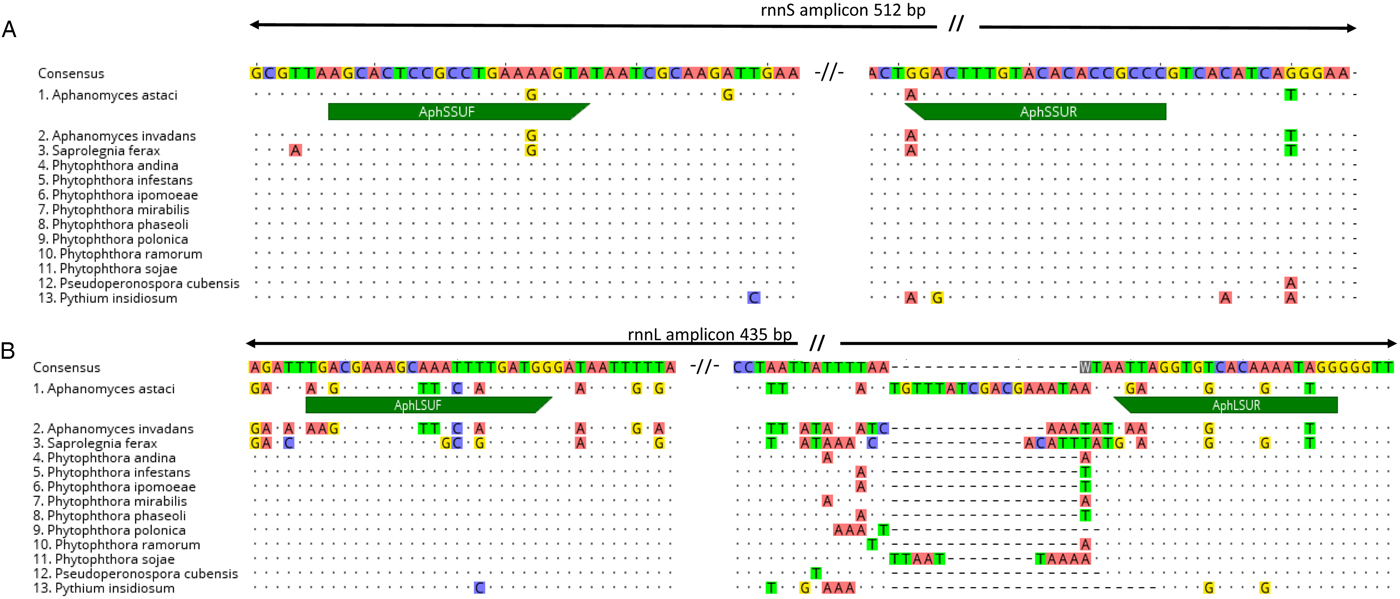
The species specificity of the target region was checked with sequence alignments to oomycetes that were either available in GenBank or sequenced in this study (Fig. 1A and B). The species from GenBank were Aphanomyces invadans (KX405005), Saprolegnia ferax (AY534144), Pythium insidiosum (AP014838), Phytophthora infestans (AY898627), P. ipomoeae (HM590420), P. mirabilis (HM590421), P. phaseoli (HM590418), P. polonica (KT946598), P. ramorum (DQ832718), P. sojae (DQ832717), P. andina (KJ408269) and Pseudosperenospora cubensis (KT072718).
Primer regions aligned with other available oomycetes. (A) rnnS region and primers AphSSUF and AphSSUR. (B) rnnL-region and primers AphLSUF and AphLSUR.

PCR
The PCR reactions were carried out in 25 µL reaction volume containing 1 U of DreamTaq DNA polymerase (Thermo Fisher Scientific), 2× DreamTaq Green master mix (Thermo Fisher Scientific), 10 mm of primers and 10–100 ng of template DNA. The reaction volume was filled with PCR-grade water. The amplification was conducted on a PTC-200 thermal cycler (MJ Research) with the following conditions: 95 °C, 3 min, 35× (95 °C, 30 s; 59 °C, 30 s; 72 °C, 30 s) and 72 °C 10 min. Each run contained a positive control (A. astaci DNA of strain UEF8866-2) and a blank reaction without a template. The amplification was checked on a 1.5% agarose gel containing 0.5 µ m ethidium bromide (EtBr). Then, the samples were purified with GeneJET PCR Purification Kit (Thermo Fisher Scientific).
Sequencing, phylogenetics and analysis on the genetic diversity
The Sanger sequencing reactions were sequenced by GATC Biotech (Germany) with the primers AphSSUF and AphLSUF, respectively (Table 2). Approximately half of the amplicons were confirmed by additional sequencing with appropriate reverse primers AphSSUR or AphLSUR. The resulting sequence data were manually revised and edited, and the low-quality reads filtrated out from the alignments in Geneious version 8.0 (Kearse et al. Reference Kearse, Moir, Wilson, Stones-Havas, Cheung, Sturrock, Buxton, Cooper, Markowitz, Duran, Thierer, Ashton, Meintjes and Drummond2012) and the primer sites were cut off from the sequences before the further analyses. The sequences were entered into NCBI GenBank database with access numbers MF973121–MF973149 for rnnS and MF975950–MF975978 for rnnL.
Two phylogenetic approximations, a Bayesian inference (BI) and a maximum-likelihood (ML) analyses, and a distance method, a neighbour-joining distance-based analyses (NJ), were employed to reconstruct the phylogenetic relationships. The BI was performed in Mr Bayes v.3.2.6 software (Ronquist et al. Reference Ronquist, Teslenko, van der Mark, Ayres, Darling, Höhna, Larget, Liu, Suchard and Huelsenbeck2012) using the MCMC method with 10 000 000 generations, three runs (eight chains per run) with a burn-in of 25% trees and a standard deviation of split frequencies <0.01. Nodes with posterior probability (pp) values ⩾0.95 were considered supported. The ML was performed using RAxML v.8 (Stamatakis, Reference Stamatakis2014) implemented in raxmlGUI v1.5b1 (Silvestro and Michalak, Reference Silvestro and Michalak2012), with 100 independents replicates and 1000 rapid bootstraps. Nodes with bootstrap values ⩾75 were considered supported. The NJ analysis for inferring the phylogeny was performed utilizing MEGA v6.06 (Tamura et al. Reference Tamura, Stecher, Peterson, Filipski and Kumar2013) using Kimura two-parameter distances between the sequences and bootstrap values determined by 1000 replications. All the resulting trees from the BI, ML and NJ were visualized on FigTree v1.4.2 (Rambaut, Reference Rambaut2012). A. frigidophilus was used as an outgroup in all approximations. We performed the analyses for the independent rnnS and rnnL, as well as for the concatenated rnnS and rnnL regions with the same parameters described above.
Genetic diversity was estimated calculating the number of polymorphic (segregating) sites (S), the number of haplotypes, the haplotype diversity (Hd), the average number of nucleotide differences (k), and the nucleotide diversity (π) utilizing the program DNAsp v.5.10.01 (Librado and Rozas, Reference Librado and Rozas2009). We used TCS v.1.21 (Clement et al. Reference Clement, Posada and Crandall2000) to represent the mutational changes between the sequences throughout the most parsimonious haplotype network and to visualize the genealogical relationships, we used PopArt v1.7.2 (Leigh and Bryant, Reference Leigh and Bryant2015).
Microsatellite genotyping
To validate the results of the mitochondrial data with the methods currently in use and obtain grouping for the previously uncharacterized strains, microsatellite analyses of selected strains (Table 1) were conducted at the University of Koblenz-Landau (Germany) utilizing the nine co-dominant microsatellite markers according to Grandjean et al. (Reference Grandjean, Vrålstad, Diéguez-Uribeondo, Jelić, Mangombi, Delaunay, Filipová, Rezinciuc, Kozubíková-Balcarová, Guyonnet, Viljamaa-Dirks and Petrusek2014). The PCR reactions were carried out with Multiplex PCR Kit (Qiagen, the Netherlands) and 0.1–0.38 µ m of each of the labelled primers Aast4, Aast6, Aast7, Aast14 for Batch A as well as Aast2 Aast9, Aast10, Aast12, Aast13 for Batch B were added. 1 µL DNA template was appended to final volumes of 5 and 5.5 µL, respectively. The fragment analyses were conducted on a Beckman Coulter CEQ 8000 eight capillary sequencers. Alleles were scored using the GenMarker software (version 1.95, SoftGenetics LLC) and compared with reference strains.
Direct A. astaci haplotyping from infected crayfish cuticle samples
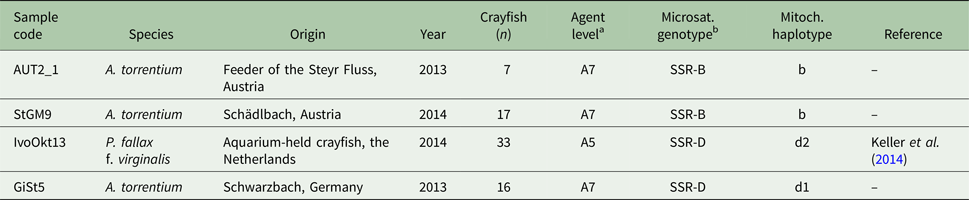
Direct haplotyping from infected crayfish samples was conducted at the University of Koblenz-Landau (Germany). One sample was from an aquarium-held marbled crayfish, Procambarus virginalis (Lyko Reference Lyko2017), already tested positively for crayfish plague infection by Keller et al. (Reference Keller, Pfeifferm, Roessink, Schulz and Schrimpf2014). Moreover, A. astaci DNA was extracted from stone crayfish belonging to populations from three natural water bodies in Austria and Germany, which underwent mass mortalities at the time of sampling (Table 3).
Samples sequenced directly from crayfish tissue

a The highest agent level [according to Vrålstad et al. (Reference Vrålstad, Knutsen, Tengs and Holst-Jensen2009)] detected among the population, from which the haplotyping was conducted.
b Microsatellite genotypes identified using the method published by Grandjean et al. (Reference Grandjean, Vrålstad, Diéguez-Uribeondo, Jelić, Mangombi, Delaunay, Filipová, Rezinciuc, Kozubíková-Balcarová, Guyonnet, Viljamaa-Dirks and Petrusek2014).
DNA of A. astaci was extracted from infected crayfish tissue using a CTAB method and the crayfish plague agent levels of them were examined with qPCR according to Vrålstad et al. (Reference Vrålstad, Knutsen, Tengs and Holst-Jensen2009). The PCR reaction mixture contained 0.4 µ m of each primer (Table 2), 0.75× DreamTaq Green master mix (Thermo Fisher Scientific), 0.5 U DreamTaq DNA polymerase (Thermo Fisher Scientific), 0.17 mm dNTPs and 2.5 µL of the DNA template. The mixture was filled up to 12.5 µL with PCR-grade water. PCR was carried out on a Primus 96 Plus Thermal Cycler (PEQLAB Biotechnologies GmbH) with the following conditions: 95 °C, 3 min, 30× (95 °C, 30 s; 60 °C, 30 s; 72 °C, 30 s), and 72 °C 10 min. Each run contained a positive control (A. astaci DNA) and a blank reaction without a template. The amplification was checked on an agarose gel with EtBr labelling. The PCR products were sequenced on a 3730 DNA Analyser eight capillary sequencer (Applied Biosystems) by the company Seq IT GmbH & Co. KG (Kaiserslautern, Germany). The sequences were aligned and edited using the program Geneious R7 (Kearse et al. Reference Kearse, Moir, Wilson, Stones-Havas, Cheung, Sturrock, Buxton, Cooper, Markowitz, Duran, Thierer, Ashton, Meintjes and Drummond2012) and then entered into NCBI GenBank database with the access numbers MF150010–MF150017. Microsatellite analyses of infected crayfish samples were conducted similarly as explained earlier.
Results
Primer specificity
The two primer pairs developed to amplify the mitochondrial ribosomal rnnS and rnnL subunits (Table 2, Fig. 1) produced amplicons with lengths of 512 and 435 bp (with primer regions included) from the tested A. astaci strains, respectively.
The primer pair AphSSU (Table 2, Fig. 1A), developed for the rnnS subunit, also amplified some other aquatic oomycetes, i.e. Saprolegnia sp. However, the species were later easily identified based on their nucleotide sequences, as the sequence alignments and BLAST comparisons of the 512 bp rnnS region showed the sequence diversity to be high enough to separate A. astaci from closely related species. The differences for rnnS were 16 nucleotides (97.0% similarity) to A. frigidophilus and 35 nucleotides (93.0% similarity) to Saprolegnia sp. (see the details of the species in Table 1). Furthermore, the BLAST search to NCBI GenBank showed 12 nucleotides (97.5% similarity) to A. invadans (KX405005) and a 93.3% similarity (32 nucleotides) to S. ferax (AY534144).
The rnnL primers showed high species divergence at the primer regions (Fig. 1B). At the 435 bp rnnL region, the diversity was slightly more variable, showing 94.6% similarity (20 nucleotides) to A. frigidophilus, but up to 100% similarity was detected against Saprolegnia sp., although the similarity to another parasitic Saprolegnia having rnnL sequence available, S. ferax (AY534144), showed only 116 bp matching region with 99.0% similarity, this 116 bp matching region was also observed for A. invadans (KX405005) with 97.4% similarity (three nucleotides).
Intraspecific diversity, phylogeny and genetic diversity
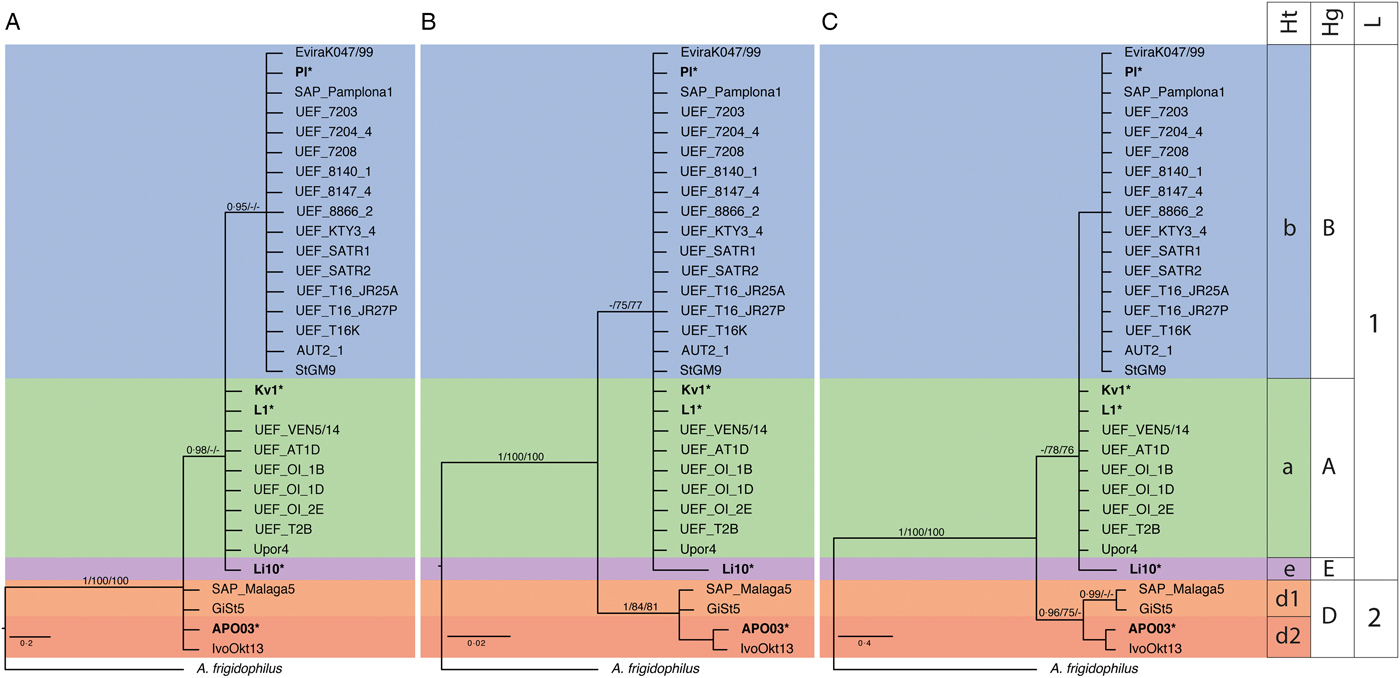
For the diversity estimations, a 475 and 391 bp fragments of rnnS and rnnL amplicons were included, respectively (Supplementary Fig. 1). The two phylogenetic approximations and the inferred method used to reconstruct the phylogenetic relationships (BI, ML and NJ, respectively) (Fig. 2) supported the differentiation of two linages for each of the datasets used in this study (rnnS alignment, rnnL alignment; and the concatenated rnnS and rnnL alignment): the first lineage includes the A, B, C and E RAPD–PCR groups and a second lineage is formed by D RAPD–PCR group (Fig. 2).
Bayesian inference analyses based on rnnS, rnnL and concatenated rnnS + rnnL mtDNA sequences. (A) Bayesian inference analysis was based on rnnS mtDNA sequences. (B) Bayesian inference analysis was based on rnnL mtDNA sequences. (C) Bayesian inference analysis was based on concatenated rnnS + rnnL mtDNA sequences. Values above the branches represent the posterior probabilities (>0.95) form Bayesian inference, and bootstrap support (>75) from maximum-likelihood and neighbour-joining analyses. Scales bar for phylogenetic analysis indicates substitutions per site. The original strains used as references and identified in previous studies by RAPD–PCR technique appear in bold and with a star key (*), correspond to group A: L1*, group B: Pl*, group C: Kv1*, group D: AP03*, group E: Li10*. Ht indicates haplotypes, Hp indicates haplogroups and L indicates lineages.

According to the phylogenetic analysis of the rnnS alignment (Fig. 2A), the first lineage includes only two subgroups. The first subgroup includes the sequences similar to the strains that belong to the RAPD–PCR groups A, C and E; and the second subgroup includes the sequences similar to the strains that belong to the RAPD–PCR group B. The second lineage includes the sequences similar to the strains that belong to the RAPD–PCR groups D (Fig. 2A). In contrast, the phylogenetic analysis of the rnnL alignment includes two subgroups for the first lineage. The first subgroup is composed by similar sequences to the strains from the RAPD–PCR groups A, B and C; and the second subgroup by similar sequences to the strains from the RAPD–PCR groups E, although the RAPD–PCR group E is not supported by the phylogenetic analyses. The second lineage includes the similar sequences to the strains that belong to the RAPD–PCR groups D (Fig. 2B).
As a result of the concatenated rnnS and rnnL sequences, we found three defined haplogroups within these two main lineages, grouping similar strains of the concatenated sequences rnnS and rnnL (Fig. 2C). Lineage 1 includes three haplogroups (A-, B- and E-haplogroups), each represented by different specific haplotypes. The A-haplogroup is formed by strains from RAPD–PCR groups A and C, including only one haplotype, i.e. a-haplotype. The a-haplotype comprises sequences from RAPD–PCR groups A, i.e. L1 and Upor4, and sequences from RAPD–PCR group C, i.e. Kv1 (Fig. 2C). The B-haplogroup is formed by strains from RAPD group B, i.e. Pl, EviraK047/99, SAP-Pamplona, which comprises the unique b-haplotype. The E-haplogroup is formed by strains from RAPD–PCR groups E, including one haplotype, i.e. e-haplotype Li10 (Fig. 2C). Lineage 2 includes only one haplogroup (D-haplogroup), confirmed by strains from the RAPD–PCR group D, i.e. AP03 and SAP-Málaga5. This D-haplogroup has two haplotypes, i.e. d1-haplotype (with the sequence SAP-Málaga5) and d2-haplotype (with the genome sequenced sequence AP03) (Fig. 2C).
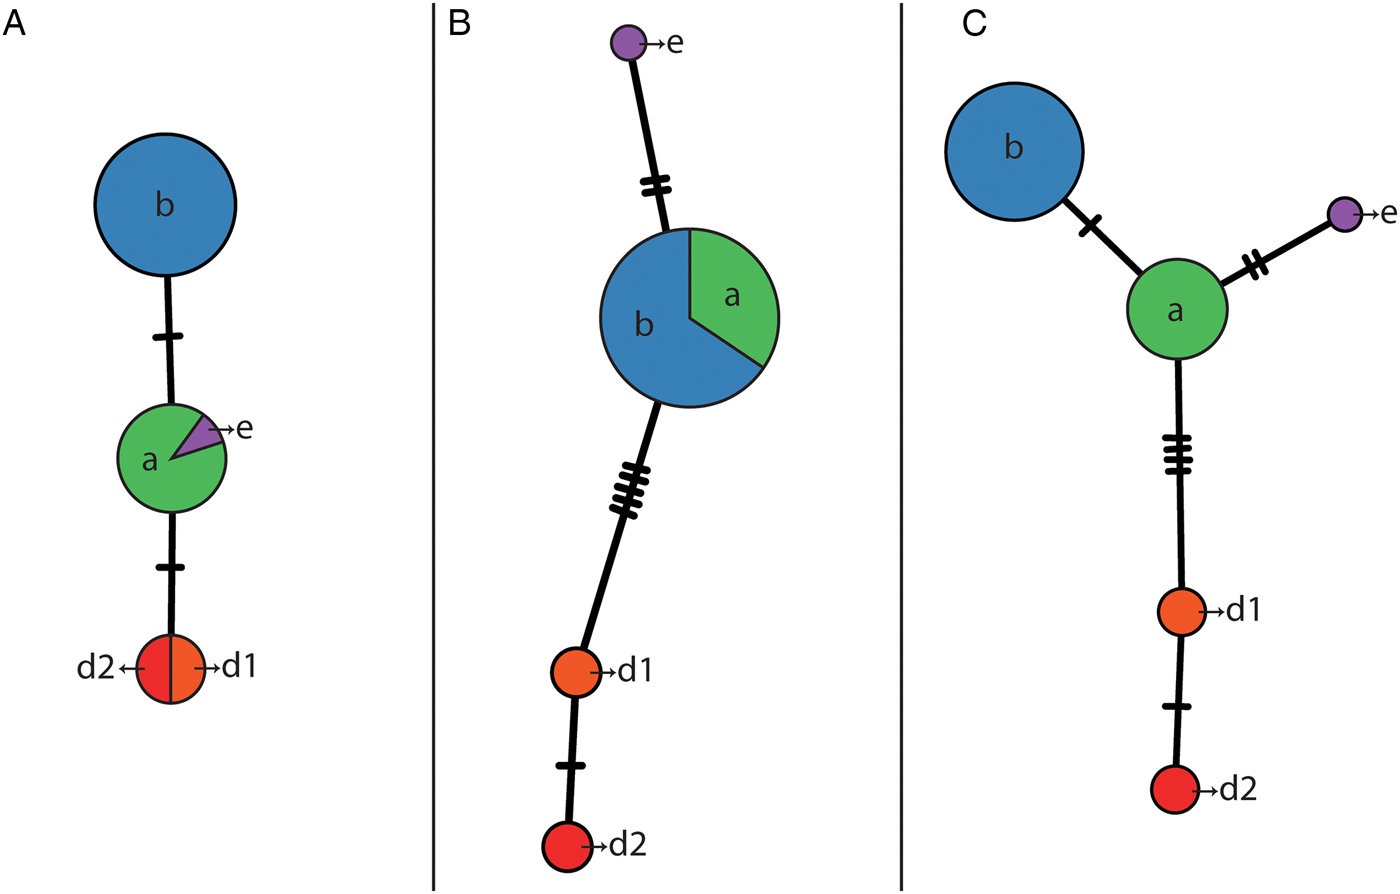
The genetic diversity analysis confirmed and supported the phylogenetic analysis. We found differences between the separated mitochondrial ribosomal rnnS and rnnL subunits (Fig. 3, Supplementary Table 1). The amplicons corresponding to the rnnS subunit only registered two segregating sites (S) leading to three different haplotypes (Fig. 3A). The haplotype diversity (Hd) was 0.598; with 0.744 average nucleotide differences (k) and a nucleotide diversity (π) of 0.0015. On the other hand, the amplicons corresponding to the rnnL subunit registered 8 segregating sites (S) leading to four different haplotypes (Fig. 3B). The haplotype diversity (Hd) was 0.297; with 1.415 average nucleotide differences (k) and a nucleotide diversity (π) of 0.004. However, the concatenated sequences rnnS and rnnL showed a total of 10 segregating sites (S; Supplementary Fig. 1), where 8 of them were parsimony informative, confirming the existence of a total of five haplotypes (Fig. 3C). The haplotype diversity (Hd) was 0.626; with 2.159 average nucleotide differences (k) and a nucleotide diversity (π) of 0.0025.
Haplotype network based on rnnS, rnnL and concatenated rnnS + rnnL mtDNA sequences, generated by statistical parsimony. The area of the circles is proportional to the sequences number. (A) Haplotype network based on rnnS mtDNA sequences. (B) Haplotype network based on rnnL mtDNA sequences. (C) Haplotype network based on concatenated rnnS + rnnL mtDNA sequences. Mutation steps between haplotypes are shown as hatch marks.

Direct haplotyping of infected crayfish samples
The specimens which showed the highest agent levels among the tested populations were selected for A. astaci haplotyping (Table 3). The qPCR agent levels of these successfully PCR amplified and sequenced samples varied between A5 and A7 (Table 3). The stone crayfish from the Schwarzbach (Germany) and the marbled crayfish sample (the Netherlands) were infected with the D-haplogroup of A. astaci. Here, the haplotype detected from the stone crayfish (GiSt5) was identical with the d1-haplotype strain SAP-Málaga, while the DNA detected from marbled crayfish (IvoOkt13) grouped together with the d2-haplotype strain AP03 (Fig. 2C). The remaining two samples from stone crayfish, i.e. populations from a feeder of the Steyr River (AUT2_1) and the Schädlbach (StGM9) in Austria, belonged to the b-haplotype.
Discussion
In this paper, we have described a mitochondrial PCR and sequencing-based approach that allows identifying the genetic diversity of A. astaci in mix genome samples, i.e. clinical and preserved samples. These mitochondrial markers are stable and reliable and the results are easily repeatable in different laboratories with samples obtained from various crayfish host species revealing moderate to high infection levels.
The target regions rnnS and rnnL were selected based on the full mitochondrial genome of Spanish A. astaci strain AP03 (D-haplogroup) (Makkonen et al. Reference Makkonen, Vesterbacka, Martin, Jussila, Diéguez-Uribeondo, Kortet and Kokko2016) and transcriptomics data of selected Finnish A. astaci strains representing the A- and B-haplogroups (Kokko et al. unpublished). The most commonly used mitochondrial barcoding gene (Hebert et al. Reference Hebert, Ratnasingham and Waard2003), cytochrome c oxidase subunit I, contained no single-nucleotide polymorphisms (SNPs) to distinguish the different A. astaci strains and was therefore left out from further analyses and method development. Furthermore, a very low GC-content of the mtDNA, especially in the intergenic regions (Makkonen et al. Reference Makkonen, Vesterbacka, Martin, Jussila, Diéguez-Uribeondo, Kortet and Kokko2016), and lacking data from intergenic regions limited the possible target regions for mtDNA haplotyping.
The specificity tests of the two primer pairs showed that the species level resolution of the mitochondrial ribosomal subunits (rnnS and rnnL) was high enough to separate closely related Aphanomyces species, i.e. A. invadans and A. frigidophilus, from A. astaci. The rnnL region exhibited higher specificity, although the overall sequence diversity of the whole PCR amplicon was more variable. However, a single Saprolegnia sp. showed 100% sequence similarity with A. astaci. Therefore, sequencing the rnnL region alone for species differentiation cannot be recommended. The rnnS region also amplified other aquatic oomycetes, such as A. hypogyna and Saprolegnia sp., but the species could be later separated based on the sequence data.
The method functionality was also compared with the microsatellite method developed by Grandjean et al. (Reference Grandjean, Vrålstad, Diéguez-Uribeondo, Jelić, Mangombi, Delaunay, Filipová, Rezinciuc, Kozubíková-Balcarová, Guyonnet, Viljamaa-Dirks and Petrusek2014). We conducted parallel analyses for studied A. astaci strains (Table 1) and infected clinical samples from infected crayfish (Table 3), and they grouped similarly with both methods. In some cases, when the agent levels detected in qPCR (Vrålstad et al. Reference Vrålstad, Knutsen, Tengs and Holst-Jensen2009) were mid-A3 or higher, the mtDNA markers showed slightly more sensitive amplification in comparison with the microsatellite markers (data not shown). The difference in the amplification sensitivity was likely caused by different copy number of the mtDNA in comparison with the nuclear DNA analysed with the microsatellite markers. In future, the application of DNA extraction methods favouring the recovery of circular (mitochondrial) DNA for crayfish tissues will likely further increase the usability of the mtDNA markers in comparison to microsatellites. On the other hand, the diversity of A. astaci observed using our mtDNA markers was lower in comparison with the microsatellite markers. Here, the mtDNA markers were highly stable overall, the interpretation of the results from sequencing data was objective. Especially if new or unexpected species and strains will be detected, sequencing can be considered as the best choice to confirm the results in the aquatic environment with unknown microbial spectrum and diversity.
The phylogenetic and genetic diversity analyses of the two concatenated regions of the mitochondrial ribosomal subunits analysed, i.e. rnnS and rnnL, based on reference strains of the groups (i.e. L1 for RAPD–PCR group A, Pl for RAPD–PCR group B, Kv1 for RAPD–PCR group C, AP03 for RAPD–PCR group D and Li10 for RAPD–PCR group E) showed similar results to those obtained by previous studies (Huang et al. Reference Huang, Cerenius and Söderhäll1994; Diéguez-Uribeondo et al. Reference Diéguez-Uribeondo, Huang and Cerenius1995; Kozubíková et al. Reference Kozubíková, Viljamaa-Dirks, Heinikainen and Petrusek2011; Grandjean et al. Reference Grandjean, Vrålstad, Diéguez-Uribeondo, Jelić, Mangombi, Delaunay, Filipová, Rezinciuc, Kozubíková-Balcarová, Guyonnet, Viljamaa-Dirks and Petrusek2014; Rezinciuc et al. Reference Rezinciuc, Galindo, Montserrat and Diéguez-Uribeondo2014). Thus, these analyses allowed the identification of two main lineages and four haplogroups. Three of these haplogroups (i.e. B-, D- and E-haplogroups) corresponded to RAPD–PCR groups B, D and E, and the fourth-one, i.e. A-haplogroup, comprised the strains from group RAPD–PCR A and C. Each haplogroup was characterized by having a single, unique haplotype, except for the D-haplogroup that possessed two haplotypes, i.e. d1 and d2. Therefore, the combination of both markers led us to clearly separate four haplogroups (A, B, D and E) with five different haplotypes in them (a, b, d1, d2 and e).
The A- and E-haplogroups were closely related haplogroups, although the haplotype network showed two SNPs between the groups of concatenated sequences. The number of isolates available from the E-haplogroup is currently limited (Kozubíková et al. Reference Kozubíková, Viljamaa-Dirks, Heinikainen and Petrusek2011; Kozubíková-Balcarová et al. Reference Kozubíková-Balcarová, Koukol, Martín, Svoboda, Petrusek and Diéguez-Uribeondo2013). Moreover, the A-haplogroup comprise sequences identical to the strain of reference for RAPD groups A (L1 strain) and C (Kv1strain). The haplotype network generated no differences between these groups. Although this fact can be important and should be taken into account in the investigations, only one strain of A. astaci belonging to the RAPD–PCR group C has been isolated so far (Huang et al. Reference Huang, Cerenius and Söderhäll1994; Kenneth Söderhäll, personal communication). Therefore, the limitation of strains corresponding to the RAPD–PCR groups C and E (Kozubíková et al. Reference Kozubíková, Viljamaa-Dirks, Heinikainen and Petrusek2011) could have hindered the estimation of the real diversity within these haplogroups. Alternatively, the limited number of variable sites in the genetic regions used here did not offer possibilities to discriminate these RAPD–PCR groups.
The A. astaci isolates for the A- and E-haplogroups were obtained from several host species (Table 1) from Eastern and Northern USA, i.e. genera Orconectes and genus Pacifastacus. However, eastern and northern parts of USA have broad and variable crayfish species diversities (Holdich, Reference Holdich2002). The host diversity likely increases also the pathogen strain diversity and accelerates the development of new lineages, haplogroups and haplotypes, as a consequence of host–parasite coevolution (Jussila et al. Reference Jussila, Vrezec, Makkonen, Kortet, Kokko and Canning-Clode2015). Moreover, the translocation of species within North America occurs (Larson et al. Reference Larson, Abbot, Usio, Azuma, Wood, Herborg and Olden2012), the three subspecies of P. leniusculus in Lake Tahoe as an example. The results observed here may be an indication of those crayfish translocations. Furthermore, it can be assumed that also mixed crayfish species populations have been created with this kind of translocations. Although no evidence of this has been shown so far, these translocations could have allowed the species jumps of the pathogen, making possible the exchange of genetic groups (e.g. Jussila et al. Reference Jussila, Vrezec, Makkonen, Kortet, Kokko and Canning-Clode2015). However, to investigate this possibility, further isolations from North American crayfish should be performed. In this kind of cases, using microsatellites would not be helpful, as distinguishing between a truly heterozygous locus or a combination of two different strains is impossible (Maguire et al. Reference Maguire, Jelić, Klobučar, Delpy, Delaunay and Grandjean2016). On the other hand, the mixture of pathogen strains might already be reality in Europe since several non-indigenous crayfish species, several members of the genus Orconectes as an example, have been introduced into Europe (Souty-Grosset et al. Reference Souty-Grosset, Holdich, Noël, Reynolds and Haffner2006), especially into Central European water bodies (Schrimpf et al. Reference Schrimpf, Chucholl, Schmidt and Schulz2013; Panteleit et al. Reference Panteleit, Keller, Kokko, Jussila, Makkonen, Theissinger and Schrimpf2017). The oldest known A. astaci lineage in Europe, i.e. RAPD–PCR group A was the basis of the a-haplotype in this study. If the RAPD–PCR group A of A. astaci, with its so far unknown original crayfish host, first arrived in Europe in the ballast water of an intercontinental ship, as speculated by Alderman (Reference Alderman1996), the East coast of North America was the likely origin for the transport. Therefore, our results seem to be in line with these speculations.
The B-haplogroup, commonly detected all over Europe due to signal crayfish P. leniusculus introductions, can be traced back to California (Souty-Grosset et al. Reference Souty-Grosset, Holdich, Noël, Reynolds and Haffner2006). Signal crayfish were first introduced to Europe from several Californian sources. Lake Tahoe is being mentioned as the main source of introductions in several papers (Abrahamsson, Reference Abrahamsson1969, Reference Abrahamsson1972; Westman, Reference Westman1972, Reference Westman2000; Goldman, Reference Goldman1972; Agerberg and Jansson, Reference Agerberg and Jansson1995). In addition, Lake Hennessey and Sacramento River were mentioned as sources of introduction in Finland (Westman, Reference Westman2000) as well as Donner Lake, American River and Pitt Lake in Sweden (Agerberg and Jansson, Reference Agerberg and Jansson1995). Based on this study, either the signal crayfish from these locations were carrying similar strains of A. astaci, or the stocking success of some of these populations was limited creating a founder effect (Agerberg and Jansson, Reference Agerberg and Jansson1995), as the all b-haplotype strains examined here were identical with the recent isolates from Lake Tahoe (Table 1). Homogeneity within B-haplogroup has also been previously detected in nuclear markers (Diéguez-Uribeondo et al. Reference Diéguez-Uribeondo, Garcia, Cerenius, Kozubíková, Ballesteros, Windels, Weiland, Kator, Söderhäll and Martin2009; Makkonen et al. Reference Makkonen, Jussila, Henttonen and Kokko2011, Reference Makkonen, Jussila and Kokko2012a).
The D-haplogroup seems to be introduced to Southern Europe (Spain) by introductions of P. clarkii (Rezinciuc et al. Reference Rezinciuc, Galindo, Montserrat and Diéguez-Uribeondo2014). However, only two strains were tested in this study. The two Spanish A. astaci strains, SAP-Málaga and AP03, split the D-haplogroup into two haplotypes, d1 and d2, respectively. Variation in this group was also observed with the microsatellite markers (unpublished data), where the first Pc-lineage has been typically connected to P. clarkii and the second one to marbled crayfish P. virginalis, a parthenogenetic species commonly available in the aquarium trade (e.g. Scholtz et al. Reference Scholtz, Braband, Tolley, Reimann, Mittmann, Lukhaup, Steuerwald and Vogt2003; Panteleit et al. Reference Panteleit, Keller, Kokko, Jussila, Makkonen, Theissinger and Schrimpf2017). In this study, the D-haplogroup mtDNA markers, which were detected from an infected crayfish tissue (Table 3), were exhibiting a similar grouping as the strains AP03 and SAP-Málaga, showing that both haplotypes are present in Spain and Germany (Fig. 2).
The application of mitochondrial markers enables now the direct identification of clinical and preserved samples of the main A. astaci haplogroups responsible for crayfish plague outbreaks. The method provides an opportunity to characterize the diversity of A. astaci strains, facilitating investigations on disease history and its epidemiology. In this paper, we have described the technique's possibilities for a direct identification of A. astaci, responsible of the crayfish plague, which is still discovered in novel regions causing devastating outbreaks (e.g. Peiró et al. Reference Peiró, Almerão, Delaunay, Jussila, Makkonen, Bouchon, Araujo and Souty-Grosset2016). We propose these mitochondrial rnnS and rnnL markers as an important tool to track and understand the A. astaci diversity and evolution among the original host species, i.e. North American crayfish species, and in the future, it may help to define if the original distributional area of A. astaci groups is a reflection of its original host species distribution and North America.
Supplementary material
The supplementary material for this article can be found at https://doi.org/10.1017/S0031182018000227
Acknowledgements
Thanks to Adam Petrusek, Charles University of Prague, Czech Republic, for providing the strains Li10 and Upor4, Satu Viljamaa-Dirks, Evira, Finland, for A. astaci strain K047/99 and Ivo Roessink, Wageningen University and Research, Netherlands, for marbled crayfish samples.
Financial support
This research has been supported by the strategic funding of the University of Eastern Finland (Innovative Research Initiatives), LIFE+CrayMate (LIFE12 INF/FI/233), Finnish Cultural Foundation, Maj and Tor Nessling Foundation and MINECO (CGL2016-80526).