Introduction
As research on the relationship between first language (L1) and second language (L2) fluency grows, we begin to discern the extent to which various L2 utterance features can be explained by L1 behavior vis-à-vis L2-specific ability. As data from different learner profiles become available, comparisons can be made to explore the relative stability of L1-L2 fluency associations across contexts (De Jong et al., Reference De Jong, Groenhout, Schoonen and Hulstijn2015) and proficiency levels. As emphasized before (De Jong et al., Reference De Jong, Groenhout, Schoonen and Hulstijn2015; Huensch & Tracy-Ventura, Reference Huensch and Tracy-Ventura2017; Kahng, Reference Kahng2020; Peltonen, Reference Peltonen2018), this knowledge is relevant for L2 fluency research, assessment, and teaching. It can assist researchers when applying appropriate adjustments to measures based on the proportion of variance that can be typically attributed to L1 fluency. Likewise, it can help language testers and teachers focus on fluency features that are more related to L2-specific ability than to speaking style. To build this knowledge, we need replication studies that can strengthen and/or refine our current understanding.
Our study conceptually replicated Huensch and Tracy-Ventura (Reference Huensch and Tracy-Ventura2017) to extend the applicability of its findings. We adopted McManus’s (Reference McManus, Gurzynski-Weiss and Kim2022) label of conceptual because many aspects of the original study are matched as closely as possible, but some major variables differed. Participants’ L2 proficiency range and the oral tasks were modified. Additionally, cross-linguistic and study abroad (SA) effects were not considered (see the “Motivation” section).
Literature review
Fluency and L2 speech processing
Following recent studies on the L1-L2 fluency link (De Jong et al., Reference De Jong, Groenhout, Schoonen and Hulstijn2015; Duran-Karaoz & Tavakoli, Reference Duran-Karaoz and Tavakoli2020; Huensch & Tracy-Ventura, Reference Huensch and Tracy-Ventura2017; Kahng, Reference Kahng2020), the current study adopts Segalowitz’s (Reference Segalowitz2010, Reference Segalowitz2016) framework for fluency research. Fluency is narrowly defined as a temporal aspect of speech with three interconnected dimensions: utterance fluency (observable and measurable features such as hesitations or speed), cognitive fluency (processing capacity underlying the relative ease of speaking as reflected in utterance fluency), and perceived fluency (listeners’ judgments about a person’s ease of speaking based on utterance features).
The current study focused on utterance fluency as indexed by speed (syllable duration), breakdown (pausing behavior), and repair (repetitions and corrections) phenomena (Skehan, Reference Skehan2009). There is some evidence that these features reflect different aspects of speech processing (De Jong, Reference De Jong2016; Felker et al., Reference Felker, Klockmann and de Jong2019; Kormos, Reference Kormos2006; Segalowitz, Reference Segalowitz2010). For example, speed and pausing patterns may reflect conceptualization and formulation processes. During conceptualization, the message is planned and information is selected for communication (Levelt, Reference Levelt1989). Reduced speed through syllable lengthening or longer pauses, specially between utterances, may be used to support this process (De Jong, Reference De Jong2016; Felker et al., Reference Felker, Klockmann and de Jong2019). Formulation entails the selection of forms to communicate the message through linguistic encoding (Levelt, Reference Levelt1989). Mid-utterance hesitations or repairs may indicate encoding (lexical retrieval or syntactic structuring) difficulties (Kahng, Reference Kahng2020; Segalowitz, Reference Segalowitz2016; Skehan, Reference Skehan2009). Additionally, self-monitoring involves attention to accuracy and adequacy during the conceptualization of the message, its linguistic encoding, and resulting speech articulation (Kormos, Reference Kormos2006; Segalowitz, Reference Segalowitz2010).
L2 speech production models (Kormos, Reference Kormos2006; Segalowitz, Reference Segalowitz2010) propose that, while conceptualization is relatively independent of L2-specific knowledge and skills, formulation, articulation, and self-monitoring rely on the degree of automaticity of L2 processing. L1 speech processing is more automatic and stable than L2 processing, which usually entails greater attentional control, especially at lower proficiency levels (Kormos, Reference Kormos2006; Segalowitz Reference Segalowitz2010). However, not all the variability in L2 features connected to formulation, articulation, and self-monitoring is explained by L2-specific knowledge and processing skills. The L1-L2 fluency connections found so far (De Jong et al., Reference De Jong, Groenhout, Schoonen and Hulstijn2015; Derwing et al., Reference Derwing, Munro, Thomson and Rossiter2009; Duran-Karaoz & Tavakoli, Reference Duran-Karaoz and Tavakoli2020; Gagné et al., Reference Gagné, French and Hummel2022; Huensch & Tracy-Ventura, Reference Huensch and Tracy-Ventura2017; Kahng, Reference Kahng2020; Peltonen, Reference Peltonen2018) suggest that L1 and L2 speech production rely on common cognitive resources (Tavakoli & Wright, Reference Tavakoli and Wright2020). Further research on the L1-L2 fluency link can help us understand this processing overlap better.
L1-L2 fluency connections
Research so far has shown that L1-L2 fluency associations vary across language combinations, that L2-specific ability may moderate this link, and that proficiency’s role may change under different learning conditions.
The way L1 fluency relates to L2 fluency may depend on language-specific phonotactics and pragmatic preferences (Huensch & Tracy-Ventura, Reference Huensch and Tracy-Ventura2017; Riazantseva, Reference Riazantseva2001). Studies with two L1s (De Jong et al., Reference De Jong, Groenhout, Schoonen and Hulstijn2015; Derwing et al. Reference Derwing, Munro, Thomson and Rossiter2009) or two L2s (Huensch & Tracy-Ventura, Reference Huensch and Tracy-Ventura2017) observed cross-linguistic effects. Derwing et al. (Reference Derwing, Munro, Thomson and Rossiter2009) found that L1-L2 correlations weakened as speakers’ L2 (English) exposure increased, although more drastically so for L1-Mandarin than for L1-Slavic speakers. De Jong et al. (Reference De Jong, Groenhout, Schoonen and Hulstijn2015) and Huensch and Tracy-Ventura (Reference Huensch and Tracy-Ventura2017) observed that language group (L1-English vs. L1-Turkish and L2-Spanish vs. L2-French respectively) significantly contributed to regression models where the response variable presented cross-linguistic differences among expert speakers. Collectively, these studies show that the L1-related variability can change across L1-L2 combinations. However, the relative stability of this variability for specific language pairs is unclear because some have only been studied once, such as L1-English/L2-Spanish.
Findings regarding the moderating effect of L2 proficiency are inconclusive. Derwing et al. (Reference Derwing, Munro, Thomson and Rossiter2009) and Riazantseva (Reference Riazantseva2001) found that L1 influence weakened with greater L2 exposure. Huensch and Tracy-Ventura (Reference Huensch and Tracy-Ventura2017) observed that most L1-L2 correlations were greater after SA, but some were weaker for their L2-French speakers. In contrast, Duran-Karaoz and Tavakoli (Reference Duran-Karaoz and Tavakoli2020) found that L1-L2 correlations were maintained across proficiency levels. These authors attribute previous conflicting results to the type of L2 linguistic knowledge measured. Some studies tap into participants’ declarative or conscious knowledge (De Jong et al., Reference De Jong, Groenhout, Schoonen and Hulstijn2015; Peltonen, Reference Peltonen2018; Riazantseva, Reference Riazantseva2001), while others capture procedural or implicit knowledge (Huensch & Tracy-Ventura, Reference Huensch and Tracy-Ventura2017), and only some combine both (Duran-Karaoz & Tavakoli, Reference Duran-Karaoz and Tavakoli2020; Kahn, Reference Kahng2020). Replication studies with the same measure can help clarify proficiency’s potential moderating effect.
Learning environment might also mediate how proficiency affects L1-L2 associations, but the imbalance in studies considering instructed versus natural settings limits our understanding. Duran-Karaoz and Tavakoli (Reference Duran-Karaoz and Tavakoli2020) intentionally excluded participants who had lived or worked among expert L2 speakers because of evidence that these experiences accelerate L2 fluency development (Mora & Valls-Ferrer, Reference Mora and Valls‐Ferrer2012; Segalowitz & Freed, Reference Segalowitz and Freed2004). They also included participants at the A2 level of the Common European Framework of Reference for languages (CEFR), a lower proficiency profile than explored before. They observed that L1-L2 fluency correlations remained relatively stable when proficiency was controlled for. Peltonen (Reference Peltonen2018), the only other study with lower-level learners (CEFR B1 and B2) in an instructed setting, also observed that most L1-L2 correlations were maintained across levels. It seems that, although in natural settings L1-L2 correlations may weaken with greater L2 exposure at least for certain language pairs (Derwing et al., Reference Derwing, Munro, Thomson and Rossiter2009), in the instructional settings studied so far the correlations remained more stable.
As mentioned, knowing how stable L1-L2 associations are across proficiency levels is relevant for research, teaching, and assessment. De Jong et al. (Reference De Jong, Groenhout, Schoonen and Hulstijn2015) explored how multiple L2 fluency features could predict L2 proficiency when corrected and uncorrected for L1 behavior. The only measure that predicted proficiency significantly better when corrected than when uncorrected was syllable duration. In other words, a significant amount of variability in L2 syllable duration was not related to L2-specific ability. Based on this result, the authors recommended correcting this measure for L1-related variability when used for research or assessment. Moreover, the authors encouraged replications testing whether “the regression slopes predicting L2 behavior and L1 behavior turn out to be quite stable” (p. 237) across contexts, which would allow researchers and language testers to apply “standard” corrections for L1 variability. The current study contributes to this effort.
Motivation
Our study is concerned with the relative stability of L1-English/L2-Spanish fluency associations in an instructed setting. We approach this topic through conceptual replication because this is an adequate form of inquiry when the goal is to extend the applicability of previous findings (Porte & McManus, Reference Porte and McManus2019). Huensch and Tracy-Ventura’s (Reference Huensch and Tracy-Ventura2017) study was selected because L1-L2 fluency associations may vary cross-linguistically (De Jong et al., Reference De Jong, Groenhout, Schoonen and Hulstijn2015; Derwing et al. Reference Derwing, Munro, Thomson and Rossiter2009; Huensch and Tracy-Ventura, Reference Huensch and Tracy-Ventura2017), and Huensch and Tracy-Ventura (Reference Huensch and Tracy-Ventura2017) is the only study analyzing L1-English/L2-Spanish.
Huensch and Tracy-Ventura compared L1-L2 fluency associations for the same participants before and after SA. They included two L2s, Spanish and French, but our study focuses on their L2-Spanish results. We do not consider SA effects because our aim is to expand current knowledge on the L1-L2 link for lower-level learners in instructed settings.
At Time 1 for L2-Spanish, Huensch and Tracy-Ventura found significant moderate correlations for mean syllable duration, end-ASU (Analysis of Speech Unit) silent pause duration (SPD), and silent pauses per second. At Time 2, all L1-L2 correlations were strengthened, but the ones that reached significance were the same three as at Time 1. In their Time 1 regression model, proficiency was a significant predictor of syllable duration and mid-ASU SPD. At Time 2, proficiency lost its predictive power. The current study examines whether the predeparture associations are maintained with less proficient learners.
While participants’ proficiency was altered for research purposes, the oral task was modified for practical reasons. Because the study was classroom based, we relied on teachers offering instructional time to accommodate us. To minimize the disruption our research would cause, we used an L2 task that was already part of the curriculum (see “Methods” section). This is a limitation: any differences between studies could be due to the learners’ proficiency, the task, or both. However, it could also be a strength if, as we expected, previous findings applied “across many more contextual variables” (Porte & McManus, Reference Porte and McManus2019, p. 94).
Our research questions followed Huensch and Tracy-Ventura’s RQ2 and RQ3 with modifications to suit the current focus.
-
1. To what extent is there a relationship between L1 and L2 fluency behavior?
-
2. To what extent can L2 utterance fluency measures be predicted from the combination of L2 proficiency and the corresponding L1 measure?
Based on previous research with lower-level learners (Duran-Karaoz & Tavakoli, Reference Duran-Karaoz and Tavakoli2020; Peltonen, Reference Peltonen2018), we expected moderate to strong correlations for the same measures that were significantly correlated at Time 1 and 2 in Huensch and Tracy-Ventura. This result would strengthen the claim that L1-L2 fluency connections persist across proficiency levels (Duran-Karaoz & Tavakoli, Reference Duran-Karaoz and Tavakoli2020). For RQ2, we expected similar effect sizes and L1 regression slopes for those three measures. This finding would confirm De Jong et al.’s (Reference De Jong, Groenhout, Schoonen and Hulstijn2015) hypothesis that, for certain L2 fluency measures, there is a stable amount of L1-related variability. If these expectations were not met, this would indicate that either task type or learners’ proficiency play a more relevant role than previously thought.
Methods
Participants
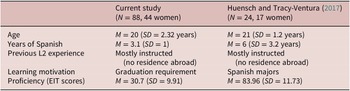
Participants were 88 L1-English speakers enrolled in multiple sections of an intermediate-level Spanish course in a university in the United States. They had not been exposed to Spanish at home, nor had they visited a Spanish-speaking country longer than 2 weeks. Their proficiency ranged from the A2 to the B1 CEFR levels (ACTFL, n.d.; Bowden, Reference Bowden2016). Table 1 compares our participants to those in Huensch and Tracy-Ventura. When comparing both studies, we refer only to Huensch and Tracy-Ventura’s predeparture L1-English/L2-Spanish dataset, unless otherwise specified.
Participant characteristics in both studies

Instruments
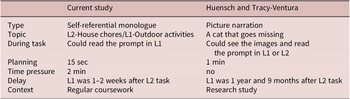
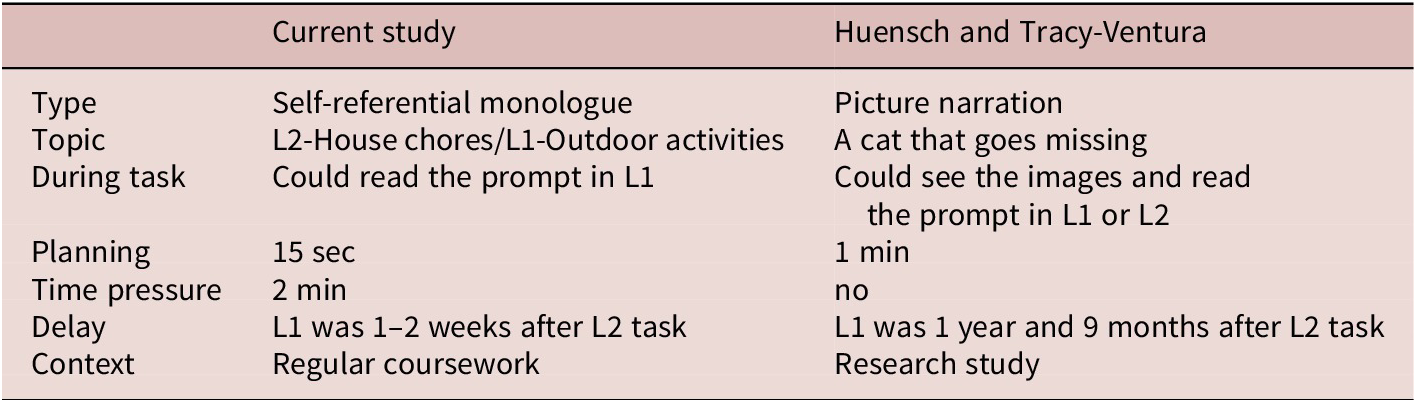
Participants completed a questionnaire seeking information on age, home language(s), and previous experience learning Spanish. To measure proficiency, we used the Spanish Elicited Imitation Task (EIT; Bowden, Reference Bowden2016; Ortega, Reference Ortega2000) with the same stimuli, procedure, and rating criteria as in Huensch and Tracy-Ventura (Reference Huensch and Tracy-Ventura2017). The L1 and L2 tasks (Appendix) differed from those in Huensch and Tracy-Ventura (Reference Huensch and Tracy-Ventura2017). Instead of using an unfamiliar L2 task for students, we used one they had produced as coursework during week eight of the semester, at the beginning of a regular class after a 2-week lesson on the topic of house chores. In other words, the task was not designed for research but for pedagogical (formative assessment) purposes, and participants did not produce it specifically for the research study. The L1 task was created to resemble the L2 task with a different topic to avoid influence on idea generation. The L1 task was recorded 1 week to 2 weeks later, depending on when researchers could visit the class. Table 2 compares tasks in both studies.
Tasks in the current study and in Huensch and Tracy-Ventura (Reference Huensch and Tracy-Ventura2017)
Procedures
The invitation to participate and the consent process happened during a regular class session without the instructor present. At that time, participants completed the questionnaire, the EIT, and the L1 task. The consent form asked for participants’ permission to use the L2 task. All audio recordings were done in a classroom, using the participants’ own devices, and uploaded to a secure online location. The recordings with insufficient quality and from participants lacking the Spanish task were discarded.
The oral tasks were transcribed orthographically, including filled pauses (uhs and ums), and manually segmented into syllables and Analysis of Speech units (Foster et al., Reference Foster, Tonkyn and Wigglesworth2000). AS-units and syllables from 30 participants were measured a second time. Interrater reliability was adequate: ICC = .90 for AS-units and ICC = .99 for syllables. EIT data from 30 participants were also scored twice (ICC = .96). Silent pauses (> 250 ms) were automatically segmented using Praat (Boersma & Weenik, Reference Boersma and Weenink2000) and manually checked for accuracy. Silent pauses were annotated for location within or between AS-units. The fluency measures obtained were the same as in Huensch and Tracy-Ventura (p. 765).
Analyses
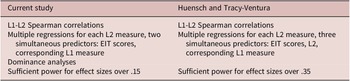
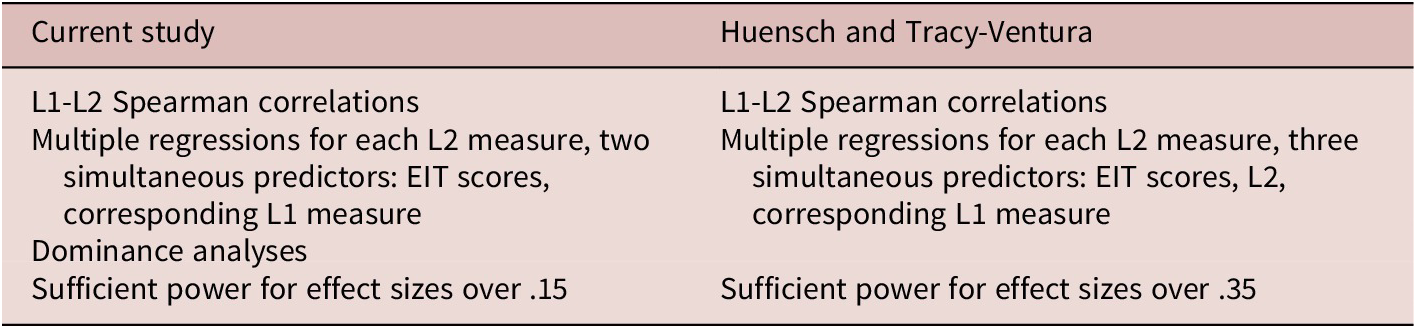
Spearman (most fluency measures presented outliers and were not normally distributed) correlations (SPSS v27) explored the relationships between each L2 fluency measure and its corresponding L1 measure (RQ 1). Multiple regressions for each L2 measure with two predictors (EIT scores and the corresponding L1 measure) explored the proportion of variance explained by the same L1 measure and proficiency (RQ 2). Dominance analyses (Mizumoto, Reference Mizumoto2015) determined the relative importance of predictors in each model. Multicollinearity was not a concern (VIF values between 1 and 1.024), but normality of residuals could not be assumed (significant Kolmogorov–Smirnov tests) in most cases. After all fluency variables except L1 and L2 silent pauses/second were transformed (Sqrt for repetitions and corrections, Log10 for the rest), normality of residuals was achieved. Homoscedasticity could also be assumed, as the scatterplots of residuals versus predicted values showed no clear patterns nor values over ±3. Post hoc power analyses revealed that power was .90 and .99 for effect sizes of .15 and .35 respectively. While sufficient (i.e., >.80) to support findings with effect sizes greater than .15, power was inadequate (.19) for effect sizes estimated at .02. Table 3 compares the analyses in both studies.
Data analysis in the current study and in Huensch and Tracy-Ventura (Reference Huensch and Tracy-Ventura2017)
Results
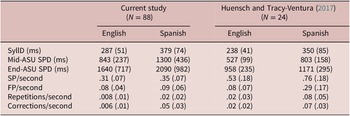
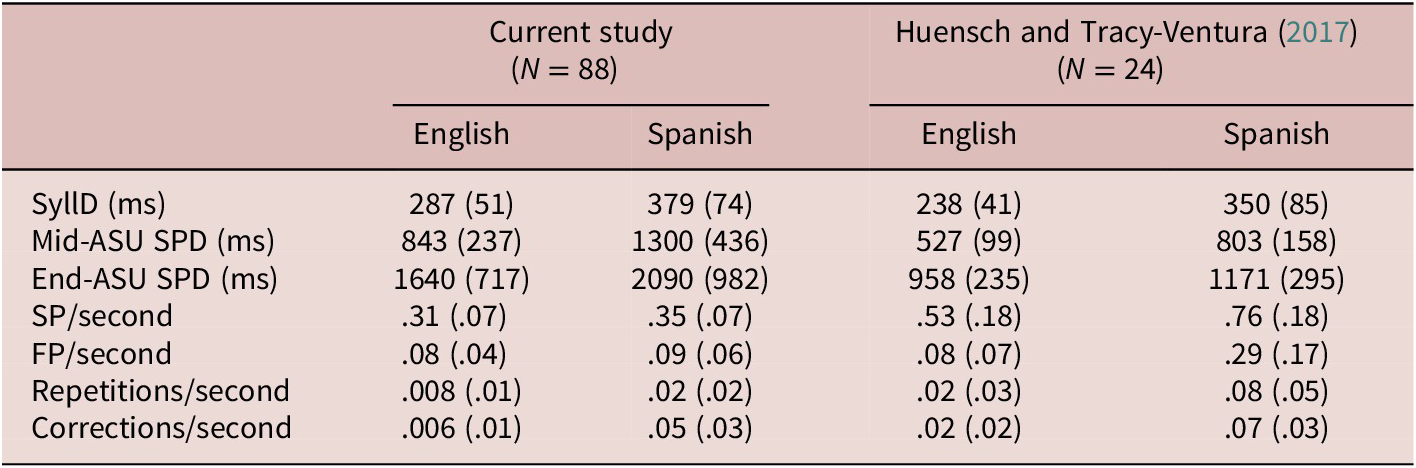
Table 4 compares descriptive statistics in both studies for all measures separated by language.
Means (standard deviations) of L1 (English) and L2 (Spanish) fluency measures in both studies
Note: ASU, analysis of speech units; SPD: Mean silent pause duration; SyllD: Mean syllable duration; SP: Silent pauses; FP: Filled pauses.
Participants’ L1 and L2 SyllD were similar. However, our participants paused less frequently but longer, perhaps due to the unscripted nature and fewer lexical constraints of our oral tasks. This may also explain differences in L1 and L2 repair fluency for the two studies.
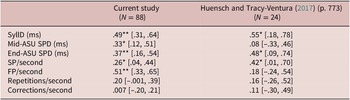
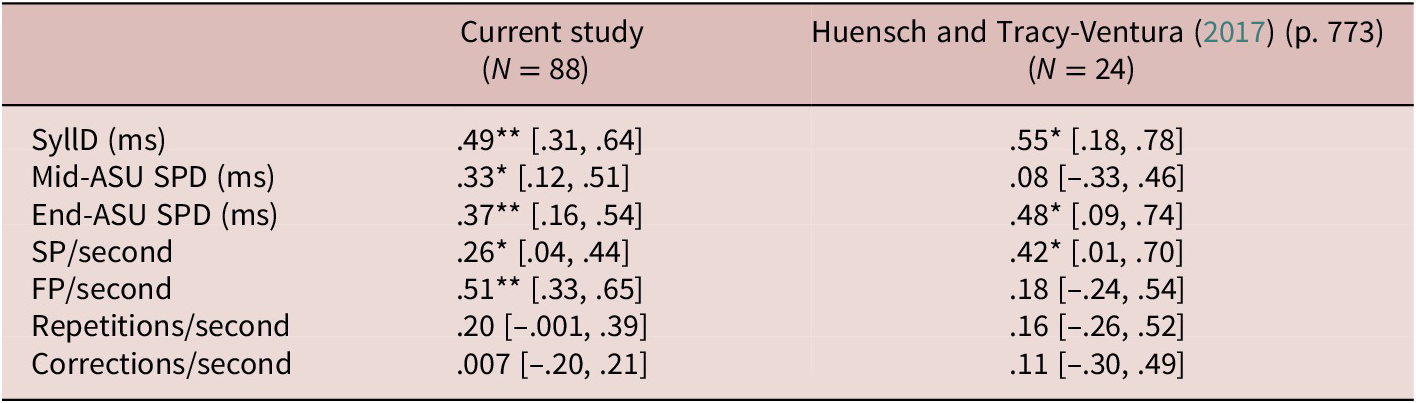
Table 5 presents Spearman correlations between L1 and L2 fluency measures in the two studies (RQ 1). Huensch and Tracy-Ventura (Reference Huensch and Tracy-Ventura2017) did not include confidence intervals (CIs), but we calculated them from the rs and N values they report, for a 95% confidence level.
Correlations (rs [CIs]) between L1 and L2 fluency measures in both studies
Note: ASU: analysis of speech units; SPD: Mean silent pause duration; SyllD: Mean syllable duration; SP: Silent pauses; FP: Filled pauses.
*p < .05; **p < .001.
Both studies observed significant medium correlations for SyllD and end-ASU SPD. The coefficients varied, but these values are sensitive to sample size. Statistical significance was also reached for SP/second, although the relationship was weak in our study. Additionally, L1-L2 repair measures were not significantly correlated in either study. In contrast, our study found significant L1-L2 correlations for mid-ASU SPD and FP/second that were not observed in Huensch and Tracy-Ventura.
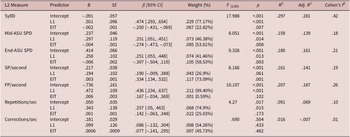
Table 6 presents the multiple regressions results (RQ2). The standardized coefficients (β) column shows the change that each predictor causes on the L2 response variable when the other predictor is held constant. The weight column represents the percentage of the R2 for the model that each predictor contributes. Finally, recall that statistical power was sufficient for effect sizes greater than .15.
Regression models predicting L2 measures from L1 measures and L2 proficiency (N = 88)

Note: L1, corresponding L1 measure; EIT, Elicited Imitation Task (L2 proficiency measure); ASU, analysis of speech units; SPD: Mean silent pause duration; SyllD: Mean syllable duration; SP: Silent pauses; FP: Filled pauses.
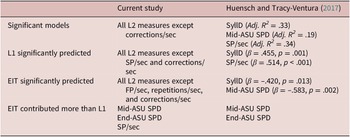
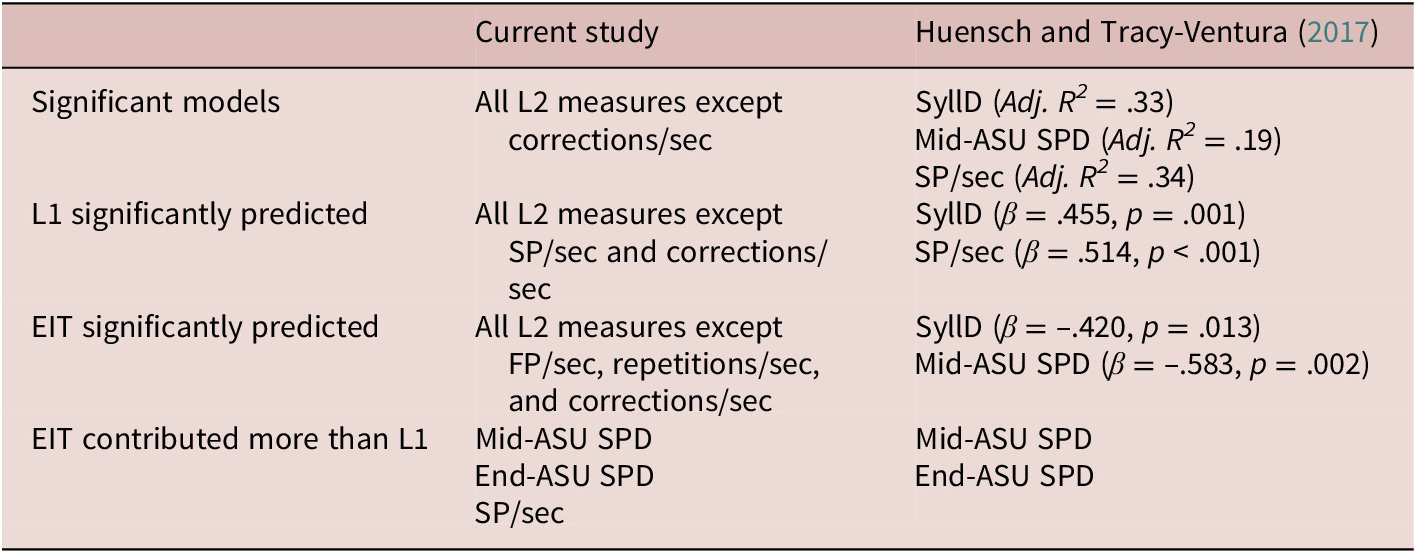
Table 7 compares the regression findings from the two studies. Recall that Huensch and Tracy-Ventura (Reference Huensch and Tracy-Ventura2017) included target language as a third predictor.
Comparison of multiple regression findings in both studies
Note: L1, corresponding L1 measure; EIT, Elicited Imitation Task (L2 proficiency measure); ASU, analysis of speech units; SPD: mean silent pause duration; SyllD: Mean syllable duration; SP: Silent pauses; FP: Filled pauses.
Both studies obtained significant models for SyllD, Mid-ASU SPD, and SP/sec, and nonsignificant models for corrections/second. Proficiency and L1 significantly predicted L2 SyllD across studies and, in both cases, L1 was the strongest predictor. Huensch and Tracy-Ventura’s (Reference Huensch and Tracy-Ventura2017) model for this measure explained 33% of the variance. In our study, with one less predictor, it was about 5% less, 28.1%.
In both studies, proficiency predicted L2 Mid-ASU SPD significantly better than the corresponding L1 measure. While Huensch and Tracy-Ventura’s (Reference Huensch and Tracy-Ventura2017) model explained 19% of the variance, our analysis explained 13.9% with one less predictor (again only about 5% less). Proficiency also contributed more to End-ASU SPD than the corresponding L1 measure in both studies. However, the model in Huensch and Tracy-Ventura (Reference Huensch and Tracy-Ventura2017) was nonsignificant and only explained 6% of the variance. In our study, both predictors combined accounted for 16.1% of the variance.
Although the models for L2 SP/second reached significance in both studies, L1 and proficiency contributed differently. In Huensch and Tracy-Ventura (Reference Huensch and Tracy-Ventura2017), L1 was a significant predictor (β = .514, p < .001) but proficiency was not. In our study, proficiency was a significant predictor (β = .334, p = .001) but L1 was not. Another difference was that Huensch and Tracy-Ventura’s (Reference Huensch and Tracy-Ventura2017) model for FP/sec was nonsignificant while our model explained 20.7% of the variance.
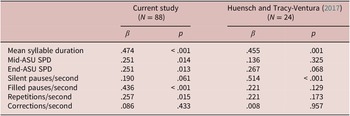
A comparison of the L1 beta coefficients (Table 8) shows the relative stability of L1-related change on L2 fluency when proficiency was accounted for. Interestingly, when Huensch and Tracy-Ventura (Reference Huensch and Tracy-Ventura2017) repeated the analysis after SA, the L1-SyllD slope experienced only a slight increase (β = .483), but all other L1 slopes became much steeper.
L1 beta coefficients (slopes) for L2 measures in both studies

Note: ASU, analysis of speech units; SPD: Mean silent pause duration.
Discussion
RQ1
Our study aligned with previous research in that most L2 fluency measures examined could be explained to some extent by L1 behavior. Most importantly, we replicated with less proficient learners, a different task, and greater statistical power the significant correlations found in Huensch and Tracy-Ventura (Reference Huensch and Tracy-Ventura2017) for SyllD, End-ASU SPD, and SP/second. As mentioned, at Time 2 in Huensch and Tracy-Ventura (Reference Huensch and Tracy-Ventura2017) all L1-L2 relationships were stronger, but only the same three correlations that were significant at Time 1 reached significance again. Combined, these results suggest that L1-L2 significant relationships show early in L2 development and remain significant over time. This result is consistent with Peltonen’s (Reference Peltonen2018) and Karaoz and Tavakoli’s (Reference Duran-Karaoz and Tavakoli2020) findings with lower-level learners, and they support their claims about the persistence of L1-L2 fluency associations.
Neither study found L1-L2 associations for repair fluency. Interestingly, repair fluency coefficients became stronger but remained non-significant at Time 2 in Huensch and Tracy-Ventura (Reference Huensch and Tracy-Ventura2017). This could be because our repair measures were inadequate to reveal L1-L2 associations. However, De Jong et al. (Reference De Jong, Groenhout, Schoonen and Hulstijn2015) found strong correlations with the same measures and intermediate proficiency participants (CEFR B1 and B2). Their study included multiple task types and a different language pair. More research is needed to explore whether these variables influence L1-L2 repair fluency.
We found two significant correlations, Mid-ASU SPD and FP/sec, that were also observed in previous studies with different language pairs (De Jong et al., Reference De Jong, Groenhout, Schoonen and Hulstijn2015; Duran-Karaoz & Tavakoli, Reference Duran-Karaoz and Tavakoli2020; Peltonen, Reference Peltonen2018) but not in Huensch and Tracy-Ventura (Reference Huensch and Tracy-Ventura2017). This contrast can be due to the different hesitation patterns that both groups of speakers displayed (Table 4). Silent pauses were generally shorter but more frequent for Huensch and Tracy-Ventura’s (Reference Huensch and Tracy-Ventura2017) participants in both languages, which indicates a potential task effect. Our participants had less planning time, which probably affected pausing time while speaking. Additionally, picture narrations can facilitate conceptualization, but the constraints of the visual cues can challenge lexical retrieval (Gagné et al., Reference Gagné, French and Hummel2022). In self-referential tasks, conceptualization may take longer but formulation is less constrained. These different cognitive demands may affect pausing patterns (Felker et al., Reference Felker, Klockmann and de Jong2019; Tavakoli & Wright, Reference Tavakoli and Wright2020), and possibly alter L1-L2 pausing relationships (Gagné et al., Reference Gagné, French and Hummel2022). Nevertheless, other studies that found a strong L1-L2 link for Mid-ASU SPD also used picture narrations (Duran-Karaoz & Tavakoli, Reference Duran-Karaoz and Tavakoli2020; Peltonen, Reference Peltonen2018). An explanation based on speaking style is also possible. People who tend to produce relatively short pauses may also exhibit more repetitions (De Jong et al., Reference De Jong, Groenhout, Schoonen and Hulstijn2015). Huensch and Tracy-Ventura’s (Reference Huensch and Tracy-Ventura2017) participants did produce more repetitions than our participants in English and Spanish, which may have influenced their pausing behavior. Nevertheless, these tentative explanations need further replication.
Participants in both studies produced the same L1 filler ratio (which eliminates potential task effects) but varied considerably in their L2 behavior (Table 4). Our participants’ L2 filler ratio was related to their speaking style, which coincides with previous research (De Jong et al., Reference De Jong, Groenhout, Schoonen and Hulstijn2015; Duran-Karaoz & Tavakoli, Reference Duran-Karaoz and Tavakoli2020; Kahng, Reference Kahng2020; Peltonen, Reference Peltonen2018). In contrast, Huensch and Tracy-Ventura (Reference Huensch and Tracy-Ventura2017) participants’ L2 filler ratio diverged from their L1 behavior, from that of L1-Spanish speakers, and from their own L2 behavior at Time 2, when a strong L1-L2 correlation was observed. Thus, although compared to Huensch and Tracy-Ventura (Reference Huensch and Tracy-Ventura2017) at Time 1 our results do not show that L1-L2 relationships persist across proficiency levels for filled pauses, compared to Time 2 they do. Huensch and Tracy-Ventura’s (Reference Huensch and Tracy-Ventura2017) L2 filler ratio at Time 1 might be related to the psycho-social conditions surrounding the performance (Tavakoli & Wright, Reference Tavakoli and Wright2020). If participants were more self-conscious of their speech, they might have engaged more in self-monitoring, which might also explain their greater repetition rate in L1 and L2. Research including participants’ perceptions of the task would be necessary to test this explanation.
RQ2
Our regression results patterned with Huensch and Tracy-Ventura (Reference Huensch and Tracy-Ventura2017) in effect size and relative predictor contributions for speed, repairs, and mid-ASU SPD, which reinforces the claim that L1-L2 fluency associations persist across proficiency levels (Duran-Karaoz & Tavakoli, Reference Duran-Karaoz and Tavakoli2020), at least for certain performance features.
For SyllD, L1 behavior was a stronger predictor than proficiency in both studies and L1 regression slopes were relatively similar. This is significant because it confirms De Jong et al.’s (Reference De Jong, Groenhout, Schoonen and Hulstijn2015) proposal that the amount of L1-related variability in some L2 fluency measures is stable. We would add that this stability could be language-specific because our values are close to Huensch and Tracy-Ventura’s (Reference Huensch and Tracy-Ventura2017), but not those found in De Jong et al. (Reference De Jong, Groenhout, Schoonen and Hulstijn2015) for different language pairs. However, this speculation would need further replication.
As expected, L1 was also a stronger predictor than proficiency for End-ASU SPD. However, although both studies obtained similar L1 regression slopes (Table 8), L1’s contribution relative to proficiency was different. In our study, proficiency contributed almost 20% more than L1, while both predictors had similar weight in Huensch and Tracy-Ventura (Reference Huensch and Tracy-Ventura2017). Additionally, both studies found significant correlations for End-ASU SPD, but our regression model explained 16.1% of the variability versus 6% in Huensch and Tracy-Ventura (Reference Huensch and Tracy-Ventura2017). This difference may have impacted the overall effect. Nevertheless, this proficiency-based explanation is limited by the fact that task type and sample size could also play a role: Huensch and Tracy-Ventura’s (Reference Huensch and Tracy-Ventura2017) statistical power was insufficient for small effect sizes, and, as explained, different task constraints on conceptualization influence End-ASU pausing behavior.
Proficiency contributed more than L1 to L2 Mid-ASU SPD across studies, despite differences in proficiency level and task. This result may be related to the learning environment because at Time 2 in Huensch and Tracy-Ventura (Reference Huensch and Tracy-Ventura2017) proficiency lost its predictive power for this measure. Mid-ASU pauses tend to be longer and more frequent in the L2 because they signal more controlled, less automatic speech processing (Kormos, Reference Kormos2006; Segalowitz, Reference Segalowitz2010). There is evidence that SA significantly enhances L2 fluency development over nonimmersion instructional settings (Mora & Valls-Ferrer, Reference Mora and Valls‐Ferrer2012; Segalowitz & Freed, Reference Segalowitz and Freed2004), and that Mid-ASU pauses benefit from SA more than other aspects of fluency such as End-ASU pauses or repair ratio (Huensch and Tracy-Ventura, Reference Huensch and Tracy-Ventura2017; Leonard & Shea, Reference Leonard and Shea2017). This is probably due to SA-related changes in the processing capacities that underlie automaticity (Leonard & Shea, Reference Leonard and Shea2017). This SA effect was not observed for other measures in Huensch and Tracy-Ventura (Reference Huensch and Tracy-Ventura2017), probably because automaticity develops gradually at varying rates for different performance features (Leonard & Shea, Reference Leonard and Shea2017).
Results for silent pause frequency were also different. Huensch and Tracy-Ventura’s (Reference Huensch and Tracy-Ventura2017) model explained 34% of the variance and L1 was a much stronger predictor than proficiency. Our model explained 14.1% of the variance and proficiency contributed twice as much as L1, which can indicate an effect of participants’ level. Proficiency gains contribute to automaticity (Kormos, Reference Kormos2006), and with greater automaticity, L2 speech production may draw more on cognitive resources that also mediate L1 performance (Tavakoli & Wright, Reference Tavakoli and Wright2020). L2-specific ability still matters (Kahng, Reference Kahng2020; Leonard & Shea, Reference Leonard and Shea2017), but L1 behavior may become a stronger predictor of L2 fluency because both speech processes rely on nonlanguage specific cognitive capacities like working memory (Tavakoli & Wright, Reference Tavakoli and Wright2020). However, this tentative interpretation needs further replication because task effects cannot be discarded here.
Limitations
Besides task type, a limitation in our study is the lack of baseline L1-Spanish data produced with the same task, which weakens our claim that the differences observed in pausing length and frequency are due to task effects. Likewise, because participants spoke different L1 varieties (American vs. British English), we cannot discard cross-dialectal influences to explain the contrasting pausing patterns.
Conclusion
Despite differences, our findings aligned with Huensch and Tracy-Ventura’s (Reference Huensch and Tracy-Ventura2017) more than they departed from it. We conceptually replicated Huensch and Tracy-Ventura’s (Reference Huensch and Tracy-Ventura2017) results for speed and repair fluency, and we found similar trends for silent pause duration. Further replication would be needed to explain differences in silent and filled pause frequency. Considered together, both studies show that some moderate to strong L1-L2 fluency associations are revealed early in L2 development and persist across proficiency levels, task type, and learning contexts. Additionally, L1-related variability may be stable for specific measures and language combinations. Future research should keep testing this stability hypothesis through replication.
Competing interests
The authors declare none.
Appendix
Spanish task
Tell me about the chores you do or did at your parents’ house and where you live now. You might want to talk about the following:
-
• What chores do (or did) you do every day?
-
• What chores do (or did) you do every week? Every month?
-
• What chores do (or did) your parents do? And your roommates now?
-
• What chores do you like and not like to do?
-
• What chores do you to do?
You have 15 seconds to think about the topic. Then, please speak for about 2 minutes.
English task
Tell me about your favorite outdoor activities and whether you enjoy nature. You might want to talk about the following:
-
• What are your favorite outdoor activities? Why do you like them?
-
• Who do you do those activities with?
-
• How much time do you spend outdoors?
-
• Is it the same or different in the summer and the winter?
-
• Do you enjoy nature? Why?
You have 15 seconds to think about the topic. Then, please speak for about 2 minutes.