Implications
Day old chick quality is crucial for profitable broiler production but a difficult trait to define. In hatchery practice, chick quality is judged on a binomial scale as first grade chicks are placed at farms and second grade chicks are culled after hatch. This study investigates reasons for classifying chicks as second grade, and confirms that the selection of second grade chicks seems justified, based on high mortality in these chicks on farm. In first grade chicks, navel quality is the only physical trait influencing growth, of the five traits evaluated in a practical chick quality score.
Introduction
High quality of day old chicks is crucial for profitable broiler production (Decuypere and Bruggeman, Reference Decuypere and Bruggeman2007), but has been found a difficult trait to define (Willemsen et al., Reference Willemsen, Everaert, Witters, De Smit, Debonne, Verschuere, Garain, Berckmans, Decuypere and Bruggeman2008). Chick length, chick weight and qualitative scores were used in previous research with variable predictive value for later performance (Willemsen et al., Reference Willemsen, Everaert, Witters, De Smit, Debonne, Verschuere, Garain, Berckmans, Decuypere and Bruggeman2008). In the hatchery, chick quality is currently judged on a binomial scale: right after hatch, a batch of chicks is divided into first grade or saleable chicks and second grade chicks (Decuypere and Bruggeman, Reference Decuypere and Bruggeman2007). There are limited data on the percentage of second grade chicks in hatchery practice, since these data are not collected routinely, and there is no uniform definition nor method to qualify chicks into first or second grade. Information on the occurrence of second grade chicks as such may be valuable to the hatchery industry because these chicks are culled right after hatch, and therefore of direct economic importance. These data may, however, also be indicative for subsequent flock performance. In scientific research, the percentage of second grade chicks in a flock has been used as an indicator of flock quality and found to vary with egg storage duration (Tona et al., Reference Tona, Onagbesan, De Ketelaere, Decuypere and Bruggeman2004; Reijrink et al., Reference Reijrink, Berghmans, Meijerhof, Kemp and van den Brand2010), pre-incubation treatments during storage (Reijrink et al., Reference Reijrink, Meijerhof, Kemp, Graat and van den Brand2009) and incubation temperature profile (Lourens et al., Reference Lourens, van den Brand, Meijerhof and Kemp2005), and large variation (0.0% to 20.6%) was found among these studies. Chicks were classified as second grade when they ‘were not able to stand straight up or showed visible signs of suboptimal incubation conditions, such as red hocks or rough navels’ (Lourens et al., Reference Lourens, van den Brand, Meijerhof and Kemp2005), or as all chicks that were not a first grade chick, ‘being clean, dry and free from deformities, completely sealed navel, and no yolk sac or residual membrane protruding from the navel’ (Tona et al, Reference Tona, Onagbesan, De Ketelaere, Decuypere and Bruggeman2004; Reijrink et al., Reference Reijrink, Meijerhof, Kemp, Graat and van den Brand2009 and Reference Reijrink, Berghmans, Meijerhof, Kemp and van den Brand2010).
Little is known on the reasons for classifying chicks as second grade in hatchery practice, and it has not been investigated whether these chicks actually have smaller chances for survival and perform suboptimally. Therefore, we conducted a study to investigate (1) the quality of a flock of broiler chicks based on a qualitative score of first grade chicks, and based on the incidence of second grade chicks, and to assess the relation with post-hatch flock performance and (2) the reasons for classifying chicks as second grade, and the potential of these chicks for survival and post-hatch growth. An experiment was conducted in which we followed the performance of first and second grade broiler chicks obtained from two breeder flocks, that hatched in two different hatching systems. The latter two factors were introduced to investigate whether the relationship between chick quality and post-hatch performance is affected by background of the chicks or different hatching conditions.
Material and methods
Incubation and chick management
Hatching eggs were obtained from two commercial Ross 308 breeder flocks of different ages: flock A aged 35 weeks and flock B aged 53 weeks. Eggs were stored for 2 to 3 days before being set in a Microclimer 57600 setter (HatchTech, Veenendaal, the Netherlands). A standard single-stage incubation program was used in the setter during which the set point temperature was gradually decreased from 38.1°C at embryo day (E) 0 to 37.5°C at day E18. At day E18, eggs were candled and apparently fertilized eggs were randomly divided and transferred to two hatching systems (SYS): 10 623 eggs of flock A and 6554 eggs of flock B were transferred to hatcher baskets and placed in a H192 hatcher (Petersime, Zulte, Belgium), and 10 578 eggs of flock A and 6527 eggs of flock B remained positioned on the setter trays and were transported to the Patio system. The Patio system is a multi-tiered broiler housing concept consisting of two system rows (Vencomatic BV, Eersel, the Netherlands), where the hatching and rearing phase are combined (van de Ven et al., Reference van de Ven, van Wagenberg, Groot Koerkamp, Kemp and van den Brand2009). Transport of the eggs to the Patio system occurred in a climate-conditioned truck at an air temperature of 30°C, and took 30 min. Upon arrival in the Patio house, eggs on the setter trays were equally distributed over six tiers of one of the two system rows.
A standard hatching program was used in the hatcher, starting at a set point temperature of 37.2°C at day E18 and gradually decreasing to 36.4°C at day E21. In Patio, the set point temperature from day E18 to day E21 was 35.0°C. In preliminary (unpublished) trials, this temperature was found to lead to highest hatchability in Patio. At day E21.5, equivalent to day 0 post-hatch (day 0; meaning the normal day of placement in the broiler house), chicks were collected from the hatcher, and subjected to (Dutch) standard hatchery procedures (separation from eggshells and unhatched eggs, counted, and put into transport boxes), however, the selection of second grade chicks was omitted. Thus, all chicks that hatched in the hatcher, including second grade chicks, were transported to the Patio system for 30 min in an air-conditioned truck and distributed equally over the six tiers of the empty system row upon arrival.
For Patio chicks, the moment of access to feed and water was immediately after hatching, while the Hatchery chicks had access from the moment they were placed in the Patio system at day 0, corresponding to common broiler practice. Chicks were given a commercially available diet and raised at standard conditions according to the recommendations of the breeder company, until slaughter weight was reached at day 42.
Data collection
At the end of incubation (at day E21.5/day 0), hatchability per flock was calculated as the ratio of the number of all chicks hatched over the number of fertilized eggs transferred to each hatching system at day E18. After placement of the Hatchery chicks in the Patio system at day 0, the hatchery manager responsible for selection of second grade chicks in the hatchery (Belgabroed, Veldhoven, the Netherlands), was invited to the Patio house to select all second grade chicks (Q2) from both flocks hatched in the two hatching systems. In addition, a sample of approximately 100 first quality chicks (Q1) was randomly selected from both flocks and both hatching systems (n = 414). The sample of Q1 and all Q2 chicks of both flocks and both hatching systems were tagged with individual numbers, and housed together in one group in a separated compartment (2.3 m × 17.3 m) in the Patio system, at a stocking density reflecting commercial standards.
The quality of each Q1 chick was assessed using the Pasgar©score (Boerjan, Reference Boerjan2002). Based on this score, the quality of each chick was evaluated based on five criteria: (1) Navel condition (black button or leaky navel); (2) Yolk sac (large size of the residual yolk sac); (3) Red hocks (red or swollen hocks); (4) Abnormal beak (red beak or nostrils contaminated with albumen); and (5) Low alertness. For each of the five criteria, one point was subtracted from 10, with chicks scoring 10 being free of any abnormality and 5 being the lowest score.
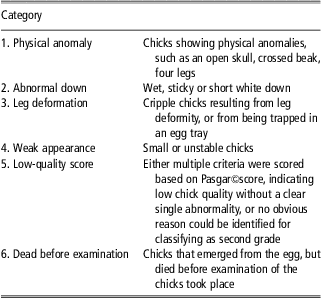
For each Q2 chick, the apparent reason for being classified as second grade was registered. Reasons for classifying chicks as second grade were grouped in six categories, which are described in Table 1. Chicks that were clearly not viable, were registered and culled directly after examination. Individual weights of all Q1 and Q2 chicks were taken at days 0, 7, 21 and 42, and mortality was registered daily.
Description of categories of second grade (Q2) chicks

Data and statistical analyses
Data were analysed with the SAS 9.1 software package (SAS Institute, 2004). In all analyses, the experimental unit was the individual egg (data on hatchability) or chick (data on Q2 incidence, Pasgar©score, chick weights, mortality).
Correlations between Pasgar©score and chick weights at various ages were determined per flock and hatching system combination, using the CORR procedure. When data were normally distributed, Pearson correlations were used; otherwise, Spearman correlations were used. Effects of single Pasgar©score-criterion and of Q2 category on Q1 and Q2 chick weights, respectively, were assessed using the GENMOD procedure, according to the following model:

where Y was chick weight at days 0, 7, 21 or 42.
Main effects of hatching system (SYS) and breeder flock (Flock), and the interaction term were analysed using the same procedure, according to the following model:

where Y was % hatchability, total incidence of Q2 chicks, incidence per Q2 category, % cumulative mortality at days 0, 7 and 42, mean Pasgar©score, % scores of individual Pasgar©score-criteria and chick weights at days 0, 7, 21 and 42.
For normally distributed data (chick weights at days 0, 7, 21 and 42) the Identity link was used, for binomial data (% hatchability, total incidence of Q2 chicks, incidence per Q2 category, % cumulative mortality, incidence of individual Pasgar©score-criteria) the Logit link function was used; for multinomial data (mean Pasgar©score (5 to 10)), the Cumulative logit link was used (SAS Institute, 2004). P-values ⩽ 0.05 were considered statistically significant.
Results
Hatchability
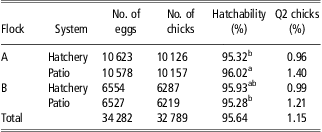
Results on hatchability are summarized in Table 2. For hatchability, a Flock × SYS interaction was observed (P < 0.01): in flock A, hatchability was higher in Patio than in Hatchery eggs, whereas no significant difference was found in hatchability between systems for flock B.
Number of eggs and chicks, hatchability of fertile eggs, and incidence of second grade chicks, of eggs obtained from a breeder flock aged 35 weeks (A) and a flock aged 53 weeks (B), hatched in Hatchery or in Patio conditions

Within columns, values with different superscripts differ significantly (P ⩽ 0.05).
Q1 chicks
Quality × performance. Data on the mean Pasgar©score of the Q1 chicks and incidences of each of the criteria is summarized in Table 3; chick weights at each age are shown in Figure 1. At day 7, a total of four chicks had died (0.97%), and at day 42, total cumulative mortality was eight chicks (1.93%). Because mortality was low, an association with mean Pasgar©score or any of the Pasgar©score-criteria could not be assessed.
Mean ± s.e. of Pasgar©scores and incidences of five criteria used in the Pasgar©score of about 100 first grade chicks (Q1) from a breeder flock aged 35 weeks (A) and a flock aged 53 weeks (B), hatched in Hatchery or in Patio conditions

Least squares means (and s.e.) of body weights of first grade chicks (Q1) obtained from a breeder flock aged 35 weeks (A) and a breeder flock aged 53 weeks (B) at four chick ages: days 0, 7, 21 and 42.

Mean weight of all Q1 chicks at day 42 was 2528 g. Correlations among mean Pasgar©score and chick weights were not significant at any of the ages tested, irrespective of hatching system or flock (Table 4). Correlations among body weights (BWs) at various ages were all positive and decreased with increasing time lapse between the measurements.
Correlations among Pasgar©score, and chick body weights at days 0, 7, 21 and 42, of about 100 first grade chicks from a breeder flock aged 35 weeks (A) and a flock aged 53 weeks (B), hatched in Hatchery or in Patio conditions

*Correlations significantly different from 0; P ⩽ 0.05.
**Correlations significantly different from 0; P ⩽ 0.01.
Analyses of effects of individual Pasgar©score-criteria on growth revealed that Yolk sac influenced chick weight at day 0 (P < 0.01): chicks with this abnormality were 4.0 g heavier than chicks without this abnormality. There was no effect of Yolk sac on BW at the other ages tested. Chicks that were scored for Low alertness were 2.7 g heavier than chicks without this score (P = 0.03) at day 0, and 8.3 g heavier at day 7 (P = 0.04). At later ages, this effect was not apparent. Chick weight at day 42 was only affected by Navel condition: chicks scored for suboptimal Navel condition weighed 80 g less than chicks without this condition (P = 0.03). Although the interaction was not significant (P = 0.09), this effect was remarkably greater in Hatchery chicks (131 g) than in Patio chicks (28 g). Beak and Red hock score showed no clear effects on growth.
SYS and Flock effects. There were no effects of SYS or Flock on cumulative mortality at day 42. The mean Pasgar©score was lower in Patio than in Hatchery chicks (9.25 ± 0.06 v. 9.63 ± 0.04; P < 0.01). There were no SYS × Flock interactions observed for incidences of any of the Pasgar©score-criteria, except for Red hock score (P < 0.01). Incidence of Red hocks was higher in Patio than in Hatchery chicks, and this effect was more pronounced in flock A than in flock B. In chicks from both flocks, the highest incidence was found for Navel condition (31.13%), and was higher in Patio than in Hatchery chicks (36.84% v. 26.44%; P = 0.04). Incidences of Large yolk sacs and Low alertness were higher in flock B than in flock A (P < 0.01 for both).
At days 0, 7, 21 and 42 bird weights were, respectively, 2.9, 28.3, 68 and 86 g higher in Patio than in Hatchery chicks (P < 0.01 at all ages). In addition, at days 0, 7, 21 and 42 weights were, respectively, 8.4, 21.0, 78 and 159 g higher in flock B than in flock A chicks (P < 0.01 at all ages). Successive inclusion of days 0, 7 and 21 weights as a covariate in the model, showed that growth up to day 42 was affected by SYS, but not by Flock.
Q2 chicks
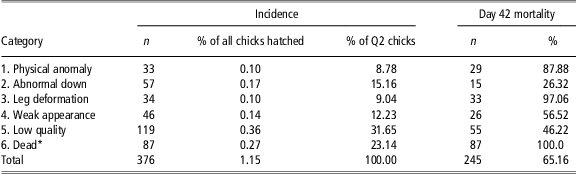
Quality × performance. Of all 32 789 chicks hatched, a total of 376 chicks (1.15%) were classified as Q2 chicks (Table 2). Incidences of each of the six categories of Q2 chicks are summarized in Table 5. Of all Q2 chicks, 123 (32.71%) died at day 0, including 36 culled chicks. At day 7, a total of 235 chicks had died (62.50%) and between days 7 and 42, another 10 chicks died, resulting in a total cumulative mortality of 65.16%. Mortality from day 0 to day 42 was high in all categories (Table 5), with a large range from 26.32% in the chicks with Abnormal down to 97.06% in the chicks with Leg deformities.
Incidence of 376 second grade (Q2) chicks per Q2 category (1 to 6) and day 42 mortality of these chicks, obtained from a breeder flock aged 35 weeks and a flock aged 53 weeks, hatched in Hatchery or in Patio conditions

*Chicks in category 6 were dead before they were examined.
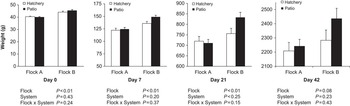
BWs of Q2 chicks at days 0, 7, 21 and 42 are shown in Figure 2. Mean weight of all Q2 chicks alive at day 42 was 2270 g. The relation between Q2-category and post-hatch growth could not be established because the number of chicks alive in most categories was low after day 7.
Least squares means (and s.e.) of body weights of second grade (Q2) chicks obtained from a breeder flock aged 35 weeks (A) and a breeder flock aged 53 weeks (B) at four chick ages: days 0, 7, 21 and 42.

SYS and Flock effects. Mortality at day 0 was higher in flock B than in flock A (40.15% v. 28.45%; P = 0.02). Mortality from day 0 to day 42 was not affected by SYS or Flock. The incidence of Q2 chicks was higher in Patio than in Hatchery chicks (1.33% v. 0.97%; P < 0.01). Overall, based on all chicks hatched, there were more chicks with Physical anomalies (0.14% v. 0.06%; P = 0.03), and more chicks of Low quality (0.50% v. 0.23%; P < 0.01) in Patio than in Hatchery. The incidence of Physical anomalies was higher in flock A than in flock B (0.14% v. 0.04%; P = 0.02), while the incidence of Dead before examination was higher in flock B than in flock A (0.38% v. 0.19%; P < 0.01). Incidences of the other categories of Q2 chicks were not affected by SYS or Flock.
SYS did not significantly affect weights of Q2 chicks at any of the ages tested. Q2 chicks of flock B were heavier than chicks of flock A at 0, 7 and 21 days of age (P < 0.01). At day 42, the effect of Flock was not significant anymore (P = 0.08).
Discussion
Q1 chicks
Quality × performance. Overall, there were no correlations between mean Pasgar©score and chick weight at any of the ages tested, irrespective of hatching system or flock. Present findings confirm the conclusions of Willemsen et al. (Reference Willemsen, Everaert, Witters, De Smit, Debonne, Verschuere, Garain, Berckmans, Decuypere and Bruggeman2008) using the Tona-score, that the correlation between qualitative chick scores and post-hatch performance is not meaningful, unless a considerable percentage of second grade chicks is included. However, because second grade chicks are normally removed from the flock at the hatchery, it can be questioned whether chick quality indicators based on physical characteristics are useful as a predictor for post-hatch performance in hatchery practice.
The only Pasgar©score-criteria affecting weight of Q1 chicks after day 7 was Navel condition. Of the five criteria evaluated in the Pasgar©score, the incidence of suboptimal Navel condition was highest, in agreement with previous studies where qualitative chick scoring was used (Tona et al., Reference Tona, Onagbesan, De Ketelaere, Decuypere and Bruggeman2004 and Reference Tona, Onagbesan, De Ketelaere, Bruggeman and Decuypere2005; Willemsen et al., Reference Willemsen, Everaert, Witters, De Smit, Debonne, Verschuere, Garain, Berckmans, Decuypere and Bruggeman2008). Present findings of lower post-hatch growth in chicks with navel conditions at hatch correspond to results of Fasenko and O'Dea (Reference Fasenko and O'Dea2008), who found 97 and 108 g lower BWs at day 41 in chicks with Leaky navels or Button navels, respectively, compared to chicks lacking a navel score. It was hypothesized that depressed growth of chicks with navel conditions may be a result of subclinical yolk sac infections (Fasenko and O'Dea, Reference Fasenko and O'Dea2008). Furthermore, chicks with navel conditions at hatch were also shown to have reduced duodenal and ileal villi height in the early post-hatch period (Kwalilak et al., Reference Kwalilak, Ulmer Franco and Fasenko2010). In chicks with immediate access to feed and water after hatch, intestinal development was stimulated compared to chicks that were deprived for 48 h (Noy and Sklan, Reference Noy and Sklan1999). It can be speculated that the direct post-hatch feed and water access for Patio chicks may have partly overcome the negative effects of suboptimal navel quality on intestinal development and post-hatch growth, since the impact of navel conditions on day 42 weight presently found was more pronounced in Hatchery (131 g) than in Patio chicks (28 g).
SYS and Flock effects. Mean Pasgar©scores were not affected by breeder flock but were lower in Patio than in Hatchery chicks. Navel condition was clearly affected by hatching system, with about 10 percentage points higher incidences in Patio than in Hatchery chicks in both flocks. Suboptimal navel quality in newly hatched chicks was linked to very high (Decuypere and Bruggeman, Reference Decuypere and Bruggeman2007; Leksrisompong et al., Reference Leksrisompong, Romero-Sanchez, Plumstead, Brannan and Brake2007), as well as to very low temperatures (Wilson, Reference Wilson2004) in the hatching phase. Higher incidences of navel conditions in the Patio may be related to lower temperatures than optimum, considering the lower set point temperature in the Patio compared to the hatcher. Red hocks were observed more frequently in Patio than in Hatchery chicks, especially in flock A. Red hocks are assumed to result from prolonged pushing on the eggshell during pipping and hatching (Wilson, Reference Wilson2004), and were related to high temperatures in the last incubation phase (Decuypere and Bruggeman, Reference Decuypere and Bruggeman2007; Leksrisompong et al., Reference Leksrisompong, Romero-Sanchez, Plumstead, Brannan and Brake2007). However, the latter seems unlikely to be the reason for a high Red hock incidence in Patio. Alternatively, low temperature in the final days of incubation (35°C) can lengthen the hatching process compared to a higher temperature (38°C) (Szdzuy et al., Reference Szdzuy, Fong and Mortola2008). Thus, it can be speculated that a lower temperature in Patio prolonged the duration of pushing with the hocks on the eggshell during hatching, leading to higher incidences of red hocks.
Although average Pasgar©scores were similar, post-hatch growth was higher in chicks from flock B than from the younger flock A, which seems to correspond to previous findings on breeder age (Ulmer-Franco et al., Reference Ulmer-Franco, Fasenko and O'Dea Christopher2010). In addition, despite a lower mean Pasgar©score, which was mainly explained by higher incidences of Navel conditions and Red hocks, weights were higher in Patio chicks from both flocks at all ages tested. Chicks that hatched in the hatchery were deprived from feed and water until placement in the Patio house at day 0, while the chicks that hatched in Patio had immediate access to feed and water. Present results confirm the negative effects of delayed access to feed and water on post-hatch growth in broilers (Gonzales et al., Reference Gonzales, Kondo, Saldanha, Loddy, Careghi and Decuypere2003; Careghi et al., Reference Careghi, Tona, Onagbesan, Buyse, Decuypere and Bruggeman2005).
Similar to the Tona-score (Tona et al., Reference Tona, Bamelis, De Ketelaere, Bruggeman, Moraes, Buyse, Onagbesan and Decuypere2003), the Pasgar©score is based on physical quality criteria which are used in hatchery practice to evaluate and optimize incubation conditions (Boerjan, Reference Boerjan2002). Present data seem to confirm that different hatching conditions affect these physical criteria, but it is not clear in what way. This should be kept in mind when this type of criteria is used to evaluate incubation conditions.
Q2 chicks
Quality × performance. The mean incidence of 1.15% of second grade chicks presently found agrees with own observations on 20 hatches of two broiler breeds in a commercial hatchery in the Netherlands (a total of 539 493 chicks hatched), where a large variation of second grade chicks (0.25% to 2.22%) was found with a mean of 1.06%. The evaluation of second grade chicks in the present study therefore seems to correspond with the procedure applied in hatchery practice. Mortality in Q2 chicks showed similar patterns in both hatching systems and both flocks. Of all Q2 chicks, 34.84% was still alive at day 42, meaning that at day 42, 0.40% of the total flock (1.15% × 34.84%) consisted of Q2 chicks, which on average weighed 258 g less than Q1 chicks on day 42. This means that the impact of Q2 chicks on flock level, expressed in underperformance compared to Q1 chicks, was about 33.8 kg (0.40% × 32 789 chicks × 258 g) of live weight, or 0.04% of the total live weight of the flock. Thus, the impact of keeping second grade chicks in the flock on post-hatch growth on flock level can be considered negligible, in both flocks and hatching systems. This may be a concern when using the Patio system, where the removal of second grade chicks as a standard management practice is omitted, so all chicks that hatch remain in the flock (van de Ven et al., Reference van de Ven, van Wagenberg, Groot Koerkamp, Kemp and van den Brand2009). There may, however, be other reasons for culling second grade chicks, such as risk for infections and negative impacts on animal welfare, feed conversion ratio and flock uniformity. Moreover, leaving second grade chicks in the flock affects the percentage of mortality on farm. Based on present results, total mortality after day 0 increased by 0.75% on flock level (1.15% second grade chicks × 65.16% total mortality), compared with the practice where second grade chicks are removed right after hatch, before placement in the broiler house. Increased mortality on farm is intolerable with respect to ethical aspects but also in view of the current European Union directive, which dictates that mortality in broiler farms should be below 1% + 0.06% multiplied by the slaughter age in days (European Union, 2007).
SYS and Flock effects. The percentage of second grade chicks did not differ between the two flocks of different age, corresponding to findings of Ulmer-Franco et al. (Reference Ulmer-Franco, Fasenko and O'Dea Christopher2010). In chicks from both flocks, there was a higher incidence of second grade chicks in the Patio than in the Hatchery, which was mainly explained by a higher incidence of chicks with a Physical anomaly and chicks of Low quality in the Patio. Physical anomalies observed in the current study included chicks with four legs, a crossed beak or lacking one or two eyes. These anomalies originate from an early stage in embryonic development (Romanoff, Reference Romanoff1960; Wilson, Reference Wilson2004), and are thus unlikely to result from different conditions during the last 3 days of incubation.
A higher incidence of Low quality in Patio chicks may be related to different climate conditions during hatching. In a previous study where climate conditions in Patio were compared to the same type of hatcher with the identical set points as used in the present experiment, temperature at egg level in Patio was almost 3°C lower and relative humidity was about 21% lower (van de Ven et al., Reference van de Ven, van Wagenberg, Debonne, Decuypere, Kemp and van den Brand2011). However, signs typical of low temperature in this incubation phase, such as higher incidence of unhealed navels (Wilson, Reference Wilson2004), and of low humidity, such as closed eyes or down stuck to the eyes (Wilson, Reference Wilson2004), were not observed more frequently in Low quality chicks in Patio than in the Hatchery. The reasons for the higher incidence of Low quality chicks in Patio remains unclear.
In conclusion, a qualitative score of first grade chicks or the incidence and background of second grade chicks may be used to evaluate conditions during incubation or hatchery management procedures, but neither of the two methods predicted the overall post-hatch performance of broiler chicks, irrespective of breeder flock or hatching system.
The high (early) mortality in second grade chicks indicates that the common practice of culling of these chicks at the hatchery is justified. Although the impact of leaving second grade chicks in the flock is negligible in terms of growth, it is necessary to apply the practice of culling second grade chicks also in the Patio system for ethical reasons, and in view of European welfare legislation.
Acknowledgements
We thank the European Union and the Dutch Ministry of Agriculture, Nature and Food Quality for partially funding the project. The technical assistance of John Kayers, Louis Lemmens, and other members of the personnel of broederij Van Hulst (Belgabroed NV) is very much appreciated. Freek Leijten (Vencomatic BV) is acknowledged for critical reading of the manuscript.