Nomenclature
-
 ${A_0}$
-
area of the orifice
-
${A_1}$
-
area of the 1–1 section
-
${A_a}$
-
gas compression area
-
${A_c}$
-
area of the jet at the vena contracta
-
${C_c}$
-
contraction coefficient
-
${C_d}$
-
discharge coefficient
-
${C_T}$
-
vertical damping deformation coefficient
-
${C_v}$
-
velocity coefficient
-
${C_x}$
-
LES model dependent constant
-
${d_0}$
-
orifice diameter
-
${d_c}$
-
oil compression diameter
-
$f\left( {{z_2}} \right)$
-
tire vertical static force
-
$F$
-
total force in the shock strut
-
${F_a}$
-
air spring stiffness force
-
${F_C}$
-
magnitude of Coulomb friction
-
${F_f}$
-
friction force
-
${F_h}$
-
hydraulic force
-
${F_{{\rm{max}}}}$
-
max total force in the shock strut
-
${F_{nf}}$
-
journal friction force
-
${F_S}$
-
magnitude of static friction
-
${F_{sf}}$
-
seal friction force
-
${F_V}$
-
vertical ground force acting on the tire
-
$g$
-
gravitational constant
-
$G_{ij}^d$
-
gradient velocity tensor
-
${l_0}$
-
orifice length
-
${m_1}$
-
sprung mass
-
${m_2}$
-
unsprung mass
-
$OL$
-
max overloading of the sprung mass
-
${P_0}$
-
initial gas pressure
-
${P_1}$
-
pressure at the 1–1 section
-
${P_{atm}}$
-
atmospheric pressure
-
${P_b}$
-
backpressure
-
${P_c}$
-
pressure at the c–c section
-
$Q$
-
flow rate through the orifice
-
${\rm{sgn}}$
-
signum function
-
$S$
-
shock absorber stroke
-
${\bar S_{ij}}$
-
rate-of-strain tensor
-
${S_{{\rm{max}}}}$
-
maximum shock absorber stroke
-
$v$
-
relative velocity
-
${v_0}$
-
tolerance velocity
-
${v_1}$
-
mean velocity of the fluid at the 1–1 section
-
${v_c}$
-
mean velocity of the fluid at the c–c section
-
${v_s}$
-
Stribeck velocity
-
${V_0}$
-
initial gas volume
-
${z_1}$
-
vertical displacement of the sprung mass
-
${Z_1}$
-
height of the 1–1 section
-
${z_2}$
-
vertical displacement of the unsprung mass
-
${Z_2}$
-
height of the c–c section
-
$\gamma $
-
gas polytropic exponent
-
${\nu _t}$
-
turbulent eddy viscosity
-
$\xi $
-
resistance coefficient
-
$\Delta P$
-
pressure difference
-
${\rm{\Delta }}x$
-
lattice spacing
-
${\eta _s}$
-
shock absorber energy absorption efficiency
-
${\mu _{sf}}$
-
seal friction coefficient
-
${\mu _w}$
-
ground friction coefficient
-
$\rho $
-
density of the oil
-
$\bar \varpi $
-
LES model operator


1.0 Introduction
The landing gear is an inevitable system for the aircraft. It absorbs the energy of the landing impact and carries the aircraft weight at all ground operations, including take-off, taxiing, and towing [Reference Krüger, Besselink, Cowling, Doan, Kortüm and Krabacher1]. The two-degree-freedom model was introduced to analyse landing gear dynamic responses during aircraft landing in 1953 [Reference Milwitzky and Cook2] and is still used recently in landing gear buffer analysis [Reference Sartor, Worden, Schmidt and Bond3, Reference Jo, Jang, Hwang and Choi4]. The damping orifice is the key part of the landing gear shock absorber for dissipating the landing impact energy. The max force in the landing gear strut during landing process results from the hydraulic force induced by the damping orifice, which directly causes the max overloading of the aircraft. Since the hydraulic force is related to the landing response, the design of the damping orifice parameters is workable for good landing performance.
The research methodology of studying the characteristics of the orifice can be typically classified into three categories, namely, the engineering estimation method [Reference Gao5], the experimental and empirical method [Reference Essien, Archibong-Eso and Lao6, Reference Jamei, Ahmadianfar, Chu and Yaseen7], and the computational fluid dynamics (CFD) simulation method [Reference Jiang, Liu and Lyu8, Reference Ding, Wei, Nie and Li9]. The engineering estimation method sets the discharge coefficient of the orifice to be a constant number, which needs the experiment data to validate. The experimental method is accurate to measure the discharge coefficient for a specific orifice structure, such as sharp-edged orifice [Reference Essien, Archibong-Eso and Lao6, Reference Tharakan and Rafeeque10], taper inlet orifice [Reference Yu, Fu, Zhang and Zhou11, Reference Yu, Zhu, Suo and Zheng12], and round inlet orifice [Reference Payri, Bermúdez, Payri and Salvador13]. But the experimental result is only effective for the orifice with the specific type and parameter. As the development of CFD, it is feasible to obtain the discharge coefficient of the orifice by simulation. The Navier-Stokes solvers using the Reynolds Averaged Navier-Stokes (RANS) turbulence models are able to solve complex engineering problems [Reference Ling and Templeton14]. However, the numerical stability of these mesh-based solutions is limited by the mesh quality which requires large time cost to modify and verify.
The LBM, a particle-based solution, presents an alternative and promising numerical scheme for simulating fluid flows [Reference Chen and Doolen15]. The scheme is particularly effective in fluid flow applications involving complex boundaries [Reference Thibault, Holman, Garcia and Trapani16, Reference Zhang, Kim and Dinoy17] and interfacial dynamics [Reference Xu, Zhao, An and Shi18, Reference Wang, Shu and Yang19]. Theoretical analysis of the high Reynolds number separation flow inside the damping orifices to calculate the hydraulic force is basically impossible. The advantages of LBM in calculating complex flows [Reference Holman, Brionnaud, Modena and Sánchez20, Reference Lin, Xia and Hu21] make it a potentially viable CFD solution. The response surface method (RSM) is a collection of statistical and mathematical techniques [Reference Myers, Montgomery and Anderson-Cook22], which can reduce the time and computational expense for analysis and design. This method is applied in some complex engineering applications, such as aircraft [Reference Yang, Xing, Zhang, Yang and Sun23] and lunar lander [Reference Wang, Nie, Chen and Lee24, Reference Ding, Wu, Wang and Ding25] design. The parametric analysis and optimisation design of the damping orifice need many times calculation of the hydraulic force using the LBM which will take a lot of time. To obtain an advisable layout of the orifice quickly, it is necessary to use the LBM coupled with the RSM to research the parameters of the damping orifice.
The content of this work is organized as follows. First, Subsection 2.1 introduces the basic feature of the damping orifice. The results of a computation example using the LBM are compared with the published experimental data. And the analysis of the damping orifice of landing gear is carried out in Subsection 2.3. Then, Section 3 establishes the numerical model of the landing gear and validates the model by the landing gear drop test. Moreover, Section 4 uses the response surface method to implement the response surface functions construction, sensitivity analysis, and optimisation design based on the numerical model coupled with the LBM. Finally, Section 5 summarises the main conclusions of this work.
2.0 Orifice characteristic analysis
2.1 Basic feature of damping orifice
The oleo-pneumatic landing gear uses the small oil damping orifice to dissipate the aircraft landing impact energy. The oil flow shrinks when it passes through the small hole from a bigger cross-section and forms a vena contracta behind the small hole, as shown in Fig. 1. Bernoulli’s equation is applied to 1–1 section and c–c section:
 \begin{align}{\frac{{{P_1}}}{{\rho g}} + \frac{{v_1^2}}{{2g}} + {Z_1} = \frac{{{P_c}}}{{\rho g}} + \left( {1 + \xi } \right)\frac{{v_c^2}}{{2g}} + {Z_c}\;}\end{align}
where
 ${P_1}$
and
 ${P_c}$
are the pressure at the 1–1 section and c–c section,
 $g$
indicates the gravitational constant,
 ${v_1}$
and
 ${v_2}$
are the mean velocity of the fluid at the 1–1 section and c–c section,
 ${Z_1}$
and
 ${Z_2}$
are the height of the 1–1 section and c–c section,
 $\xi $
is the resistance coefficient,
 $\rho $
is the density of the oil.
Schematic diagram of orifice flow.

Consider the flow occurs on a horizontal surface, so the gravitational effect can be ignored. Moreover, the area of the jet at the vena contracta usually is much smaller than the area of the incoming flow section, the mean velocity of the fluid in the 1–1 section
 ${v_1}$
is much smaller than the mean velocity of the fluid in the c–c section
 ${v_c}$
. Therefore, the mean velocity of the fluid in the c–c section is presented by the equation
 \begin{align}{{v_c} = \frac{1}{{\sqrt {1 + \xi } }}\sqrt {\frac{{2\left( {{P_1} - {P_c}} \right)}}{\rho }} = {C_v}\sqrt {\frac{{2\Delta P}}{\rho }} \;}\end{align}
where
 ${C_v}$
is the velocity coefficient,
 $\Delta P$
is the pressure difference.
The contraction coefficient
 ${C_c}$
is defined as
 ${C_c} = {A_c}/{A_0}$
, where
 ${A_c}$
is the area of the jet at the vena contracta,
 ${A_0}$
is the area of the orifice. The flow rate through the orifice can be expressed as
 \begin{align}{Q = {V_c}{A_c} = {C_c}{C_v}{A_0}\sqrt {\frac{{2{\rm{\Delta }}P}}{\rho }} = {C_d}{A_0}\sqrt {\frac{{2{\rm{\Delta }}P}}{\rho }} \;}\end{align}
where
 ${C_d}$
is the discharge coefficient. The hydraulic force can be calculated through the pressure difference and the compression area, which can be expressed as
 \begin{align}{{F_h} = \Delta P{A_1} = \frac{{\rho {A_1}{Q^2}}}{{2{C_d}^2{A_0}^2}}}\end{align}
where
 ${F_h}$
is the hydraulic force,
 ${A_1}$
is the area of the 1–1 section which is the oil compression area. The flow rate
 $Q$
is the product of the stroke velocity and the area of the 1–1 section. All the values of the parameters in Equation (4) are determined in a specific landing gear structure and landing condition, except for the discharge coefficient. The discharge coefficient is related to the orifice structure, flow rate, pressure difference, and fluid property, which cannot be obtained by theoretical calculations. The recommended discharge coefficient value for sharp-edged orifice is 0.7–1.0 in the engineering estimation method. The CFD methods can be used to calculate the discharge coefficient according to the given orifice structure.
2.2 A computation example: sharp-edged orifice
In this subsection, the flow characteristics of sharp-edged orifice are simulated using the LBM. The comparison of the simulation results with the published results is conducted to verify the applicability of the LBM in calculating the flow characteristics of orifices. The simulation condition is set according to the Ref. [Reference Tharakan and Rafeeque10]. A three-dimensional model of the sharp-edged orifice is established and calculated using OpenLB package, which is a C++ library providing a flexible framework for lattice Boltzmann simulations [Reference Krause, Kummerländer, Avis, Kusumaatmaja, Dapelo, Klemens, Gaedtke, Hafen, Mink, Trunk, Marquardt, Maier, Haussmann and Simonis26]. The schematic of cross-section of the sharp-edged orifice is shown in Fig. 2. The details of the orifices used for the simulation are given in Table 1.
The collision operator is based on the multiple-relaxation-time [Reference D’Humières27] scheme. The finite difference velocity gradients boundary method [Reference McCracken and Abraham28] is selected in this simulation. The boundary conditions imposed on calculation domain of the damping orifice in the numerical simulation are listed in Table 2, and the detailed position of each boundary is shown in Fig. 3. To simulate this case, a single-phase internal flow set up with the isothermal model is selected. The default setup of material parameters of the water is adopted.
Details of orifices

Simulation boundary conditions setting

Schematic of sharp-edged orifice.

Lattice structure with different lattice resolution.

Grid independence check information

The lattice size in the fluid domain is organised into three levels, the lattice size around the orifices set to be the minimum value of the three levels. The grid independence is checked using four different lattice sizes under orifice 3 with a pressure drop of 1.0MPa, as summarised in Table 3. The fine lattice level is selected for the simulation and the lattice setup in symmetrical profile view is shown in Fig. 3.
The turbulence model implemented in LBM is based on Large Eddy simulation (LES), which is less computationally expensive to implement in the LBM framework than in the Navier-Stokes solvers. The LES introduces a turbulent eddy viscosity
 ${\nu _t}\;$
to model the turbulence [Reference Weickert, Teike, Schmidt and Sommerfeld29], which is defined as:
 \begin{align}{{\nu _t} = C_x^2\Delta {x^2}\bar \varpi \;}\end{align}
where
 ${C_x}$
is the LES model dependent constant,
 ${\rm{\Delta }}x$
denotes the lattice spacing, and
 $\bar \varpi $
is the LES model operator. Three turbulence models are selected for simulation in LBM, namely, Smagorinsky model [Reference Smagorinsky30], dynamic Smagorinsky model [Reference Germano, Piomelli, Moin and Cabot31], and wall-adapting local eddy-viscosity (WALE) model [Reference Ducros, Nicoud and Poinsot32]. The model operator for Smagorinsky model is given by:
 \begin{align}\bar \varpi & = \sqrt {2{{\bar S}_{ij}}{{\bar S}_{ij}}} \nonumber\\[5pt]
{{\bar S}_{ij}} & = \frac{1}{2}\left( {\frac{{\partial {{\bar u}_i}}}{{\partial {x_j}}} + \frac{{\partial {{\bar u}_j}}}{{\partial {x_i}}}} \right)\end{align}
where
 ${\bar S_{ij}}$
is the rate-of-strain tensor for the resolved scale. In the dynamic Smagorinsky model, the LES constant varies in space as well as time. The WALE model is based on the square of the gradient velocity tensor
 $G_{ij}^d$
, which is defined as follow:
 \begin{align}\bar \varpi & = \frac{{{{\left( {G_{ij}^dG_{ij}^d} \right)}^{3/2}}}}{{{{\left( {{{\bar S}_{ij}}{{\bar S}_{ij}}} \right)}^{5/2}} + {{\left( {G_{ij}^dG_{ij}^d} \right)}^{5/4}}}}\nonumber\\[5pt]
G_{ij}^d & = \frac{1}{2}\left( {\bar g_{ij}^2 + \bar g_{ji}^2} \right) - \frac{1}{3}{\delta _{ij}}\bar g_{kk}^2,{{\bar g}_{ij}} = \frac{{\partial {{\bar u}_i}}}{{\partial {x_j}}}\end{align}
The LES constants are set to be 0.325, 0.12 and 0.12 for WALE model, Smagorinsky model, and initial value of the dynamic Smagorinsky model, respectively. In order to compare the ability of mesh-based solvers and LBM to handle such flow problems, a numerical simulation is conducted in software Fluent using shear-stress transport (SST) k-
 ${\rm{\omega }}$
turbulence model [Reference Menter33] in the framework of RANS method. The mesh scheme approximately with around 87,000 cells is used after mesh independence check. The boundary conditions setting is the same as set in LBM and other setups in Fluent follow the Ref. [Reference Jiang, Liu and Lyu8]. The experimental data published in the Ref. [Reference Tharakan and Rafeeque10] are utilised to compare with the simulation results at different specific orifices. The mean velocity variations at the exit of the orifice with the square root of the pressure drop (
 ${\rm{\Delta }}{{\rm{P}}^{0.5}}$
) obtained from four kinds of simulation for orifice 1 are shown in Fig. 4.
Comparison of simulated and experimental results (a) variation of velocity with
 ${\rm{\Delta }}{P^{0.5}}$
(b) discrepancy.

As shown in Fig. 4(a), the results of all four simulation models show that the mean velocity increases linearly with the square root of the pressure drop, in line with the trend of the experimental results. The results of all four simulation models differed very little from the experimental results. The difference between several results is larger at low pressure drop, which can be seen in Fig. 4(b). A comparison of the absolute values of the relative errors with experimental results is presented in Fig. 4(b). The errors in the results of several simulations are within acceptable limits, with a maximum error of 9.16%. The LBM with WALE model has the lowest maximum error value of 7.03%.
The full comparison shows that both LBM and traditional CFD can simulate the small-hole contraction problem very well. In LBM simulation, the WALE turbulence model can better simulate the flow characteristics at different flow rates. The calculation time for ten data points using LBM with WALE model and traditional CFD method is 25 and 34 min respectively with the same computational power. Further, no need for mesh generation in the LBM is time-saving for the simulation implementation. All the orifices listed in Table 1 are simulated using LBM with WALE turbulence model. The mean velocity variations with
 ${\rm{\Delta }}{{\rm{P}}^{0.5}}$
for two orifice diameters are shown in Fig. 5.
Figure 5 shows that the simulated results using the LBM have good agreement with the experimental results under all six orifice conditions. The maximum relative error is 7.07% at orifice 3 with 0.2MPa pressure drop condition, which is deemed to be acceptable for engineering applications. Therefore, the LBM with WALE turbulence model can well simulate the flow characteristics of the sharp-edged orifice.
2.3 Damping orifice analysis
In this subsection, the flow characteristics of the sharp-edged damping orifice of landing gear are simulated using LBM to obtain the hydraulic force for calculating the aircraft landing response in landing process. The inlet boundary condition is changed to the mass flow inlet, with the value calculated by stroke velocity and oil compression area. The simulation setup is the same as mentioned in Subsection 2.2. The minimum lattice size around the orifice is set to be 0.18mm. The details of the damping orifice are listed in Table 4. The density and kinematic viscosity of the oil are 837
 ${\rm{kg}}/{{\rm{m}}^3}$
and 13.85
 ${{\rm{m}}^2}/{\rm{s}}$
at the temperature of 40, respectively.
Details of damping orifice

Variation of velocity with
 ${\rm{\Delta }}{P^{0.5}}$
(a) d = 0.6mm (b) d = 1.4mm.

The comparison of the hydraulic force results calculated by the LBM and the engineering estimation method is presented in Fig. 6. The two results generally have a good agreement, except for the different offset direction between the low stroke velocity and the high stroke velocity. This means that the calculation result of
 ${C_d}$
using the LBM is lower than 0.8 at the low stroke velocity and higher than 0.8 at the high stroke velocity. Although the discrepancies at the low stroke velocity are considerably high, namely, the max value is −83.38% at 0.02m/s stroke velocity, the low value of the hydraulic force at the low stroke velocity causes a little effect on the landing responses. This deviation in the engineering estimation method still affects the prediction accuracy of the aircraft landing responses.
Hydraulic force results comparison.

The influence of the parameters of the orifice on the hydraulic force is analysed. The hydraulic forces of the orifice with different values of the orifice diameter, the orifice length, and the oil compression diameter, are calculated using the LBM, which is shown in Fig. 7. Figure 7(a) shows the influence of the orifice diameter on the hydraulic. It can be seen that the 0.2mm offset of the orifice diameter will bring about a variation of 0.89kN in the hydraulic force and the hydraulic force decreases with the increment of the orifice diameter. As shown in Fig. 7(b), the change of the orifice length from 3mm to 7mm leads to a small variety in the hydraulic force. But the variation trend is nonlinear with the increment of the orifice length in a limited interval. Figure 7(c) denotes that the hydraulic force decreases with the decrement of the oil compression diameter.
Variation of the hydraulic force versus stroke velocity with different parameters (a) oil compression diameter (b) orifice length (c) orifice diameter.

3.0 Landing gear modelling and validating
3.1 Landing gear dynamics model
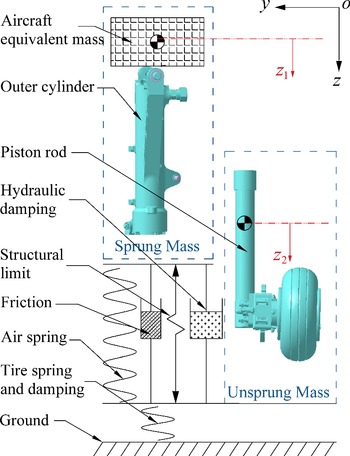
The dynamics landing gear model is necessary for predicting aircraft landing responses. A oleo-pneumatic main landing gear is selected as the research object, and a two-degrees-of-freedom spring damping model [Reference Milwitzky and Cook2] is established, as shown in Fig. 8. The sprung mass includes the fuselage and the structure above the outer cylinder of the landing gear, and the unsprung mass consists of the other structure of the landing gear below the shock absorber piston rod. The oleo-pneumatic shock absorber consists of upper and lower chambers separated by orifices and the metering pin. The upper part of the upper chamber is filled with pressurised nitrogen to provide the air spring, and the other spaces of the two chambers are filled with oil to provide the damping.
Schematic of the landing gear with two degrees of freedom.

According to the mathematical model shown in Fig. 8, the dynamic equilibrium governing equations of motion for the main landing gear is written as
 \begin{align}\left\{\begin{array}{l} {{m_1}{{\ddot z}_1} = {m_1}g - {F_a} - {F_h} - {F_f}}\\[4pt]
{{m_2}{{\ddot z}_2} = - {F_V} + {m_2}g + {F_a} + {F_h} + {F_f}} \end{array}\right.\end{align}
where
 ${m_1}$
and
 ${m_2}$
indicate the sprung mass and the unsprung mass,
 ${z_1}$
and
 ${z_2}$
denote the vertical displacement of the sprung mass and unsprung mass,
 ${F_a}$
,
 ${F_h}$
, and
 ${F_f}$
represent the air spring stiffness force, oil damping force, and friction force in the absorber strut, respectively.
 ${F_V}$
is the vertical ground force acting on the tire.
The air spring stiffness force is related to initial gas volume and pressure closely, the equation can be expressed as
 \begin{align}{{F_a} = {A_a}\left[ {{P_0}{{\left( {\frac{{{V_0}}}{{{V_0} - {A_a}S{\rm{\;}}}}} \right)}^\gamma } - {P_{atm}}} \right]\;}\end{align}
where
 ${A_a}$
is the gas compression area,
 ${P_0}$
is the initial gas pressure,
 ${V_0}$
is the initial gas volume,
 $S$
is the shock absorber stroke,
 $\gamma $
is the gas polytropic exponent, and
 ${P_{atm}}$
is the atmospheric pressure. The calculation of the oil damping force is stated in Equation (4).
The friction forces in the strut contain the journal friction force and seal friction force. The journal friction force is induced by the normal force acting on the bearing area. The seal friction force results from the friction of internal seals in the shock absorber depends on the internal gas pressure. The friction forces in the shock strut are described by equation
 \begin{align}{{F_f} = {F_{nf}} + {F_{sf}}\;}\end{align}
where
 ${F_{nf}}$
is the journal friction force, and
 ${F_{sf}}$
is the seal friction force. The seal friction force depends on the internal gas pressure [Reference Khapane34], is expressed as
 \begin{align}{{F_{sf}} = - {\mu _{sf}}{F_a}{\mathop{\rm sgn}} (\dot s)\;}\end{align}
where
 ${\mu _{sf}}$
is the seal friction coefficient, and
 ${\rm{sgn}}$
is the signum function.
The journal friction force is the product of the friction coefficient and the normal force. The model with the Stribeck effect reveals that the friction force decreases continuously with the increase of relative velocity from zero velocity [Reference Marques, Flores, Claro and Lankarani35]. To eliminate the numerical issues at zero velocity, a finite slope model is established to replace the discontinuity at zero velocity, as shown in Fig. 9. The model utilised in this work can be expressed by the following equations
 \begin{align}{F_{nf}} = \left\{\begin{array}{c@{\quad}c} {{F_S}\left| {\frac{v}{{{v_0}}}} \right|sgn\left( v \right)\;\;\;\;\;\;\;\;\;\;\;\;\;\;\;\;\;\;\;\;\;\;\;\;\;\;\;\;\;\;\;\;\;\;\;\;\;\;\;\;\;if\;\;\left| v \right| \lt {v_0}}\\[7pt]
{\left( {{F_C} + \left( {{F_S} - {F_C}} \right){e^{ - \frac{{\left| v \right| - {v_0}}}{{{v_s}}}\delta }}} \right){\mathop{\rm sgn}} (v)\;\;\;\;\;if\;\;\left| v \right| \ge {v_0}} \end{array}\right.\end{align}
where
 ${F_S}$
and
 ${F_C}$
represent the magnitude of static friction and Coulomb friction, respectively.
 $v$
is the relative velocity,
 ${v_s}$
is the Stribeck velocity,
 ${v_0}$
is the tolerance velocity,
 $\delta $
is an exponent which depends on the geometry of the contacting surfaces, often considered to be equal to 2.
Representation of Stribeck curves.

The vertical ground force results from the compression of the tire after touching the ground. A semi-empirical computational model [Reference Wen, Zhi, Qidan and Shiyue36] can be described by the equation
 \begin{align}F_V = (1 + C_T Z^{\cdot}_2)f(Z_2) \end{align}
where
 ${C_T}$
is the tire vertical damping deformation coefficient,
 $f\left( {{z_2}} \right)$
is the tire vertical static force corresponding to the tire compression amount obtained from the static compression test.
The longitudinal ground force is the friction load caused by the relative rotation of the tire and the ground. Its magnitude is related to the vertical ground force and the ground friction coefficient, which are given by
 \begin{align}{{F_D} = {\mu _w}{F_V}\;}\end{align}
where
 ${\mu _w}$
is the ground friction coefficient with typical values ranging from 0.4 to 0.9, which depends on tire angular velocity, tire-ground contact pressure, and runway condition.
3.2 Drop test and model validation
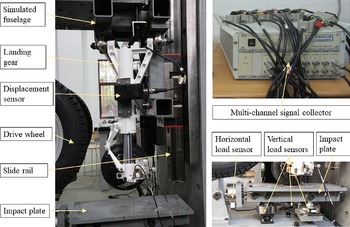
The accuracy of the numerical model of the landing gear for predicting the dynamics landing responses is validated by the drop test in this subsection. A single landing gear drop test system is conducted as shown in Fig. 10. The test system consists of the fixed platform, sliding rail, simulated fuselage, drive wheel, impact plate, displacement sensors, load sensors, and data signal collector. The fuselage and the stall points of the landing gear are simulated by the truss structure which can glide on the vertical slide rail. The descending velocity of the aircraft landing is imitated by the fixed height free fall. A suitable rough plate is installed on the impact plate to simulate the dry runway.
Drop test system of the single landing gear.

The various response data are collected in the buffering process, including the displacement of the sprung mass and the unsprung mass, sprung mass acceleration, ground vertical force and longitudinal force, and shock absorber stroke. The stroke is measured by a displacement sensor mounted on the landing gear. The longitudinal force load sensor is mounted horizontally ahead of the impact plate. The vertical ground force is measured by the load sensors installed vertically at the bottom of the impact plate. The two ends of the all vertical load sensors are connected by a revolute pair to retain the unrestraint of the longitudinal degree of the impact plate. A multi-channel signal collector is used to acquire real-time test data of each dynamic response.
The landing condition properties are shown in Table 5. The calculation results of the numerical model are obtained using the same values of landing gear parameters as the drop test, and the parameter values used in this work are shown in Table 6.
Landing condition properties

Landing gear parameters definition and value

The LBM and the engineering estimation method are used to calculate the hydraulic force in the numerical model. The discharge coefficient is set to be 0.8 in the engineering estimation method. To verify the accuracy of the numerical model, the comparison of the landing responses obtained from the drop test with the results of numerical model calculated in MATLAB is shown in Table 7 and Fig. 11. Table 7 compares the landing gear dynamics response results of the two numerical method simulations and the drop test. The ground vertical force and shock absorber stroke are two crucial dynamic responses of landing gear in landing process [Reference Li, Jiang, Neild and Wang37]. Figure 11 is the corresponding curve of the two crucial responses, which can express the quantity and efficiency of the energy absorption.
Comparison of simulated and drop test results

The ground vertical force curve with shock absorber stroke.

According to the result in Table 7, it can be seen that the two hydraulic calculation methods results both have good agreement with the drop test results. The maximum discrepancy error is 3.98% in the ground longitudinal force of engineering estimation method result. As shown in Fig. 11, the two numerical simulation corresponding curves considerably have good consistency with the drop test corresponding curve. Besides, the LBM result is closer to the drop test result in some regions, which are labelled by oval circles in Fig. 11. The hydraulic force gained from the LBM is much higher at a low stroke velocity than the engineering estimation method, which causes the higher ground vertical force in regions 1 and 3. The higher hydraulic force of the engineering estimation method at high stroke velocity leads to the smaller compression stroke as shown in region 2, which brings about a smaller rebound stroke in region 4.
Judging from the comparison results, the engineering estimation method is accurate enough for the industrial application. However, the value of the suitable constant discharge coefficient for a specific landing gear needs the drop test to confirm, which will increase time and economic costs. Besides, the more accuracy of the numerical model will reduce the deviation in the landing gear design process, the LBM can be used to predict the hydraulic force of the shock absorber in landing process.
4.0 Parametric analysis and design
4.1 RS-model and analysis
In this subsection, the response surface method is employed in parallel with the LBM to predict the hydraulic force and the landing response. To acquire the design variables-aircraft landing responses relation for designing a good orifice configuration quickly, the response surface functions are constructed. The construction of the response surface function consists of three steps, including the design of experiment (DOE), response surface fitted, and the analysis of variance (ANOVA).
In this work, five design variables of the landing gear are selected in the design space
 $V$
shown in Table 8. The research parameters of the landing gear consist of the dimension parameters of the orifice and the properties of the gas chamber. The dimension parameters of the orifice include the diameter of the orifice, the length of the orifice, and the oil compression diameter. Consider the backpressure role on the discharge coefficient, the initial gas volume and gas pressure in the gas chamber of the landing gear are selected as the design variables. The numerical model results are fitted with a quadratic polynomial function using the step-wise regression method in this research [Reference Myers, Montgomery and Anderson-Cook22]. The second-order fitted model [Reference Vadde, Syrotiuk and Montgomery38] relating the response
 $y$
and the design variables
 ${x_i}$
is presented as:
 \begin{align}{y = {\beta _0} + \mathop \sum \limits_{i = 1}^5 {\beta _i}{x_i} + \mathop \sum \limits_{i = 1}^5 {\beta _{ii}}x_i^2 + \mathop \sum \limits_{i \lt j = 2}^5 \sum {\beta _{ij}}{x_i}{x_j} + \varepsilon }\end{align}
where denotes a random error spring from the inaccuracy of the model. To obtain a fewer number of sample points while retaining the accuracy of the RS-model, the DOE is constructed based on a three-level Box-Behnken design, which has 46 sample points. The variables and design levels are shown in Table 8. The shock absorber energy absorption efficiency, max overloading of sprung mass, and the shock absorber stroke are the crucial criteria in characterising the aircraft touchdown performance. The three landing responses are shown in Table 9.The shock absorber efficiency [Reference Han, Kang, Choi, Tak and Hwang39] is defined as
 \begin{align}{{\eta _s} = \frac{{\mathop \smallint \nolimits_0^{{s_{{\rm{max}}}}} Fds}}{{{S_{{\rm{max}}}}{F_{{\rm{max}}}}}}\;}\end{align}
where
 $F$
denotes the total force in the shock strut.
 ${S_{{\rm{max}}}}$
and
 ${F_{{\rm{max}}}}$
are the maximum shock absorber stroke and the max total force in the shock strut during landing process.
Design variables and design levels in DOE

The information of the three landing responses

To examine the accuracy of the fitted model, the four indexes are selected, including P-value, R 2, Adj R 2, and Adequate precision. The calculation methods of indexes are listed in Ref. [Reference Myers, Montgomery and Anderson-Cook22]. The accurate fitted model must satisfy the requirements regarding the four indexes, which are shown in Table 10. Moreover, the scatter points of the numerical model response values versus the predicted values should evenly distribute on both sides of the 45-degree diagonal.
The ANOVA results of RS model for the three responses

The ANOVA results acquired from the RS-model for the three landing responses are shown in Table 10. The table illustrates that all four indexes for checking the coincidence of the fitted model are meet the criteria. Furthermore, the scatter plots of the numerical model response values versus the predicted values are shown in Fig. 12. These figures demonstrate that the sample points are split evenly by the 45-degree diagonal.
As described in Ref. [Reference Myers, Montgomery and Anderson-Cook22], the response surface models for the three landing responses can be used to simulate the landing response in the design space
 $V$
. The three RS functions are listed in Table 11. All the functions have three order effects, including the first-order, the second-order, and the interaction effects.
RS functions for the three responses

The numerical model values versus the predicted values of the three responses (a) shock absorber efficiency (b) max overloading of the sprung mass (c) shock absorber stroke.

4.2 Sensitivity analysis
In this subsection, a global sensitivity analysis based on the Sobol’s method is executed to obtain the influence of the design variables on the three landing responses in the design space V. According to the theory of Sobol’s method [Reference Sobol40], the first-order indices represent the sensitivity of the single variable, and the total-effect indices denote all order sensitivity of a variable, including the interaction effects with other variables. The sensitivity analysis results of each design variable under the three RS functions are shown in Fig. 13. Figure 13 shows that the diameter of orifice and the oil compression diameter are the top two sensitive variables for the response
 ${\eta _s}$
and
 $OL$
. It also shows that the initial gas volume and pressure in the gas chamber are the most noticeable sensitive variables for the response
 $S$
. Moreover, all the first-order indices for the three responses take the main part of the corresponding total effect indices.
The sensitivity indices for the three landing responses (a) shock absorber efficiency (b) max overloading of the sprung mass (c) shock absorber stroke.

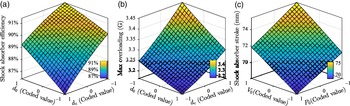
Figure 14 illustrates the effect of the top two noticeable variables on the three landing responses when the coded values of other variables are set to be zero. Figure 14(a) reveals that the shock absorber efficiency, with an interval of change from 86.40% to 91.44%, increases with the increment of the orifice diameter and the decrement of the oil compression diameter. In accordance with Equation (16), the higher max force in the shock strut leads to a lower shock absorber efficiency. Furthermore, the lower value of the orifice diameter and the higher value of the oil compression diameter contribute to the higher value of the max shock strut force, which will bring about the lower shock absorber efficiency.
The top two sensitive variables influence on the three landing responses (a) shock absorber efficiency (b) max overloading of the sprung mass (c) shock absorber stroke.

Figure 14(b) shows that the max overloading of the sprung mass increases as the oil compression diameter increases and the orifice diameter decreases, with a change interval of 3.16-3.45G. The max overloading is the ratio of the max shock strut force and the value of the sprung mass. The contributions of the orifice diameter and the oil compression diameter on the max shock strut force are reflected in Fig. 14(b).
Figure 14(c) denotes the effect of the top two noticeable parameters on shock absorber stroke, namely, the initial gas volume and pressure in the gas chamber of the landing gear. Since the functions of the air spring is to limit the compression of the stroke and provide energy to rebound the shock absorber, the high initial gas pressure increases the baseline of the resistance pressure and the low initial gas volume enlarges the increasing speed of the resistance pressure. The change of the shock absorber stroke in the design space is from 68.12 to 75.43mm.
4.3 Optimisation design
Optimisation in this work suggests a philosophical and tactical approach during the design process based on a mathematical representation of the problem (41). A multi-objective optimisation (MDO) is conducted to determine the appropriate value of the design variables of the orifice for a preferable aircraft touchdown performance in this subsection. The MDO is based on the RS functions obtained in Subsection 4.1, which are validated by the numerical model of the landing gear. Figure 15 shows the flowchart of the MDO process. According to the RS functions, the max overloading of the sprung mass and the shock absorber stroke are selected as the optimisation goals in the MDO.
Flowchart of the MDO process.

The Pareto front of two optimisation goals.

The elitist non-dominated sorting genetic algorithm version II (NSGA-II) is adopted for the optimisation [Reference Deb42]. The constraint boundary of design variables is defined in the design space
 $V$
as shown in Table 8. The mathematical model of the optimisation can be expressed as
 \begin{align} & {\min {\rm{\;\;}}OL,S}\nonumber\\[4pt]
& {s.t.\;\;\left[ {{d_0}{\rm{\;}},{\rm{\;}}{l_0}{\rm{\;}},{\rm{\;}}{d_c}{\rm{\;}},{\rm{\;}}{V_0}{\rm{\;}},{\rm{\;}}{P_0}} \right] \in V}\end{align}
After the optimisation, the Pareto front of the optimisation results fitted by the two optimisation goals is shown in Fig. 16. To keep the comparability of the optimisation results, the optimum values of the design parameters are selected from the Pareto front around the area where the shock absorber stroke equal to the value before the optimisation. The optimum coded values and actual values of the design variables of the orifice and the gas chamber are shown in Table 12. The orifice structure is modified based on the optimisation results and is used in calculating the hydraulic force with the LBM. The simulation results of the numerical model of the landing gear under the same landing condition are shown in Table 13.
The optimised values of the landing gear variables

Comparison of the optimisation results

Table 13 compares the landing response results before and after optimisation. It can be seen that the shock absorber stroke retains almost the same value as the original value after optimisation. Besides, the max overloading of sprung mass decreases by 5.44% as the shock absorber efficiency increases by 1.65%. The touchdown performance still gets some improvement after optimisation even the shock absorber efficiency is already at a high level in the original layout of the landing gear.
5.0 Conclusions
Based on the feature of the damping orifice, the lattice Boltzmann method is used to simulated the flow characteristic of the sharp-edged orifice. The simulation results of a computation example of the sharp-edged orifice are compared with the published experimental results. The sharp-edged damping orifice analysis is carried out with the hydraulic force calculated by the LBM. The simulations under different turbulence models show that LBM with WALE turbulence model has a higher feasibility for simulating damping orifice flow, with the lowest maximum relative error value of 7.07%. The analysis results of the damping orifice denote that the hydraulic force increases with the decrement of the orifice diameter and the increment of the oil compression diameter.
The numerical model of the landing gear for predicting the aircraft landing response is established. The drop test of single landing gear is carried out to validate the accuracy of the numerical model. The results show that the engineering estimation method and the LBM can both be used to calculate the hydraulic force of the landing gear. But the more accuracy of the LBM is preferable for the parametric analysis of the damping orifice in the design process.
The RS functions of the landing responses are constructed based on the numerical model of the landing gear for the parametric analysis on the damping orifice. The sensitivity analysis and the optimisation design are carried out based on the RS functions. The ANOVA results show that the RS functions simulated the landing response effectively and can be used to predict the landing response. The most noticeable variables for the three landing responses in the design space
 $V$
are the oil compression diameter, the oil compression diameter, and the initial gas volume respectively. The max overloading of the sprung mass decreases by 5.44% after the optimisation even the shock absorber efficiency is already at a high level in the original layout of the landing gear. The analysis and optimisation results show that the LBM coupled with RSM is a feasible methodology to design the parameters of damping orifice for good landing performance. This analysis and design optimisation method can be used for the general design of oleo-pneumatic shock absorber with fixed cross-sectional area damping orifice.