I. Introduction
Bodington (Reference Bodington2017) compared the scores assigned by women and men to the same wines in 23 tastings. Four different tests in that article support the null hypothesis that female and male judges assign about the same ratings to the same wines. One difficulty with that finding, and many other evaluations of wine tasting results, is that small sample sizes increase the possibility of accept-a-false-null-hypothesis Type II error. This short article presents the results for a large sample; the 2016 Wines of Portugal Challenge in which panels that included at least three female judges and at least three male judges assigned scores to 260 wines.
Corbin (Reference Corbin2006) reviewed more than 40 published evaluations of taste tests that differentiated between female and male tasters. She found gender-related differences in taste preferences for sweet, salt, sour, bitter, and fruit flavors. While her results did not include comparisons of women's and men's preferences for wine, others have reported differences related to wine with respect to sight, taste, and smell. Recently, for example, Sena-Esteves, Mota, and Malfeito-Ferreira (Reference Sena-Esteves, Mota and Malfeito-Ferreira2018) reported that women preferred sweeter red wine than men, but only for 32 g/L sugar, while there were no differences at lower concentrations. Ristic et al. (Reference Ristic, Danner, Johnson, Meiselman, Hoek, Jiranek and Bastian2019), using an online survey to obtain hedonic and emotional responses towards certain wine aromas, reported differences between women and men for some aromas. Mora, Urdaneta, and Chaya (Reference Mora, Urdaneta and Chaya2018) found gender differences in the emotional responses elicited by wines. However, Pickering and Hayes (Reference Pickering and Hayes2017) found that women's stated wine style preferences differed from men only for dry sparkling and dry sherry wines. Despite the differences between women and men mentioned previously, the prizes awarded in dozens of international, national, state fair, county fair, magazine, and other wine competitions are determined by pooling the scores assigned by female and male judges. If women and men do have different wine taste preferences, then a different gender balance may lead to different awards. The gender balance of judges may bias results. This article presents a large-sample test of the potential for that bias.
II. The Portugal Challenge
The Wines of Portugal Challenge is an annual competition among wines produced by more than 1,000 vintners in more than 30 of the country's wine growing regions. In 2016, each of the 1,328 wines were assessed and scored by panels of five to seven judges. The wines were tasted blind and each judge assigned a score between 0 and 100 for each wine that he or she assessed. See a more detailed explanation of the Portugal Challenge in Bodington and Malfeito-Ferreira (Reference Bodington and Malfeito-Ferreira2017). Of the 151 judges, 40 were women and 111 were men. Panels that included at least three women and three men assessed and scored 260 wines. Those panels were composed of 21 female judges who assigned 833 scores and 24 male judges who assigned 903 scores. That sample of 1,736 wine-score observations is the subject of this article.
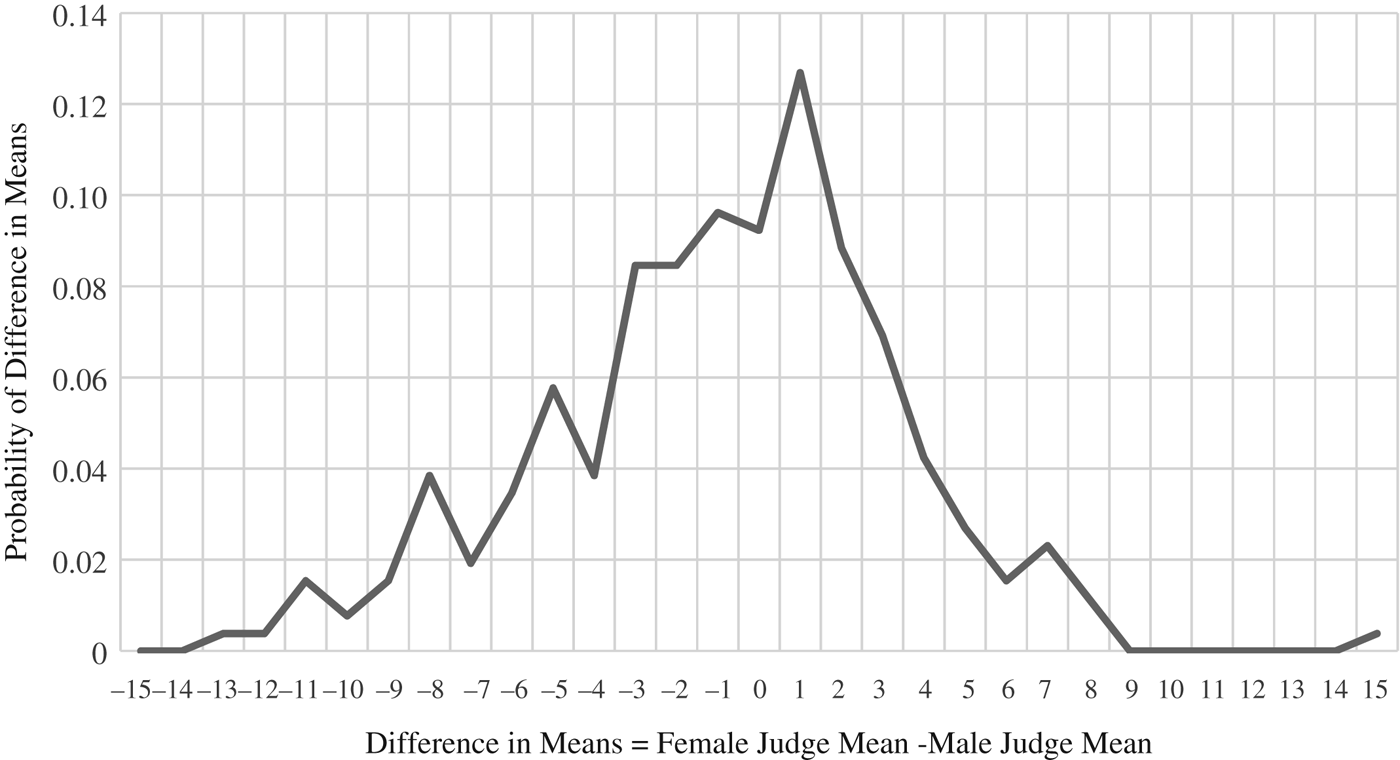
The distribution of the difference between the mean of the female judges’ scores and the mean of the male judges’ scores on the same wines is shown in Figure 1. The distribution of that difference has a mean of –0.8 score points, a standard deviation (SD) of 4.2 points, and the shape is nearly symmetric with a skewness of –0.2. Although that –0.8 difference in means is small at less than one point, due to the large sample, it is marginally significant. A two-sample t-test of the null hypothesis that the difference is zero has a p-value of 0.09.
Difference in the Means of Scores Assigned by Female and Male Judges to the Same Wines (260 Wines Scored by at Least Three Female and Three Male Judges)

III. Analysis of the Distribution
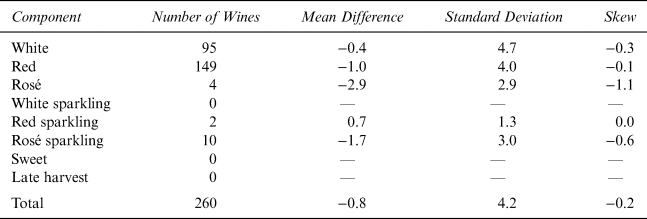
Is the broad distribution in Figure 1 a mixture of component distributions that may reveal differences between female and male judges’ scores? The Portugal Challenge categorized wines as white, red, rosé, white sparkling, red sparkling, rosé sparkling, sweet, and late harvest. The statistics that describe the distributions of differences in gender means for each of those categories is shown in Table 1. Still subject to the requirement that at least three men and three women have assigned scores to a wine, except for red and white wines, there are too few observations to be useful. The results for white and red indicate that men assigned higher scores than did women and that men also assigned even higher scores to red than white wine. However, both of those differences are small and two sample t-tests show that they are not statistically significant.
Summary of Component Distributions (260 Wines Scored by at Least Three Female and Three Male Judges)

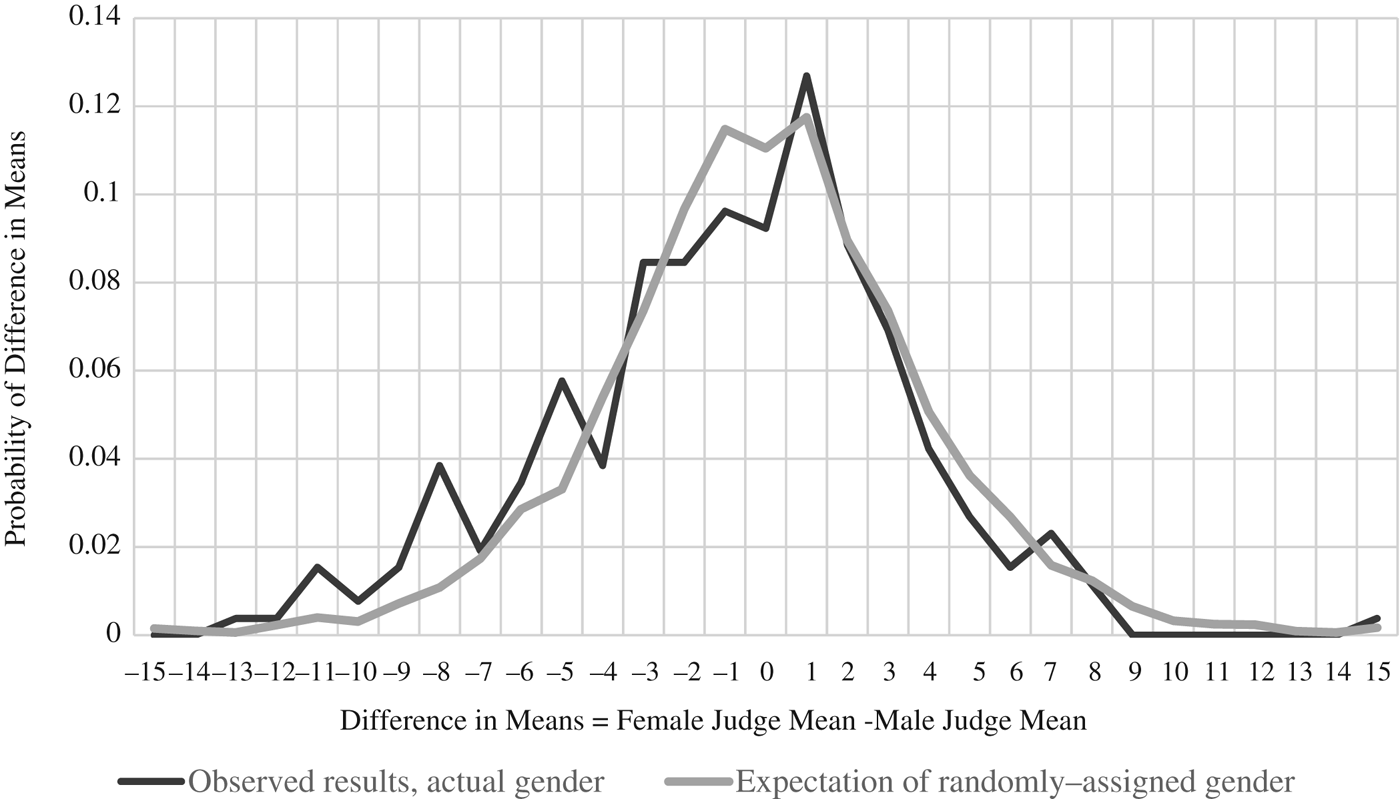
What is the cause of the variation in Figure 1 and the SDs in Table 1? Bodington (Reference Bodington2017), Corbin (Reference Corbin2006, p. 2), and Jackson (Reference Jackson2009, p. 87) conclude that non-gender-related differences between individuals are the primary reason for variance in scores. That view is tested here by calculating the distribution of results for 1,000 cases in which men's and women's scores were shuffled randomly amongst each other. The wines, the number of male and female judges, the number of scores assigned by women, the number of scores assigned by men and the actual wine-score observations were not changed. Only the gender assignment of each judge was random. The resulting distribution is shown in Figure 2. The expectation of the results when the gender is randomly assigned appears as the lighter line in Figure 2.
Difference in the Means of Scores Assigned by Female and Male Judges to the Same Wines, Observed and Randomly-Assigned Gender Results (260 Wines Scored by at Least Three Female and Three Male Judges)

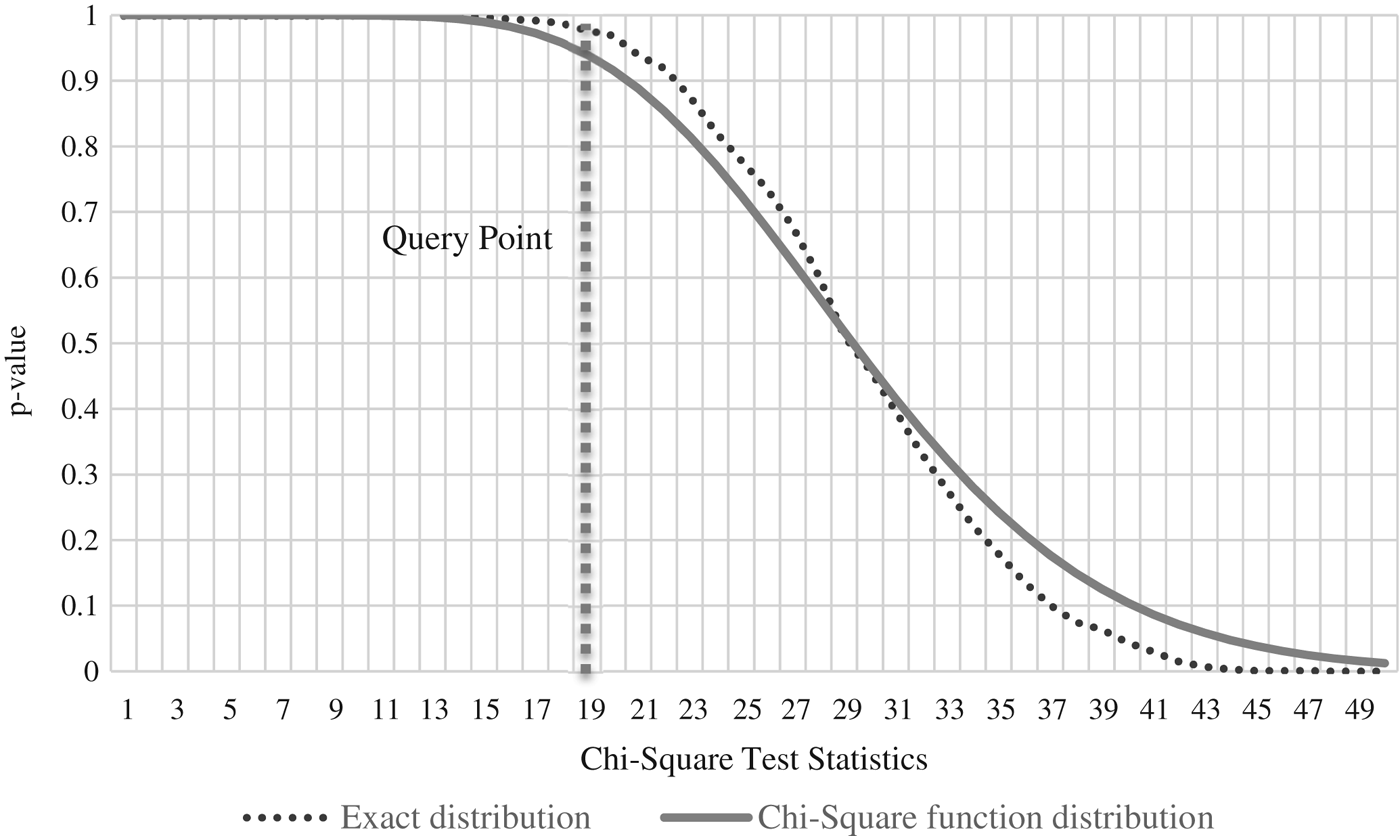
If actual-gender results are no different than random-assignment-gender results then gender does not explain any difference; variation must be due to non-gender-related idiosyncratic and random factors. That is the strong implication of Figure 2. Visually, there is little difference between the observed results and the random results. The correlation between the two distributions is greater than 0.9. Results for a chi square test of the null hypothesis that the two distributions are the same are shown in Figure 3. The chi-square test statistic for the observed results is approximately 18.5, thus the p-value for the null hypothesis is approximately 0.95.
Exact and Chi-Square Function Distributions of Chi-Square Test Statistic (260 Wines Scored by at Least Three Female and Three Male Judges)

IV. Conclusion
The large-sample findings noted earlier are consistent with the small-sample findings in Bodington (Reference Bodington2017). If the accept-a-false-null-hypothesis Type II error is made by combining women's and men's scores when judging wine competitions, this article has shown that such error is small. The variation in the ratings assigned by judges is material and that variation appears to be due to idiosyncratic factors and randomness in the place of gender-related factors.
Although the potential for Type II error is small, it cannot be dismissed. The differences that are detectable in univariate lab tests may get lost in the multivariate complexity of a wine competition's tasting room that is rich with variance in wines, judge training, palate fatigue, idiosyncrasy, and randomness. The results noted previously imply that the more cautious approach, particularly for wines with sweet or strong or unusual flavors, is to test tasting results for differences in gender-specific ratings. If the p-values are low, report the gender-specific results and the possibility that female and male judges may have put different ribbons in the tasting room.