Introduction
An understanding of the processes of basal motion is key to answering questions of glacier surges, ice-stream motion and seasonal variations in glacier speed. Most glaciologists suggest that a decrease in effective pressure, the difference between ice-overburden and subglacial water pressure, plays an important role in basal motion, but the specific mechanisms remain unclear (e.g. Reference PatersonPaterson, 1994; Reference WillisWillis, 1995). Models of this motion fall into two general categories, based on the nature of the bed. In hard-bed models, the bed is hypothesized to be consolidated rock or undeformable sediment, and sliding is the dominant mechanism. In soft-bed models, the bed is composed of a tillFootnote * that can deform. The soft-bed models are complicated by the fact that two water pressures are involved: that of the water within conduits or hydraulically linked cavities, and that within the pore space of the till. The bed of each glacier is unique and probably consists of regions of both hard and soft beds, and it is likely that effective pressure affects each glacier somewhat differently.
In the companion paper (Reference Nolan and EchelmeyerNolan and Echelmeyer, 1999; here denoted N&E), we described the use of seismic reflection techniques to directly measure transient changes of about 1 km2 of the bed of Black Rapids Glacier, Alaska, U.S.A. (N&E, fig. 1), over a 45 day period. These seismic anomalies followed the sudden drainage of supraglacial lakes (jökulhlaups) up-glacier of our study site, and were accompanied by large, temporary increases in basal motion. We refer the reader to N&E for detailed descriptions of Black Rapids Glacier, the experimental methods, basic seismic theory, the observations, defining characteristics of the “normal” and “anomalous” seismograms, and sample seismograms. In the present paper we use the observed seismic changes to determine the subglacial morphology and the processes responsible for the changes. While we do not directly address the mechanisms of basal motion in this paper, our observations and interpretations provide information on the role of till parameters, such as effective pressure and saturation, in basal processes occurring coincident with abrupt changes in basal motion.
The observations described in N&E place both spatial and temporal constraints on the possible causes of the seismic anomalies. In this paper, we focus on the changes that occurred to reflector PPN (N&E, fig. 6) which changed from positive to zero amplitude during the second and third anomalies (Fig. 1). Any change responsible for the second and third seismic anomalies must have occurred over the horizontal resolution of this reflector, which is an area at least 200 m by 350 m (N & E). Coincident changes found in the later-arriving reflections (e.g. PPS, multiple P-P) indicate the bed changed over an area 700 m wide by 1300 m long as well. Therefore, the responsible mechanism must affect a large area, about 1 km2, in as short a time as 36 min (as in the third anomaly), and yet persist for as long as 2 days (as in the second anomaly) (N&E, fig. 10). Further, these changes must be seismically reversible, i.e. the anomalous state reverts back completely to the original, normal state (Fig. 1; N&E, fig. 10).
Comparison of sample seismic traces that reveal anomalies. The light trace shown in (a) is a normal trace that is repealed as the light trace in (b–d). In (e), traces from the second and third anomalies are compared. Most of the interpretations in this paper are based on the first P-P reflection, which disappears during the second and third anomalies. Comparisons of these traces, from geophone 10, are typical of those made with the remaining 23 geophones for each daily record.

In the first section of the paper, we discuss the seismic analysis methods we employed for comparing the various possible morphologies with the constraints imposed by the observations. In the next section, we use these methods to test two morphological models: the transient formation or thickening of a water layer between ice and rock (a hard-bed model) and the transient change in one or more properties of a subglacial till layer (a soft-bed model). The hard-bed model is shown to be insufficient to explain the seismic anomalies adequately. In the final section, we concentrate on the properties of till and how they can change in time. We show that a temporary decrease in saturation of the till or an increase in effective pressure are the only properties among the possibilities that we have identified that can satisfy the observed reflection coefficient constraints. However, we have found no mechanism by which effective pressure can increase within the measured time constraints. A glaciological mechanism by which till saturation can temporarily decrease is proposed.
Seismic Theory
Ice, water, rock and tills each have a distinctive range of three seismic parameters: P-wave speed (V P), S-wave speed (V S), and density (ρ). We use the observed seismic waves to constrain these parameters, and thus constrain the possible basal morphology.
Reference Alley, Blankenship, Bentley and RooneyBlankenship and others (1987) and Reference Alley, Blankenship, Bentley and RooneyRooney and others (1987) were able to generate and record both P-P and S-S reflections, and then use these waves to determine the basal morphology of Ice Stream B (UpB), West Antarctica. Since the ice stream has no steep valley walls, the reflecting interfaces were safely assumed to be vertically beneath the shot-receiver axis. Thus the two reflections they measured were interpreted as coming from the top and bottom of a basal layer, and since S-waves cannot travel through water, the slow basal layer had to be till. Layer thickness and wave speeds were determined from travel times using common depth point (CDP) methods. Knowledge of V P was used 10 constrain the till’s porosity, and V P constrained the effective pressure in what was assumed to be a saturated till.
Our travel-time information alone is inadequate for a similar analysis, and we do not have incident S-waves to work with. While the first P-P arrival (from reflector PPN; Fig. 1b) may be reflecting from the top of a till layer, we know that at least two of the subsequent P-P waves (from PPC and PPS) are reflecting from other parts of the valley, and not from the bottom of the layer beneath PPN. We cannot single out any two reflections as defining the top and bottom of the same till layer. Even with the 1997 drilling data, we do not have enough information to confidently distinguish any particular reflection as coming from the bottom of a till layer.
Direct measurements of V P and V S, such as Blankenship and others’ (1987), are the preferred method for constraining morphology. Unfortunately, their method for reliably generating S-waves remains a mystery, as later experiments conducted with nominally the same set-up failed to generate them (personal communication from C. Bentley, 1996). The inability to generate S-waves reliably is endemic in exploration seismology, and alternative methods have been developed to help constrain V S using only incident P-waves.
One such method involves the use of reflection coefficients, the theoretical ratio of the amplitude of the reflected (P-P) or converted (P-SV) wave to the amplitude of the incident wave, which is calculated by assigning the three seismic parameters (V P, V S and ρ) to each of the two media at an interface. Continuity of displacements and tractions then leads to a set of non-linear equations giving the reflection coefficients as a function of the incidence angle. The seismic parameters, and thus morphology, can be determined by inverting these equations using the observed reflection coefficients. This approach is similar to that used to determine lithology and pore content by studying reflection amplitude variation with increasing source-receiver offset (amplitude V S offset (AVO) techniques). Most AVO literature concerns the detection of spatial anomalies, but some studies have successfully detected temporal changes (4-D AVO), such as those associated with steam injection into oil wells (Reference Ito and NurIto and others, 1979; Reference Tsingas and KanasewichTsingas and Kanasewich, 1991).
AVO analysis is often used for seismic exploration of gas-or liquid-bearing rocks and sediments. Rocks generally have similar densities and V P/V S ratios, but the presence of only a few percent gas or oil in the rock matrix can decrease V P by 50% while hardly affecting V S (Reference MurphyMurphy, 1982). These variations lead to changes in the reflection coefficient and are often called “bright spots”. Unless V S is known, however, these bright spots cannot be confidently distinguished from unrelated phenomena that produce the same result. S-wave data are, unfortunately, usually lacking (as in our case), and the V P/V S ratio cannot be determined directly. However, this ratio strongly influences shear wave conversion at non-normal incidence, and this in turn affects how reflection coefficients vary with incidence angle (Reference Castagna, Castagna and BackusCastagna, 1993; Reference Spratt, Goins, Fitch, Castagna and BackusSpratt and others, 1993).
There are several limitations to this approach. In practice, the amplitudes of reflected waves are often difficult to determine because of interference from other waves, variable source coupling and material in homogeneity. On a valley glacier, these problems are further compounded because the U-shaped valley tends to focus energy from widely separated points back toward the geophones that are located along the glacier center line (Reference RöthlisbergerRöthlisberger, 1972).
Reflection coefficients and AVO
A seismic reflection is caused by a discontinuity in particle displacement arising from a contrast of sufficient magnitude in cither elastic (wave speeds and density) or anelastic (e.g. attenuation, permeability; Reference Bourbié, Coussy and ZinsznerBourbié and others, 1987) properties. The amplitude and polarity of the reflected wave are dependent on the magnitude of these various contrasts and on the wave’s incidence angle. This dependence is expressed in the amplitude reflection coefficient, R defined as the ratio of the amplitudes of the reflected and incident waves. R can have an elastic, R el, and an anelastic, R Q, component. At normal incidence, the approximation R = R el + R Q is valid (Reference Bourbié, Coussy and ZinsznerBourbié and others, 1987; Reference NolanNolan, 1997).
Bourbié and Reference Bourbié and NurNur (1984) found that, under all conditions, R Q was negligible for incidence angles greater than about 30°, and typically only important at smaller angles when |R el| was less than about 0.1. Although attenuation contrasts can be quite large in glaciological situations, our conclusions are similar to theirs in that for the incidence angles of interest in this study (> 45°), the reflection coefficient due to a contrast in attenuation is much smaller than the corresponding elastic reflection coefficient. Therefore, we consider only elastic contrasts (i.e. R = R el) in the following analysis. A more detailed discussion of attenuation contrasts can be found in Reference NolanNolan (1997) as they are likely to be important in glaciological seismic studies at near-normal incidence.
For reflections from the welded interface of two half-spaces at normal incidence, the reflection coefficient for a P-P reflection can be expressed simply as

where subscripts “1” and “2” specify the upper (incident wave) and lower medium, respectively, and ρV P is the acoustic impedance of the medium. Note that when the acoustic impedance of the lower medium is less than that of the upper, a change in polarity is expected between the reflected and incident waves. We use “polarity” to describe real phase changes (i.e. 0° and 180°); imaginary phase changes require velocity dispersion due to attenuation, which we consider negligible for this part of our study. A reflection is considered positive when the direction of first motion matches that of the direct wave. The equations for reflection coefficients at non-normal incidence are considerably more complicated because of P-to-SV conversion; these are the so-called Zoeppritz equations (e.g. Reference Aki and RichardsAki and Richards, 1980).
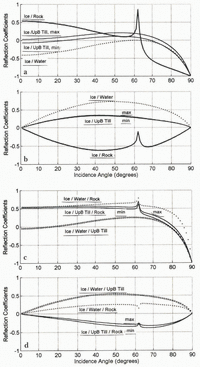
For our daily records, the incidence angles for the P-P, P-SV and multiple P-P waves were about 45–55°, 55–65° and 15–25°, respectively. These large incidence angles preclude the use of Equation (1), for reasons made clear in Figure 2. This figure shows examples of reflection coefficients derived from the Zoeppritz equations for ice over half-spate beds of rock, till and water as a function of incidence angle. Representative densities and wave speeds for the media are given in Table 1; we use these values for calculating the results shown in these figures. As can be seen, both the polarity and amplitude of P-P and P-SV reflections can vary significantly with incidence angle.
Example reflection coefficients vs incidence angle: (a) P to P for half-spaces; (b) P to S for half-spaces; (c) P to P for thin layers; (i) P to for thin layers. The wave speeds and densities used are given in Table 1.


We include Figure 2, in part, because the only previous plot of such data published to the Journal of Glaciology (Reference RichardsRichards, 1988) is in error. It appears that a minus sign was lost in the application of the second equation of Aki and Richards (1980, p. 150), causing all of his P-to-SV curves to be of the wrong polarity. Such a difference has significant implications for the seismic interpretation of changes at the basal interface of Variegated Glacier, Alaska, during its 1982–83 surge.
Before continuing our discussion of modeling basal morphology, we take a closer look at the work of Reference Alley, Blankenship, Bentley and RooneyBlankenship and others (1987) to emphasize the necessity of considering amplitude and polarity variation with offset. When determining arrival times, Reference Alley, Blankenship, Bentley and RooneyBlankenship and others (1987) stated that they picked the first trough and the first peak for reflections from the top and bottom of the till layer, respectively, “because a phase reversal should occur between these arrivals, since the acoustic impedance in the till is less than in the ice and presumably less also than in the substrate”. While the latter assumption is true at all incidence angles, a P-P reflection from an ice/till interface will be negative only at near-normal incidence (< 25°; Fig. 2a) for the wave speeds and densities that they determine in their analysis. However, the incidence angles of Blankenship and others ranged from near-normal to 60°. As Figure 3a shows, the majority of their reflections should not have had their assumed phase reversal. This means that the travel times used by these authors are probably off by 1/4 period (either delayed or advanced, we cannot tell which). Such an error in travel time would cause substantial errors in either their calculated values of V P, till thickness (h till), or both. Using their frequency of about 300 Hz, we estimate that the maximum effect on one or the other parameter is about ± 25%. If both parameters are equally in error, they would both be oil” by about ±20% (i.e. V P = 1550 ± 300 m s-1, h till = 7.6 ± 1.5 m), which nearly doubles their range of uncertainly but keeps the same central values.
Seismic support for the hard-bed model. Shaded region is range of VP for water due to uncertainty in pressure and temperature. It intersects the loci of (VP,water, VS,ice) that yield R PP (50°) = 0. This intersection is within the uncertainty of the actual S-wave speed in temperate ice, shown as horizontal lines, indicating that water layers may be seismically transparent at an incidence angle of 50°.

Thin layers and vertical resolution
The Zoeppritz equations are defined for a welded interface between two half-spaces. While 600 m of ice can be regarded as a half-space, basal layers of till or water might not be. Here we apply these equations to layers thinner than a seismic wavelength. We assume that a reflection from a layer is observable at the seismometer if the source energy, the size of the impedance contrast and the signal-to-noise ratio are all of sufficient magnitude, regardless of the thickness of the layer.
Reference RickerRicker (1953), Reference WidessWidess (1973) and Reference Kallweit and WoodKallweit and Wood (1982) provide useful criteria for determining what thickness of layer can be detected and if its vertical extent can be resolved. The basic idea is that reflections from the top and bottom of a layer ran be distinguished accurately in practice only when the layer is at least 1/4 wavelength (λ) thick, due to destructive interference. In what follows, we use the terms “thick” and “thin” to distinguish between layers where we can potentially resolve the top and bottom of the layer according to this criterion, and those where we cannot, respectively. For example, a water layer less than 5 m thick is considered thin (λ = 18 m; Table 1). We model thick layers as half-spaces (Fig. 2a and b) and thin layers as a part of a three-layer system (Fig. 2c and d).
However, as Reference WidessWidess (1973) and Koefoed and Reference Koefoed and de Voogdde Voogd (1980) have shown, a layer may be detectable far below the 1/4 wavelength limit, even though the top and bottom reflections are no longer distinguishable. In such cases, the amplitude of a wave reflected from a thin layer is related to its thickness by constructive superposition of the reflected waves from the top and bottom of the layer. Therefore, temporal changes in the seismic properties of such thin layers should result in changes in amplitude of the reflections.
In our three-layer models, reflections from the top and bottom of the thin middle layer add constructively. For very thin layers, multiple reflections within the layer may also be included if they, too, arrive within one half-cycle. The additional energy of these multiples is small, however, and. for the case of a thin till layer, we simply trace the incident wave down through the middle layer, with a transmission coefficient, reflecting off the substrate (a till–rock reflection coefficient) and back up into the ice (transmission). We modeled the ice–water–rock sandwich by analytically summing the infinite series of multiples (similar to Reference RichardsRichards, 1988).
Figure 2c and d show the theoretical response of thin layers of water and UpB till between ice and rock. As can be seen, the reflection from the bottom of the layer, at the rock, dominates R PP. In neither case does the reflection from the lower interface destructively interfere with that from the upper interface to yield R PP. These curves for thin layers are typical for the probable range of their seismic parameters. The significance of this will be clarified further in the next section, when we enforce R PP = 0 as an observational constraint.
Inversion of reflection coefficients
Our seismic measurements give us an estimate of the temporal changes in P-F and P-SV reflection coefficients. The Zoeppritz equations express these reflection coefficients as non-linear functions of the seismic parameters (V P, V S, ρ) for the two media and the angle of incidence. We have reasonable knowledge of these parameters for ice, and wish to solve for those within the underlying material. However, these equations cannot he analytically inverted without linearization (e.g. Reference Carazzone, Srnka, Castagna and BackusCarazzone and Srnka, 1993; Reference Demirbag, Coruh, Costain, Castagna and BackusDemirbag and others, 1993). Such linearization tends to break down for offsets greater than about 30°, which is less than the minimum value for P-P waives in our investigation. Therefore, we have used a simple iterative approach by which we fix two of the three seismic parameters (V P, V S and ρ) and iterate on the third until the calculated reflection coefficient is sufficiently close to that observed. This can be done for each parameter, yielding the locus of points in (V P, V S, ρ)-space that leads to a given reflection coefficient at a specified angle of incidence. In some cases, one or more of the parameters for the reflecting layer can be estimated a priori, such as for water or bedrock, in which case the inversion is better constrained. We use this approach herein,
Basal Morphology
Our goal in this section is to determine the basal morphology using our seismic measurements. We do this by inverting the observed reflection coefficients on normal and anomalous days for the seismic parameters V P, V S and ρ of the bed, and comparing these values to the physically permissible ranges for the hard- and soft-bed models. Use of this method assumes that we can quantify R PP, and that we can specify the permissible ranges for V P, V S and ρ of ice, water, rock and till. Each of these assumptions requires caution. Of the seismic parameters, the only well-established values are for water. The range of seismic parameters for the bedrock beneath Black Rapids Glacier (granodiorite, diorite and metasedimentary rocks) can also be estimated well enough for our purposes (we use values from Reference RichardsRichards (1988) in Table 1, for consistency with Figure 2). For temperate ice, ρ is well constrained, V P is fairly well constrained (±40 m s-1) and V S is less constrained (±75 m s-1) (N&E). The values for till are even more poorly constrained, and are discussed at length in Appendix A.
Reflection coefficient on normal days
Quantification of reflection coefficients in seismic studies is often difficult. For Black Rapids Glacier under what we term normal conditions, we can estimate R PP by comparing P-P and multiple P-P reflection amplitudes (Reference RöthlisbergerRöthlisberger, 1972; Reference SmithSmith, 1997). These techniques are valid only if both waves are reflecting from the same location with the same incidence angle, which we know is not true for our daily reflection data (N&E, fig. 7). These conditions are probably met, however, for our longitudinal seismic section near zero offset (N&E, fig. 4b). Using this method, the reflection coefficient for the “normal” reflection is about 0.3.
Since this value of R PP is measured at near-normal incidence along the glacier center line, we can invert Equation (1) for the acoustic impedance of the (half-space) bed:

Using densities given in Table 1 we obtain a value for V P of the lower half-space equal to 6191, 2319 and 2751 m s-1, for a lower half-space of water, rock and UpB till, respectively. Under any reasonable conditions, V P for water and till are much lower than these calculated values. Therefore R ≅ 0.3 indicates that the reflector at this location is either consolidated bedrock or highly compacted, dense till, or that a thin layer of water or till exists over rock (Fig. 2).
There are several uncertainties inherent in this approach. First, we assume that the primary and multiple reflectors overlap and are at normal incidence. Second, the attenuation of temperate ice, used in this calculation, is not well known. Third, at normal incidence, the reflection coefficient for many reasonable tills is close to zero, and thus the top of such a layer could be seismically transparent at zero offset. In this last case, the measured R PP would be that of the lower interface of a till layer (i.e. the till/rock interface). Because of these uncertainties, and the ambiguities of the resulting wave speeds, we cannot use this value of R PP alone to distinguish between hard- and soft-bed models. Instead, we determine an R PP during the second and third anomalies and use it to further constrain the bed morphologies.
Reflection coefficient during anomalies
As already stated, the seismic observation that places the tightest constraints on bed morphology is the change in PPN, during the second and third anomalies. During these anomalies, the amplitude of this reflection decreased from a positive value (perhaps as high as 0.3) to zero on all geo-phones (Fig. 1). In N&E we discuss why we believe this wave disappeared and was not simply delayed. The average incidence angle across the geophones for PPN was 50°. We use the shorthand R PP (50°) = 0 to refer to this constraint of a zero reflection coefficient for PPN under anomalous conditions. Wc have more confidence in this reflection coefficient than in the “normal” value at 0° (R PP(0°) ≅ 0.3) because of the latter’s inherent uncertainties, as described above.
There is, however, still some uncertainty in the anomalous R PP. Theoretically, any non-zero R PP should produce a reflection and it seems unlikely that the reflection coefficient would become exactly zero. So why is there no reflection at the ice/till interface? Practically, attenuation and our finite signal-to-noise ratio (S/N) creates a range |R PP that can be considered “effectively zero”. We tried stacking the several anomalous traces to increase the S/N, but no signal emerged at the normal PPN time. If it had, there would be little doubt that the anomalous first arrival is not a delayed normal first arrival. The anomalous first arrival seems to exist on the normal traces (Fig. 1), although it cannot be determined definitely because of superposition of the preceding wave. The fart remains, however, that no plausible mechanism has been identified that can delay a reflection by a full wave period (N&E). At the end of the paper we demonstrate that reasonable values of till wave speeds and density could cause an ice/till reflection coefficient to be “effectively zero” over a broad range of angles.
The range of what can be considered an amplitude of effectively zero is somewhat arbitrary, but we can limit this range based on the observations of other researchers. Reference Alley, Blankenship, Bentley and RooneyBlankenship and others (1987) stale a range of V P and ρ values for their basal till layer that yields –0.03 ≤ R PP ≤ 0.01 at normal incidence (from Fig. 2a), and their reflections were clearly above the noise. Reference Atre and BentleyAtre and Bentley (1993), examining the same records, reported that R PP was positive at near-normal incidence. Anelastic effects should play a role at these incidence angles, however, and might add as much as +0.1 to the value of R PP shown in Figure 2a (Reference Bourbié, Coussy and ZinsznerBourbié and others, 1987). If so, Blankenship and others’ range of wave speeds and densities would always yield a positive value of R PP as determined from seismograms. Reflection coefficients of around 0.05–0.1, measured from clearly visible reflections, are often reported in the literature (e.g. Reference Bentley and CraryBentley, 1971; Reference SmithSmith, 1997). Based on these and other seismic exploration studies, we adopt |R PP| <; 0.01 as “effectively zero”. Thus, the constraints we use in our study are R PP (50°) < 0.01 (and, more likely, < 0.05 and possibly as high as 0.3) for the normal PPN reflections and R PP (50°) ≅ 0 (i.e. |R PP(50°)| < 0.01) during the second and third anomalies.
The hard-bed model
In our hard-bed model, we hypothesize that basal motion is the result of ice sliding over bedrock, and that, during the jökulhlaups, increased water and water pressure at the bed led to increased basal motion and somewhat synchronous changes in the seismic reflections. Using the change in R PP from normal to anomalous stales, we can test whether the anomalous state is caused either by a change in thickness or areal extent of an existing subglacial water layer or by the formation of a new water layer. During normal conditions, we assume that only thin layers, O (1 cm), are present at the bed (Reference WeertmanWeertman, 1964). We then invert the half-space and thin-layer models for the anomalous conditions.
For water, V S is zero, and ρ is nearly constant (≈ 1000 kg m-3) over the pressure (P) and temperature (T) range we consider likely at the bed. V P varies somewhat under these conditions; Reference WilsonWilson’s (1959) study of V P (P, T) for water limits the range to 1403–1425 m s-1 near 0°C and P € [0, 6 MPa]. Mere we assume that the salinity of the sub-glacial water is low.
Under the condition that R PP (50°) ≅ 0, we find that a water layer beneath the glacier can indeed produce a zero reflection coefficient (Fig. 3) within the reasonable range for V S of temperate ice given in Table 1. In this figure we plot V S for ice against V P for water (shaded region), subject to the constraint of a zero reflection coefficient at 50° (the solid curve). For water at 0°C and 5.4 MPa (600 m of ice), V P = 1411 m s-1 (Reference WilsonWilson, 1959). This corresponds to V S = 1911 m s-1 for ice, which is both within our range of uncertainty and less than the value of 1944 m s-1 determined by Reference Alley, Blankenship, Bentley and RooneyBlankenship and others (1987) at Ice Stream B, as expected for our warmer ice.
The possibility exists, therefore, that water at the bed is seismically transparent (R PP) at an incidence angle of 50°. This means that we cannot detect the presence of a water film in the normal state or the formation of a new-water layer at a hard-bed interface, except by the increase in travel time it would cause. From Figure 1, the increase in first-reflection-arrival travel time is about 10 ms. If the sole cause of this increase in two-way travel time was the formation of a water layer, such a layer would have to be at least 7 m thick, determined using V P,water = 1414 ± 11 m s-1. Destructive interference at 50° within a thin (i.e. < 5 m) water layer is not a tenable conclusion, because the strong reflection from the lower (water/rock) interface gives rise to a large overall reflection coefficient with such a thin layer, as can be seen in Figure 2c.
The hypothesis of a hard bed and the observed change in reflected waves from the northern side of the valley thus leads to the conclusion that a water layer of thickness greater than 7 m temporarily formed, and then quickly disappeared, between the ice and bedrock at the PPN reflector. This layer must extend nearly continuously over an area with dimensions of at least 200 m by 350 m. Such a layer is not glaciologically reasonable nor was the required surface uplift observed by surveying (Fig. 1a). This conclusion does not change even if the water layer is underlain by a soft bed instead of bedrork.
Thus it seems unlikely that transient water layers of any thickness can produce the observed seismic effects—thin ones based on seismic reflection theory and thick ones based on glaciological considerations. We cannot seismically rule out the possibility that thin water layers formed, bin we can state that they were not the sole cause of the observed changes.
The soft-bed model
In the soft-bed model, we hypothesize that a till layer at PPN becomes seismically transparent (i.e. R PP = 0) during anomalies II and III, causing the 10 ms delay in first reflection arrival (Fig. 1), due to a change in one or more its properties (i.e. porosity, effective pressure, saturation). As there is then no reflection from the top of the layer, the anomalous first reflected arrival is then either from the base of the till layer or from a different part of the bed (e.g. nearer to PPC in N&E, fig. 6). We can constrain the minimum thickness of this layer to be 5 m by assuming that the entire 10 ms (two-way travel time) was caused by a change in acoustic properties within it. using a (conservative) minimum V P of 1000 m s-1 (i.e. 10 ms ×1000 m s-l/2 = 5). We refer to this as the seismic thickness of the layer. This minimum thickness does not assume that the first anomalous arrival comes from a till/bedrock interface, although the following evidence suggests it.
When we began this work in 1993, we had no a priori information about the basal morphology of Black Rapids Glacier, and the preceding analysis was the first direct evidence that a thick subglacial nil layer existed beneath the glacier. During spring 1997, basal cores were retrieved at locations measured seismically (i.e. reflectors PPN and PPC; N&E, fig. 6) as part of the University of Alaska’s ongoing research program on Black Rapids Glacier (W. Harrison, M. Truffer, K. Echelmeyer, R. Motyka and M. Nolan, unpublished data). These cores provide conclusive evidence that this glacier is underlain by a thick till layer (6 ± l m) at these sites, providing a “ground truth” for our seismic interpretations of basal morphology, and substantiating this method of determining morphology based on observed temporal changes. Thus a till/bedrock reflection should exist in both the normal and anomalous measurements, and it is likely that the first anomalous arrival is such a reflection based on its arrival time.
Any changes in the seismic parameters (V P, V S, ρ) must occur over the entire seismic thickness such that both the ice/till interface becomes transparent and no new seismic interface forms within about 5 m of the ice/till interface. If some change occurred at the interface that caused it to become transparent but also created a till/till interface (beneath it) with a contrast in either wave speeds or density, we should have observed a reflection sooner than 10 ms. A gradational change in till properties with depth causing the incident wave to bend or reflect at anew angle (i.e. other than the two-layer Snell’s law angle) is also unlikely. This bending phenomenon is well known to occur in earthquake weaves that travel downward through increasingly dense and faster media. However these changes occur over tens of seismic wavelengths, not tenths as would be required within a till layer. In either case, the angle at which a wave reflects is controlled by the contrast in wave speed, not acoustic impedance. We cannot completely rule out the possibility that gradational changes could account for our observations, but consider them so unlikely that we do not consider them further.
The seismic properties of tills are dependent on a number of factors (see Appendix A for a detailed discussion). The grain-size distribution, as well as the shape of the grains and their pore space, significantly affects both the wave speeds — by hundreds of meters per second — and the way in which these speeds depend on effective pressure. Porosity (φ), defined as the percentage of the total volume that is pore space, and saturation (S), the percentage of this pore space that is water-filled, both strongly affect the wave speeds. Further, given any one combination of these physical variables, changes in the in situ effective pressure also have a large effect on wave speeds. Based on the discussion in Appendix A, we consider the permissible range of seismic parameters for subglacial tills to be V P € [1000, 2100] m s-1, V S € [150, 550] m s-1 and ρ € [2000, 2330] kg m-3. The density of a fully saturated till is related to the porosity by

where ρ w is the density of water filling the pore space, ρ s is the density of the solid matrix, and porosity is expressed as a fraction. The range of density above is calculated from Equation (3), using ρ s = 2700 kg m-3 and a range of porosity of 20–40%.
A zero reflection coefficient for a thin till layer with properties within these ranges is not likely (Fig. 2c). inversion of a model with a thin till layer over bedrock and R PP (50°) = 0 yields a maximum P-wave velocity of about 600 m s-1 given a reasonable range of V S and ρ. This speed leads to a violation of the assumptions behind the thin-layer model: if the wave speed were 600 m s-1, the layer thickness would need to be at least 3 m (i.e. 600 m s-1 × 10 ms/2). This exceeds the λ/4 (= 1.9 m) limit that defines the thin-layer model, and a zero reflection coefficient for the thin layer could not be obtained. Thus, any solutions involving till must be found using the thick-layer (half-space) model.
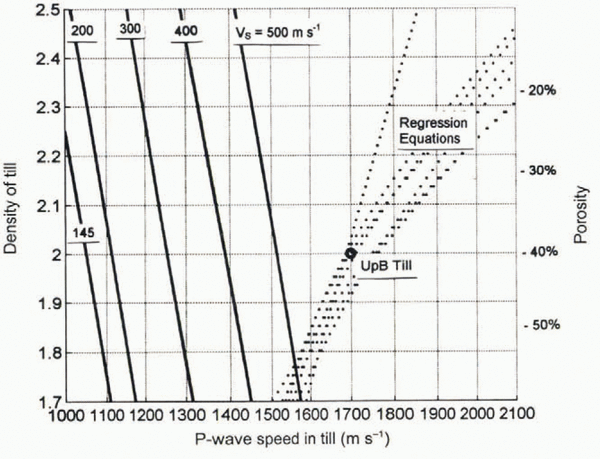
The seismic parameters that lead to a zero reflection coefficient at an ice/till interface in a thick layer model are shown in Figure 4. Each of the solid curves in this figure represents those values of V P and ρ (or, equivalently, porosity) for which R PP (50°) = 0 at a fixed value of V S. Parameters yielding R PP (50°) > 0, the constraint for the normal state, are to the upper right of the appropriate V S curve. For example, the symbol labeled UpB marks the reflection coefficient obtained using the best estimate of V P (1700 m s-1), V S (145 m s-1) and φ (0.35) for Ice Stream B till as given by Reference Alley, Blankenship, Bentley and RooneyBlankenship and others (1987); this yields R PP (50°) = 0.185, which is to the right of the R PP = 0 curve for this value of V S. This figure also shows that, for a given S-wave speed, there are continuous ranges of V P and ρ that lead to R PP(50°) ≅ 0. Also shown in Figure 4 are regression curves from various researchers (discussed in Appendix A) that loosely constrain a corridor of physically acceptable V P as a function of fully saturated porosity.
If a temporary increase in fully saturated porosity (i.e. with no change in saturation) were solely responsible for the seismic anomalies, Figure 4 indicates that the porosity throughout a 5 m thickness of till would have to change from less than about 30% in the normal state to more than 50% in the anomalous state. The reverse process would have to take place in less than 36 min. Not only is a porosity of 50% unlikely, but several studies have shown that such a large change is not possible for a till with typical permeability.
Loci of till seismic parameters (VP, VS, ρ) that yield R PP (50°) ≅ 0. These loci (solid curves) are the result of an iterative-type inversion of the Zoeppritz equations. Dotted tines are regression equations from various researchers (detailed in Appendix A) that give VP as a function of fully saturated porosity.

Reference ClarkeClarke (1987) modeled changes in porosity within a till layer due to increased water pressure at the ice/till interface. Deformational dilatation of the till near the interface led to a 12% increase in porosity there, but φ was unchanged below about 0.5 m, even after 50 hours. Further, these changes were not completely reversible. Similarly, Reference Boulton and HindmarshBoulton and Hindmarsh (1987) indicate that time-scales of thousands of years are required to change porosity by 15% at depths of several meters.
The remaining analysis relies on knowing whether we can consider till “drained” or “undrained” on the time-scale of hours. Here we use “drained” to mean that the pore water is free to leave the pore space in response to changes in pore-water pressure caused by increased normal stress (as well as the reverse process). We use “unchained” to mean that the amount of the pore water is not free to change on the time-scale of interest. A change in the amount of pore water is driven by a gradient in pore-water pressure, P pw. Till will respond to changes in pore-water pressure in an undrained manner on the time-scale of hours because changes in the amount of pore water at 5 m depth require a high-pressure source to exist for hundreds of hours. This is because such changes are normally governed by a diffusional process, with a diffusivity k that depends on the porosity, compressibility and permeability of the till, as well as the properties of the pore water itself (Reference de Marsilyde Marsily, 1986); k ranges from about 4 × 10⁻⁴ to 6 × 10⁻⁷ m2 s-1 (Reference PatersonPaterson, 1994). Coarse, permeable tills have the larger diffusivities. From the cores recovered in 1997, we now know that Black Rapids Glacier till is characterized by a broad range of grain-sizes, from large cobbles to silt, and so is at the middle to lower end of this range of diffusivity. Standard analysis shows that the characteristic time, τ, required for an abrupt change in P pw to propagate a distance z down into a till layer is given by:

The amplitude of the pressure pulse at depth z at time τ is about 15% of that applied at the surface. For example, an abrupt pore-water pressure change at the top of the till layer would propagate only 0.07–1.8 m (depending on k) in 36 min, at which depth it would have a relative magnitude of only 15%. For a 5 m thick layer of Black Rapids Glacier till, this diffusion time is on the order of hundreds of hours, significantly longer than the 36 min required by our observations. Therefore, pore-water pressure, and thus the amount of pore water, is not likely to change quickly in response to a rapid increase in hydraulic system pressure caused by the jökulhlaups.
Since significant changes in till density are mainly due to changes in the amount of pore water, we believe that the density of the subglacial till did not change substantially during the seismic anomalies. In the remaining analysis, we must use a constant assumed density (porosity) because our seismic measurements do not provide a direct measurement of it. Typical values of till porosity lie in the range 20–40% (Reference Boulton, Dent and MorrisBoulton and others, 1974; Reference Alley, Blankenship, Bentley and RooneyAlley and others, 1987; Reference Boulton and HindmarshBoulton and Hindmarsh, 1987; Reference ClarkeClarke. 1987; Reference KambKamb, 1991; Reference Fredlund and RahardjoFredlund and Rahardjo, 1993). However, as the till found beneath Ice Stream B (which defines the upper limit of this range) has an anomalously high clay content (Reference Tulaczyk, Kamb, Scherer and EngelhardtTulaczyk and others, 1998) and consists of ocean-deposited sediments, it is probably not representative of subglacial tills of valley glaciers. We therefore assumed a more realistic porosity of 25% for Black Rapids Glacier till (ρ = 2250 kg m-3 from Equation (3)), noting that our interpretations are valid for any porosity within the range 20–40%.
Curves of constant reflection coefficient as a function of V P and V S for a fixed density (porosity) are shown in Figure 5. The regions enclosed in shaded rectangles in Figure 5 show our estimates of the permissible ranges of V P and V S for fully and partially saturated tills. Use of a different density simply shifts the curves left or right in this figure. For example, if we used 20% or 40% porosity, the R PP (50°) = 0 curve would be located at approximately the R PP (50°) = –0.01 and +0.02 curves shown for φ = 25%, respectively. As can be seen in this figure, solutions of (V P, V S, ρ) for both the normal (R PP < 0) and anomimgalous (R PP = 0) states exist within the seismic parameter space for till, and our somewhat arbitrary choice of φ = 25% does not affect this conclusion. Thus we find that both the normal and anomalous seismic states can be accommodated by a model with a thick subglacial till layer.
Seismic support for the soft-bed model. Shown are the loci of seismic parameters (VP, VS) that yield a constant R PP (50°) (as annotated) for φ = 25%. Shaded regions are permissible range of wave speeds of till (Appendix A). Loci for the normal state (positive R PP) and the anomalous state (R PP = 0) lie within the permissible ranges.

Figure 5 can also be used to determine the minimum changes in seismic parameters that are necessary to change from the normal to anomalous states. If we assume that a minimum decrease in R Pp of 0.01 is required to change from one state to another, then, from Figure 6, we see that only processes which decrease V P by at least 40 m s-1, increase V S by at least 25 m s-1, or both, can account for our observations. It is likely that the reflection coefficient in the normal state is greater than 0.01, as discussed earlier, and thus much larger changes in V P and/or V S would be required. For example, if R PP = 0.3 in the normal state, then V P would need to decrease by over 1000 m s-1 to cause the anomalies.
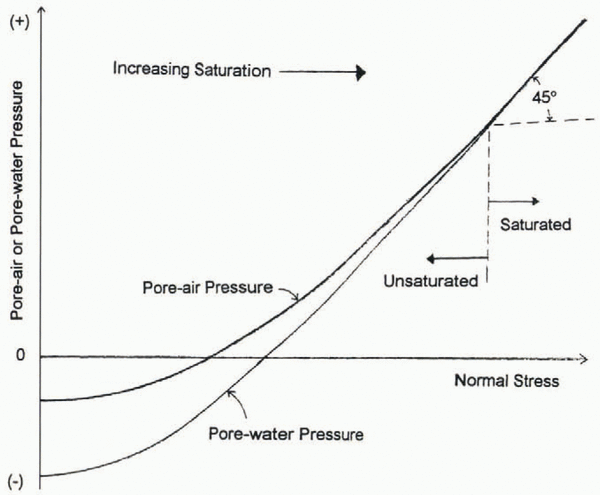
Pore-mater and pore-air pressure in unchained till as functions of normal stress (overburden). When the till is fully saturated, changes in normal stress cause a corresponding change in pore-water pressure, and the effective pressure remains constant. As the normal stress decreases, however, air exolves from the pore water, causing saturation to decrease. Adapted from Fredlund and Rahardjo (1993, fig. 8.8).

Causes of the Seismic Anomalies
Knowing that the permissible wave speeds and density of till fall within the range required by our observations is a necessary, but not sufficient, condition for validation of a soft-bed model. We need to determine whether any of the physical properties of till can affect these seismic parameters in the required manner, as well as find a mechanism that acts reversibly within 36 min through at least a 5 m thickness. Our analysis of the possibilities has led us to propose a new glaciologic mechanism for such changes, as no other mechanisms were found to be sufficient. Wc propose that the seismic anomalies are caused by a decrease in saturation, due probably to a local redistribution of the normal stress (overburden, P o) on the till. In this section we discuss how a local decrease in normal stress can decrease pore-water pressure, causing gas to exolve and saturation to decrease. We then test this model using reflection amplitude changes during the anomalies. Finally, we discuss why changes in the effective pressure of the till are not as likely, and end with a discussion of the effects of decreasing saturation on the shear strength of till.
Proposed mechanism for changing seismic properties of till in situ
We propose that Black Rapids Glacier till may change from fully saturated in the normal state to partially saturated in the anomalous state. If a large change occurred in the normal stress exerted by the ice on a fully saturated till, the pore-water pressure would decrease sufficiently to cause gases dissolved in the pore water (perhaps originally entrapped in basal ice and liberated by melting) to come out of solution, thus decreasing saturation to less than 100%. The saturation change occurs by increasing the pore space, not decreasing pore-water volume, and the process of gases exolving and dissolving is controlled by the pore-water pressure, not the effective pressure. It is completely reversible, can occur on a time-scale of minutes, and has been widely recognized in soil mechanics (Reference Fredlund and RahardjoFredlund and Rahardjo, 1993; Reference Terzaghi, Peck and MesriTerzaghi and others, 1996).
If a conduit system becomes pressurized during a rapid input of water to the basal hydraulic system, the water pressure may exceed the local normal stress and hydraulically jack up the ice in a localized region (Reference Iken and BindschadlerIken and Bindschadler, 1986; Reference Kamb and EngelhardtKamb and Engelhardt, 1987). Such transient increases in local water pressure have often been observed in boreholes, including those on Black Rapids Glacier. If the increase in water pressure is confined to the neighborhood of the conduits, then, because of the viscoelastic properties of ice, the region outside this neighborhood may experience a drop in local normal stress at the ice/till interface. The elastic strength of the ice can act temporarily like a bridge, spanning over the till and transferring the weight of the ice to fewer supports. The span over which such a stress redistribution occurs could possibly be quite small if feeder conduits or linked cavities of the hydraulic system were located within the reflector area. It is only required in our model that the normal stress over the seismic footprint be reduced on average, as small regions of higher normal stress (i.e. near conduits or water layers) within this area would probably be seismically undetectable at 50° incidence.
Such a process could redistribute normal stress over a potentially large area of the bed and be essentially reversible. The complex basal geometry of a valley glacier may lead to jacking not only in the longitudinal direction (e.g. Reference IkenIken, 1981) but transversely as well. The change from the anomalous to the normal seismic state could occur quickly (such as in the third anomaly) due to a sudden drop in water pressure of the hydraulic system, or slowly (such as in the second anomaly) by viscous relaxation. Considering that the Maxwell time, a measure of viscoelasticity, for ice is on the order of a few hours, it is plausible that a sufficient load redistribution may last many hours.
Decreases in normal stress lead to a decrease in pore-water pressure in undrained tills (Reference Fredlund and RahardjoFredlund and Rahardjo, 1993), as seen in Figure 6. As the pore-water pressure drops, dissolved gases (probably air, in this case) will evolve (Fig. 6). The exolved gas fills the concomitant increase in pore volume. As the till is undrained within our time-scale (i.e. pore-water mass is constant), the porosity must also be increasing slightly. This process is well documented in soil mechanics (e.g. Reference Todd and SimmonsTodd and Simmons, 1972; Reference Fredlund and RahardjoFredlund and Rahardjo, 1993), but is complex and highly dependent on grain-size distribution and strain history. Therefore there is no simple way to calculate the point on Figure 6 at which evolution begins; Reference Fredlund and RahardjoFredlund and Rahardjo (1993) present data which suggests this point is about 2 MPa, which is the same order as local overburden pressure. Also noteworthy in Figure 6 is that pore-water pressure can be negative while the soil is still under a substantial load.
As will be discussed in the next section, a drop in saturation from 100% to 97% would cause major changes in the seismic reflections. This 3% decrease can occur if there is a 0.05 m increase in thickness of a 5 m thick till layer with an initial porosity of 25%. Following the second and third jökulhlaups, we observed increases in surface elevation near the glacier center line of up to 0.15 ± 0.03 m (Fig. 1); this is on the same order as that observed on other glaciers (Reference Iken and BindschadlerIken and Bindschadler, 1986; Reference Kamb and EngelhardtKamb and Engelhardt, 1987). While some of the total elevation change can be ascribed to longitudinal compressive strain in the ice, it is plausible that as much as one-third of it (i.e. 0.05 m) is due to a true uplift at the bottom. Note, however, that such a large decrease in saturation is not required to satisfy this model: a decrease of only several tenths of a per cent from full saturation can meet the minimum seismic constraint of a change from positive to zero reflection coefficient. The uplift required to make such a small change occur is below our surveying resolution
Fills can either dilate or compress during shear, depending on their physical properties and strain history. This would either decrease or increase pore-water pressure, respectively, in an undrained till; the former could potentially cause a decrease in saturation. Such a change in saturation would be confined to the dilated layer, which would be much less than 5 m in our case (e.g. Reference ClarkeClarke, 1987), and is therefore not a valid mechanism to explain the observed anomalies.
Laboratory measurements have qualitatively documented the type of seismic changes we propose beneath Black Rapids Glacier. For example, in an experiment on saturated limestone, Reference Todd and SimmonsTodd and Simmons (1972) found that V P dropped instantaneously as confining pressure was dropped. After several hours in a water bath, V P rose to the expected speed for a fully saturated sample at the new pressure. Todd and Simmons interpreted this as a rapid opening of pre-existing thin cracks, causing saturation to decrease (an initial tin-drained response), followed by slow filling of the new pore space with water (a drained response).
Effects of a change in saturation on the reflection coefficients
Exploration seismologists searching for hydrocarbons look for large spatial anomalies caused by gas-filled pore space. This is because saturation affects wave speeds, which in turn affects R. Since we can only speculate about the magnitude of temporal changes, if any, in saturation, this lest of our model is limited to determining whether a decrease in saturation will decrease R, as required by the observations.
Glaciologists usually assume that subglacial tills are fully saturated, but few direct observations have confirmed this. Over long time-scales, however, full saturation does seem to be a reasonable assumption, considering that there is a constant supply of water to the till. Further, full saturation is implicit for most theories of till deformation because they entail a single stress-state variable for effective stress (i.e. P eff = P o – P pw to describe the mechanical behavior of the till). Although considerable soil mechanics research has shown that the mechanical aspects of a saturated soil, including volume change and shear strength, are governed by this effective stress, it does not sufficiently describe the behavior of unsaturated soils. In this case, two independent stress-state variables are required, as discussed later. We assume that in situ Black Rapids Glacier till is fully saturated under normal conditions.
Numerous laboratory studies have shown that a decrease in saturation from 100% to 97% causes a substantial decrease in V P, while V S remains unaffected, as shown in figure 7a and summarized in Table 2a (see also Appendix B). As the saturation is decreased even further, both V P and V S increase slightly: dry values (S = 0%) are generally about 5% higher than the minimum reached near S = 97%. Unconsolidated sediments show a larger relative decrease (50–70%) than consolidated sediments and other rocks (40–60%).
Effects of changes in saturation and effective pressure on seismic wave speeds. These curves are adapted from a variety of authors from measurements of rock and soil samples (see Appendices B and C). In (a), a small decrease in saturation is seen to have a large effect on VP but not on VS. Subscript “100” implies S = 100%. In (b), fully saturated VP is seen to be relatively insensitive to changes in effective pressure, while partially saturated VP is about as sensitive as VS (at any saturation).

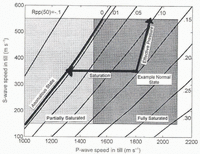
Changes in V P and V S due to a decrease in S are plotted in vector form in Figure 8. Here we use the central value as a likely, yet arbitrary, normal state. We find that a decrease in saturation decreases R PP (50°), as required to satisfy our observations. In the example in Figure 8, we have used a conservative 25% decrease in V P, but much larger changes are possible (e.g. Fig. 7a). In fact, changes due to saturation can reasonably produce a change from R PP (50°) = 0.3 to zero, our most stringent seismic constraint. Only a 0.1% decrease in S is required to meet the minimum required decrease in R PP of 0.01.

Changes in saturation and effective pressure that support the soft-bed model. The runes are (VP, VS) loci of constant R PP (50°) (as annotated). The normal state is represented by a positive R PP (50°), and the anomalous state by R PP (50°) ≅ 0. The shaded regions are the permissible values VP and VS for partially and fully saturated tills. The vector labeled “Saturation’ represents a minimum change in R PP due to a decrease in saturation from 100% to 97%. The vector labeled “Effective Pressure” represents the likely change in R PP due to an increase in Peff from 100 to 800 kPa. Both of these vectors point towards the anomalous state given an arbitrary starting-point within the normal state, and their direction will not change due to larger or smaller changes in Peff or S.

The effects of the decrease in saturation shown in Figure 8 across the entire range of incident angles are shown in Figure 9. There it can be seen that R PP ≅ 0 over a broad range of incident angles (about 30–55°). In this scenario, the conclusions regarding saturation effects are not sensitive to our estimate of 50°.
Example normal- and anomalous-state reflection coefficients. The anomalous reflection coefficients are nearly zero across a broad range of incidence angles, indicating that our results are not sensitive to the estimated incidence angle of 50°. The normal curve is calculated from VP = 1800 m s-1, VS = 350 m s-1 and ρ = 2250 kg m-3. The anomalous curve differs only in that VP = 1300 m s-1, a change that can be caused by a decrease in saturation (Fig. 8).

Unsaturated tills have a significantly higher attenuation than saturated tills (Reference Palmer and TravioliaPalmer and Traviolia, 1980; Reference Dvorkin, Mavko and NurDvorkin and others, 1995). In this way, an unsaturated till layer would act analogously to an acoustic ceiling tile, an analogy first suggested by Reference RichardsRichards (1988) for the weak basal layer of Variegated Glacier during its 1982 surge.
Shortcomings of changes in effective pressure
Most theories of basal motion suggest that decreased effective pressure (P o – P pw) within till leads to increased deformation there (Reference PatersonPaterson, 1994). In this section, we show that if a change in effective pressure was solely responsible for the anomalies, the observed reflection coefficients indicate that it must increase at reflector PPN. Further, we show that the only way that effective pressure can change in an undrained till is for the saturation to decrease in response to a decrease in local normal stress.
Reflection coefficients can determine the direction of change in effective pressure because increased effective pressure tends to make tighter grain-to-grain contacts, which increases wave speeds, while decreased effective pressure decreases wave speeds. P eff affects V P and V S differently, depending on saturation, grain-size and microstructure (Appendix C). Using relations of V P(P eff) and V S(P eff) from the literature (e.g. Fig. 7b), we can determine the effects of P eff on R PP using the curves in Figure 8.
As in the analysis of the effects of saturation, we cannot determine the actual magnitude of the effect on R due to a change in effective pressure, because we do not know the initial speeds or the change in P eff. We can, however, use the relative change in V P and V S for an assumed change in P eff to determine whether an increase or decrease in P eff is required to decrease R during the seismic anomalies. We assumed a change of 100–800 kPa, which is within the range of pressures measured in boreholes on Black Rapids Glacier in 1990 (personal communication from M. Truffer, 1996). While borehole water levels do not directly measure P eff in the till, we expect that such changes are within this range. Table 2b summarizes the results of a literature review (details in Appendix C). An increase in P eff from 100 to 800 kPa would increase V P till by less than 100 m s-1 for a fully saturated glacial till and by about 200 m s-1 for a partially (< 97%) saturated one. V S should increase by about 200 m s-1 at any saturation.
The effects on R PP are shown in Figure 8. Here we chose the same central “normal-state” (V P, V S) values as before. The vector labeled “Effective Pressure” indicates the magnitude and direction of change in R PP (50°) due to an increase in effective pressure from 100 to 800 kPa. As can be seen, the vector points towards the anomalous state (R PP (50°) = 0), albeit obliquely. An increase in effective pressure during the anomalies is therefore a valid solution to the reflection coefficient constraints. But because of its obliqueness, it is not nearly as robust a solution as a change in saturation, and requires tighter constraints on the normal-state wave speeds. A decrease in effective pressure causes the vector to point away from the anomalous stale. Our choice of the range for P eff does not affect these results.
These results show that R is much more sensitive to saturation than to effective pressure. Thus, the vector sum of a 3% decrease in saturation and any reasonable decrease or increase in effective pressure will also decrease R.
While an increase in effective pressure is a valid solution for the reflection coefficient constraints, we have found no mechanism by which it can increase without a coincident change in saturation. Because P eff = P o – P pw for a fully saturated till, and noting that we have already ruled out changes in pore-water pressure, the local overburden must change. However, because the compressibility of water is much less than the compressibility of the soil structure, any increase in overburden in an undrained till is almost entirely transferred to the pore water (Reference Fredlund and RahardjoFredlund and Rahardjo, 1993, section 8.2.3). Thus, the effective pressure of a fully saturated, undrained till cannot be changed due to a change in normal stress (overburden) because there is a concomitant change in pore-water pressure such that the effective pressure remains constant (Fig. 6). It is only when the saturation is less than 100% that the effective pressure will change due to a change in overburden, as indicated by the bifurcation in Figure 6.
Shear strength of unsaturated till
The single-variable effective stress concept breaks down in an unsaturated till. Two independent stress-state variables are required for unsaturated soils because of their inherent suction, the magnitude of which depends on the grain-size distribution, microstructure, strain history and applied normal stress.
Reference Fredlund and RahardjoFredlund and Rahardjo (1993) develop the force equilibrium equations for an unsaturated soil to account for what they consider to be four independent phases: soil, water, air and surface tension. If the water and soil are assumed to be incompressible, the stress-state variables are (P o – P a) and (P a – P pw), where P a is the air pressure. The first term is the net normal stress on the soil matrix and the second term is the matric suction, or capillarity. These terms determine the shear at failure (Reference Fredlund and RahardjoFredlund and Rahardjo, 1993, equation (9.3)):

where τ f is the shear stress on the failure plane at failure, c ′ is a cohesion term, and Φ′ and Φ″ are constants giving the rate of increase in shear strength with net normal stress and matric suction, respectively. Φ′ is always greater than Φ″. When an unsaturated soil is compressed, the gases will dissolve and P pw will equal P a at full saturation, leading to the single effective stress for saturated soils.
The presence of matric suction in an unsaturated soil increases the shear strength of the soil. The magnitude is largely controlled by the microstructure, because the shape and size of the pores control surface tension. However, if the matric suction is caused by a decrease in P o, as described above, then the net normal stress would probably decrease more than the increase in matric suction, thus weakening the till (Fig. 6; Reference Fredlund and RahardjoFredlund and Rahardjo, 1993, section 9.3.4); whether the till actually increases or decreases in strength is dependent on the microstructure, grain-size distribution, strain history and the particular change in loading. Decreases in till saturation may be important, therefore, in basal dynamics and models thereof.
Conclusions
Using observations of changes in seismic reflections from Black Rapids Glacier presented in Nolan and Echelmeyer (N&E), we have interpreted the basal morphology and physical mechanisms of these seismic changes using 4-DAVO techniques. We have tested two hypotheses for basal morphology: a hard-bed model, in which a transient water layer forms between ice and bedrock, and a soft-bed model, in which the properties of a layer of till change in situ. An iterative-type inversion of the Zoeppritz equations for the observed reflection coefficients shows that both models have seismically realizable solutions. Glaciologically, however, we have ruled out the hard-bed model because the seismic arrival-time constraints require the transient water layer to be more than 7 m thick over an area 200 m wide by 350 m long. Thinner water layers, although they cannot account for the changes by themselves, could not be ruled out because such layers may be seismically transparent at 50° offset. Therefore, our analysis of the possible physical causes of the seismic anomalies is focused on mechanisms that can affect tills.
The soft-bed model predicted that a till layer at least 5 m thick exists beneath one of the reflectors, the first direct evidence for such a layer. Subsequent drilling at this location confirmed its existence and substantiated this novel technique for determining basal morphology based on temporal changes in reflections.
We found that changes in either of two properties of this till layer could explain the change in the reflection coefficient during the anomalies: a decrease in saturation or an increase in effective pressure. Changes in saturation place no limitations on initial and final wave speeds of the till (both of which are unknown, but were constrained by a literature review) because it is such a robust solution. A decrease in saturation from 100% to 97% can cause a substantial (50%) decrease in P-wave speed. Such a change would cause a significant decrease in the reflection coefficient, and the magnitude of this change ran satisfy our most stringent observational constraints. Smaller decreases in saturation cause smaller decreases in P-wave speed, which still satisfy our minimum constraints. On the other hand, we found that the only mechanism by which effective pressure could change also requires a decrease in saturation. The reflection coefficient response is much more sensitive to saturation than in effective pressure and we therefore consider a decrease in saturation to be the primary cause of the seismic anomalies.
Changes in till saturation can occur if a subglacial conduit system becomes over-pressurized during the jökulhlaups, which can then hydraulically jack the glacier off the bed in some locations. In the areas of decreased normal stress, the pore-water pressure within the till will decrease, causing gas to come out of solution and decrease saturation. Both the jacking and degassing processes can occur quickly and reversibly, as required by the observations. This decrease in saturation would change the shear strength of the till there, probably decreasing it. Thus the shear strength of huge areas of the bed can be affected by changes in other, hydraulically isolated regions of the bed, possibly resulting in a complex feedback system controlling glacier dynamics.
Acknowledgements
We would like to thank W, Harrison, D. Christensen, C. Lingle and M. Truffer for many useful discussions of the content of this paper. The first author would also like to thank the second author for his considerable efforts as Ph.D. Committee Chair. This work was funded by U.S. National Science Foundation grant OPP-9122783 and the Geophysical Institute of the University of Alaska Fairbanks.
Appendix A Range of Wave Speeds
As a first approximation, it is sometimes assumed that porosity is an indirect measure of the till dilation that accompanies deformation, and further that wave-speed measurements are a good indicator of porosity (e.g. Reference Alley, Blankenship, Bentley and RooneyBlankenship and others, 1987; Reference Atre and BentleyAtre and Bentley, 1993; Reference SmithSmith, 1997). However, these assumptions require caution. For example, Reference Eberhart-Phillips, Han and ZobackEberhart-Phillips and others (1989) have made a study of seismic wave speeds in fully saturated, unconsolidated ocean sediments as a function of porosity, clay content (C) and effective pressure. They round that clay content is as important as porosity in determining wave speeds. This means that spatial gradients in clay content may create effects as large as those in porosity. Several other spatially varying properties also affect wave speeds at this level, and they must be considered before making morphological interpretations based on wave speeds alone.
The importance of grain-size distribution on seismic properties has long been noted (e.g. Reference MorganMorgan, 1969; Reference HamiltonHamilton, 1970, 1976; Hamdi and Reference Hamdi and Taylor-SmithTaylor-Smith, 1981; Reference Marion, Nur, Yin and HanMarion and others, 1992). Reference Prasad and MeissnerPrasad and Meissner (1992) found that V P of unconsolidated samples varied by as much as 250 m s-1 between different grain-sizes and angularity. At the low effective pressures common in subglacial conditions, V P ranged from 1750 to 2000 m s-1 and front 550 to 700 m s-1 for fully saturated and dry samples, respectively. V S was found to vary little with grain-size, and for low P eff it was found to be about 300–350 m s-1 for both fully saturated and dry samples.
Clay content is especially important in determining wave speeds. Reference Marion, Nur, Yin and HanMarion and others (1992) found a peak in V P as clay content was experimentally increased in an unconsolidated sand/clay mixture. At P eff = 10 MPa, they found that V P was 2149 m s-1 for pure sand and 1950 m s-1 for clay, but when C was 40% by weight, the speed reached a maximum of 2500 m s-1. This effect was amplified at higher effective pressures.
These grain-size effects make comparisons between different tills difficult, if not impossible. For example, the wave-speed measurements of till beneath Ice Stream B: (Reference Alley, Blankenship, Bentley and RooneyBlankenship and others, 1987) may not apply to till beneath Black Rapids Glacier. This is because the Antarctic till has an unusually high clay content of > 30% (Reference Tulaczyk, Kamb, Scherer and EngelhardtTulaczyk and others, 1998), whereas Black Rapids Glacier till has < 7% (personal communication from M. Truffer, 1996). We also might expect till wave speeds to vary along ice streams and long glaciers if erosional clay content increases in the downstream direction, or if the type of bedrock from which the till is derived varies spatially.
The microstructure (the shape of the grains and their arrangement) also has a large influence on the acoustic properties of rocks and tills. Bourbié and Reference Bourbié and ZinsznerZinszner (1985) compared sandstones with nearly the same grain-size and porosity. They found that wave speeds and attenuation in those sandstones with thinner, flatter pores were more sensitive to changes in effective pressure than those in sandstones with round pores. The change in V P due to a change in effective pressure from about 0.1 to 5 MPa was < 50 m s-1 in a sample with round pores, while it was ten times larger in one with flatter pores. At 100 kPa the P-wave speed was 5270 and 4250 m s-1 for these two samples, respectively. These authors found a stronger correlation between microstructure and V P than between porosity and wave speed.
This effect of microstructure is clue to “squirt flow” (Reference Mavko and NurMavko and Nur, 1975; Reference Palmer and TravioliaPalmer and Traviolia, 1980; Reference Dvorkin and NurDvorkin and Nur, 1993; Dvorkin and others, 1991, 1995). These studies show that, at both seismic and ultrasonic frequencies, pore fluid is temporarily squeezed out of thin, compliant pores and into stiller, rounder pores by a passing wave. This fluid motion is the dominant mechanism of attenuation and velocity dispersion, and controls the relationship between effective pressure and wave speeds. Materials with many thin pore spaces will have a higher attenuation and lower wave speeds — particularly V P, as the bulk modulus is influenced much more than the shear modulus.
For a fixed grain-size distribution and microstructure, there is a good correlation between porosity and wave speed. The dotted curves in Figure 4 (labeled “Regression Curves”) show several empirical relationships between porosity and V P, most of which were measured for unconsolidated ocean-floor sediments (Reference MorganMorgan, 1969; Reference HamiltonHamilton, 1976; Hamdi and Reference Hamdi and Taylor-SmithTaylor-Smith, 1981; Reference Eberhart-Phillips, Han and ZobackEberhart-Phillips and others, 1989). They show the trend in relations between V P and φ at a range of effective pressures, and they loosely constrain a range of physically acceptable values for fully saturated sand/silt mixtures. Note that decreasing porosity leads to higher wave speeds.
Various measurements on fully saturated, unconsolidated sediments and tills (regression curves in Fig. 4) indicate that for φ = 0.25 ± 0.05, V P should be in the range 1700–2070 m s-1. It should be noted that many of these studies were done at effective pressures well in excess of those expected in our study. At P eff = 100 kPa, the laboratory measurements of Reference Marion, Nur, Yin and HanMarion and others (1992) on saturated mixtures of sand and clay showed a range of 1550–1750 m s-1 as porosity ranged from 0.4 to 0.2, respectively. The seismic observations of Reference Alley, Blankenship, Bentley and RooneyBlankenship and others (1987) on in situ Ice Stream B till at low effective pressure (~40 kPa; Reference KambKamb, 1991) and anomalously high porosity (> 0.32) and clay content give an estimated V P of 1550 ± 300 m s-1 (our error bar).
Data on the shear wave velocity are more sparse than those for P-waves. Reference HamiltonHamilton (1976) reports average V S for coarse sands, sand-silts and sand-silt-clays in ocean sediment samples to be 240, 430 and 390 m s-1, respectively (as corrected to 0°C following Reference ShumwayShumway, 1958); the actual range within the sample set was 100–550 m s-1. V S for Ice Stream B till (Reference Alley, Blankenship, Bentley and RooneyBlankenship and others, 1987) was 145 ± 30 m s-1 (our error bar); Reference HamiltonHamilton’s (1976) summary suggests that this low value of V S is indicative of a high porosity and clay content, as is the case there. Reference Prasad and MeissnerPrasad and Meissner (1992) report a range for V S of 300–600 m s-1 (depending on P eff) for a range of single grain-size samples.
Considering the uncertainty due to grain-size, micro-structure and porosity, we estimate the permissible range of V P for a fully saturated till beneath Black Rapids Glacier to be 1500–2100 m s-1, with the central value of 1800 m s-1 being the most likely. A permissible range for V S is 150–550 m s-1, with the higher values at effective pressures near 800 kPa, and the lower at 100 kPa. It is likely that P eff at reflector PPN is within 10% of overburden (i.e. 450 kPa), so we consider the central value of 350 m s-1 to be the most likely. For reasons described in the text, the permissible range for V S for partially saturated sediments is the same.
As described in Appendix B, partially saturated sediments can have P-wave speeds below 500 m s-1. From Figure 6, these low values of V P do not correspond with any permissible values of V S that would yield R PP (50°) = 0. Therefore, we consider the lower bound of partially saturated V P to be 1000 m s-1, corresponding to the lower bound of V S in Figure 5. As an upper bound for partially saturated V P, we use 1500 m s-1 — the lower bound of the fully saturated range — although the actual permissible range for partially saturated V P includes most of the fully saturated range.
Appendix B Seismic Changes due to Saturation
As shown in Figure 9a, as saturation (S) decreases from 100% to 97%, there is a significant drop in V P but little change in V S. Changes in saturation below about 97% have only minor effects on V P or V S; this is the cause of a well-known interpretative difficulty with “bright spots” in hydrocarbon exploration: the bright spots signify the presence of gas within the pores, but not its volumetric percentage (below about 97%). An explanation for how saturation affects wave speeds (Reference MurphyMurphy, 1982) can be found by examining the formulae for V P and V S:

where K and μ are the bulk and shear moduli, respectively. In a fully saturated sample, K (the inverse of compressibility) is dominated by the compressibility of water (~51 × 10-11 m2 N-1). As the saturation decreases to below 97%, K decreases to that of the more compressible rock matrix (< 3 × 10-11 m2 N-1) and V P decreases. As S decreases further, the density continues to decrease; this slowly increases V P to that of the fully dry sample. The amount of gas-filled pore space does not affect μ, so there is no decrease in V S. However, V S has the same 5% increase due to the decreased density as V P.
This change in wave speed can be demonstrated by a simple experiment. Place a sealed beer bottle on a table and tap it with a wooden spoon. Then shake it up, place it on the table and tap it again. The decrease in pitch and lone duration alter shaking is due to the change in compressibility arising from the presence of bubbles in the liquid — in effect, a drop in saturation. The frequency (pitch) of the sound is equal to V P/2L, where L is approximately the length of the bottle. The attenuation (which controls the duration) is proportional to V P -3. Therefore, as the wave speed decreases, both the frequency and tone duration decrease. This works with wine and hard liquors as well; it is not a function of carbonation.
Reference HamiltonHamilton (1976) reports data on coarse Ottawa sands with porosity of about 36%. At 100 kPa, V P dropped from 1900 to 500 m s-1 from 100% to 0% saturation, respectively. At 400 kPa, V P dropped from 2000 to 700 m s-1. Thus, in our range of effective pressure, V P dropped by 64–74% from the fully saturated value.
Reference Elliott and WileyElliott and Wiley (1975) studied unconsolidated sands (φ = 30%) at 700 kHz. At 7 MPa, V P dropped from 2200 to 1280 m s-1, a 42% decrease.
Reference Prasad and MeissnerPrasad and Meissner (1992) studied unconsolidated silts and sands with fixed grain-sizes at 100 kHz. At about 200 kPa, V P of a coarse silt/fine sand decreased from 1875 to 500 m s-1 going from 100% to 0% saturation. At the same effective pressure, V P of a medium-coarse sand decreased from 1950 to 650 m s-1. These two samples bracket their range of variation: a decrease of 67–73% from fully saturated to dry conditions.
Consolidated rocks show similar but smaller changes in V P with saturation: Reference Winkler and NurWinkler and Nur (1982) studied sandstone (φ = 23%) at frequencies of 500–1700 Hz. At about 100 kPa, V P dropped from 4000 to 1600 m s-1 when saturation dropped below 97%, a 60% decrease.
Reference DomenicoDomenico (1976) studied Ottawa sandstone at about 10 MPa and 200 kHz. V P dropped from 2073 to 1280 m s-1, a 38% decrease.
Reference GregoryGregory (1976) studied sedimentary rocks (φ = 4–41%) and gabbros at 1 MHz. He found that saturation effects were more pronounced at porosities less than 25%, but his curves of V P vs S were significantly different than those of most researchers. For example, at 100 kPa, V P of a sandstone with φ = 4% decreased from 4665 to 4268 m s-1 as S changed from 100% to 80%, but the decrease continued to 3506 m s-1 as saturation went to zero.
There is some uncertainty in the saturation at which the abrupt transition in V P occurs. For example, experiments by Reference MurphyMurphy (1982) on sandstones indicate that most of the change in V P has occurred by S = 97%, while those of Reference DomenicoDomenico (1976) indicate that the transition occurs at about S = 90%. The discrepancy in experimental results is likely due to the difference in frequency used in the studies (Reference Castagna, Castagna and BackusCastagna, 1993). These results show that a decrease of 25% in V P and zero in V S, as illustrated in Figure 8, is a conservative estimate if S goes from 100% to 97% or lower.
Appendix C Seismic Changes due to Effective Pressure
Changes in effective pressure affect V P and V S in the same qualitative way in unconsolidated silt, sands and clays, as well as sedimentary and igneous rocks (Reference GregoryGregory, 1976; Reference HamiltonHamilton, 1976; Hamdi and Reference Hamdi and Taylor-SmithTaylor-Smith, 1981; Reference Winkler and NurWinkler and Nur, 1982; Reference Eberhart-Phillips, Han and ZobackEberhart-Phillips and others, 1989; Reference Prasad and MeissnerPrasad and Meissner, 1992). When the pore space is fully saturated with water, V P is fairly insensitive to changes in P eff. When partially saturated, V P decreases with decreasing P eff. The effects on V S are comparatively insensitive to changes in saturation. As described in the text, the single valued concept of effective pressure (i.e. P eff = P o – P pw) breaks down for partially saturated media because gas pressure becomes important. Most researchers nevertheless continue to report wave speeds as functions of P eff = P o – P pw and, for belter or worse, we continue their practice here.
These effects are qualitatively shown in Figure 7b. This figure was adapted from data of Reference DomenicoDomenico (1976) and Reference HamiltonHamilton (1976) on unconsolidated sands, and Reference Winkler and NurWinkler and Nur (1982) on limestones. The actual relationship is strongly affected by the grain-size distribution and microstructure, and for the Black Rapids till we can only estimate the change in fully and partially saturated wave speeds due to a change in effective pressure from 100 to 800 kPa.
The data of Hamdi and Taylor-Smith (1982) are particularly useful in this light (reproduced in Reference NolanNolan, 1997). They show that as P eff is increased from 96 to 772 kPa, V P is increased by 50–100 m s-1. An increase in effective pressure from 100 to 800 kPa leads to an increase of about 200 m s-1 in V S. These samples were saturated ocean sediments (clay to fine sands) with relatively high porosities (φ = 34–52%), the porosity decreasing with increasing effective pressure.
Results on other unconsolidated samples are similar. Reference HamiltonHamilton (1976) reports V P varied less than 100 m s-1 in dry sands and over 200 m s-1 in brine-saturated sands, and that V S varied about 180 m s-1 at either saturation over this range of P eff. Reference Prasad and MeissnerPrasad and Meissner (1992) studied samples of single grain-sizes and found that fully saturated V P increased about 150 m s-1 as P eff increased by 1 MPa, while fully dry V P increased about 30 m s-1 MPa-1. V S increased about 70 m s-1 MPa-1 for both dry and saturated samples.
Combining these results, we estimate that an increase in P eff from 100 to 800 kPa will increase V P by about 100 or 200 m s-1 under fully or partially saturated conditions, respectively. V S should increase about 200 m s-1 at any saturation.