I. INTRODUCTION
Since the first report of photoelectrocatalytic water splitting on titanium dioxide (TiO2) electrode by Fujishima and Honda in 1972, TiO2 as a promising photocatalyst has attracted a lot of interest for hydrogen generation and pollution removal. TiO2 nanomaterials have many advantages such as low cost, environment-friendly and having very stable photocatalytic property.Reference Fujishima and Honda1–Reference Wu, Li, Liu and Zhang7 However, there are some shortcomings in the application of TiO2, such as small surface area, wide band gap, and easy recombination of light-excited electrons and holes. To resolve these problems, the researchers have persistently modified the structure of nano-TiO2, through the preparation of mesoporous materials and element doping methods to improve TiO2 specific surface area and to reduce the band gap.Reference Manju and Jawhar8–Reference Zhao, Feng, Peng, Huang, Guo and Li12 During the past few years, there are too many investigations that have been devoted to making TiO2 colorful for better optical absorption through metal, nonmetal doping and codoping, in which metal and nonmetal elements have been used to replace partial Ti and O ions in the nano-TiO2 lattice.Reference Liu, Chen, Liu, Andrews, Hahn and Yang13–Reference Zhang, Wang, Guo, He and Feng17 Despite much effort, to date, it is a major challenge to develop effective TiO2-based photocatalysts for solving environmental problem and remediating energy shortages.Reference Qi, Cheng, Yu and Ho18
To enhance the absorption of TiO2 in the visible light region and improve its photocatalytic activity, the color of TiO2 should be tuned to black. In 2011, Chen et al. reported that hydrogen reduction is an effective approach in shifting the band gap of TiO2 to around 1.5 eV and color of black.Reference Chen, Liu, Yu and Mao19 It was shown that black TiO2 with excellent photocatalytic performance is prepared by constructing a distinct crystalline core-disordered shell structure (TiO2@TiO2−x) through some chemical reduction methods,Reference Yang, Kao, Liu, Sun, Yu, Guo, Liou and Hoffmann20–Reference Li, Shi, Tu, Qian, Li, Yang and Lu29 and oxygen vacancies and Ti3+ states are introduced into the disordered shell, which increases the solar energy absorption and boosts the photocatalytic activity.Reference Chen, Liu and Huang30–Reference Wang, Yang, Lin and Yin38 The Ti3+ and oxygen vacancies exhibit an excellent photoelectrochemical water splitting performance because of the improved charge transport and the extended visible light response.Reference Chen, Beach, Maurya and Moore39–Reference Hu, Cao, Li, Yang and Xing41 Nevertheless, although the excellent enhancement of optical absorption was obtained for black TiO2 materials, most of them do not exhibit high efficiency for visible light–assisted water splitting. This is because surface defects and oxygen vacancies act as electron donors to enhance donor density and improve the charge transportation in black TiO2, but the excess surface defects and oxygen vacancies can also act as recombination centers for light-excited electrons and holes, which reduce the photocatalytic efficiency.Reference Barman, Saini, Sarkar, Roy, Satpati, Kanjilal, Ghosh, Dhar and Kanjilal42–Reference Li, Xu, Yan, Liu, Chen, Luo, He and Shen45 Recently, Sinhamahapatra et al. reported the magnesiothermic reduction of commercial TiO2 in the presence of H2/Ar followed by acid treatment to obtain black TiO2 for a dramatically enhanced photocatalytic hydrogen production.Reference Sinhamahapatra, Jeon and Yu46
In this work, black nano-TiO2 was prepared by sol–gel method combined with a two-step calcination process: the xerogel was first calcined under air atmosphere and then calcined under nitrogen with reductant Mg. The prepared black TiO2 samples were characterized by using various analytical characterization techniques. It was demonstrated that the black TiO2 possesses a unique crystalline core–amorphous shell structure composed of disordered surface. Compared with the white TiO2, the black TiO2 samples exhibit significantly improved photocatalytic hydrogen production in the methanol–water system.
II. EXPERIMENTAL
A. Material and sample preparation
The black TiO2 was prepared as follows. To prepare 5% diluted nitric acid and to ensure that all kinds of glassware dry and clean, 50 mL of absolute ethanol was added in a 100 mL beaker and 5 mL of butyl titanate was added slowly, stirring slowly for 5 min and then stirring vigorously for 15 min. Afterwards, to adjust the pH to 3 using dilute nitric acid (5%), continuing intense stirring for 30 min to prepare a transparent and light white solution. The solution was stirred at room temperature until a white TiO2 gel was obtained. The gel was dried at 60 °C for 12 h to gain the xerogel. The xerogel was crushed to get powders and then calcined at 500 °C for 4 h under air atmosphere to obtain the white nano-TiO2.
The obtained white TiO2 was calcined at 400–600 °C for 4 h in nitrogen with reductant Mg (the ratio of Mg and TiO2 is 9:1). After the calcination treatment, the samples were dispersed in 2.0 M HCl solution and stirred for 8 h, and then the samples were washed with sufficient amount of water to remove the acid and dried at 100 °C for 12 h to obtain a series of black TiO2 samples at different temperatures. Following a similar procedure, black TiO2 samples with different ratios of Mg and TiO2 (7:1, 9:1, and 11:1) were obtained, prepared at 500 °C for 4 h in nitrogen.
B. Methods of characterizations
The X-ray diffraction (XRD) patterns of photocatalysts were determined by XRD (Bruker D8, Bruker, Karlsruhe, Germany) using Cu Kα radiation and a step size of 0.02° in the range of 10–80°. N2 adsorption–desorption measurements were performed at −196 °C using an AUTOSORB-1 apparatus (ASIMP Quantachrome Instruments, Boynton Beach, Florida). The samples were degassed at 200 °C for 2 h. The specific area was calculated by the Brunauer–Emmett–Teller method. Raman spectra were collected on a thermal dispersive spectrometer using a laser with an excitation wavelength of 632 nm at laser power of 10 mW. The morphology was examined by transmission electron microscopy (TEM) (JEM-2100F, Japan) operated at 200 kV. Photoluminescence (PL) emission spectra were measured on a FluoroMax-4 (Horiba JobinYvon, Longjumeau, France) spectrofluorometer, excited with a 330 nm light. The ultraviolet-visible (UV-vis ) spectra were performed with a UV-vis spectrophotometer (U-4100, HITACHI, Tokyo, Japan). BaSO4 was the reference sample, and the spectra were recorded at room temperature in air within the range of 200–800 nm.
C. Photocatalytic testing
Fifty milligrams of black nano-TiO2 samples loaded with 1.0 wt% Pt was added into an aqueous methanol solution (100 mL, 20%) in a closed gas circulation system (Perfect Light Company Labsolar-A6, Beijing Perfectlight Technology Company, Beijing, China), and then the full solar wavelength light irradiation was obtained from the 300 W Xe lamp was used to photocatalyze water splitting as the UV-visible light source. Methanol was used as a sacrificial reagent, and the anodic reaction generating oxygen from water did not happen. The reaction was performed at room temperature (25 °C) under Ar atmosphere. The amount of H2 generated was determined by online gas chromatography system connected to the reactor.
III. RESULTS AND DISCUSSION
A. Crystal structure and morphology
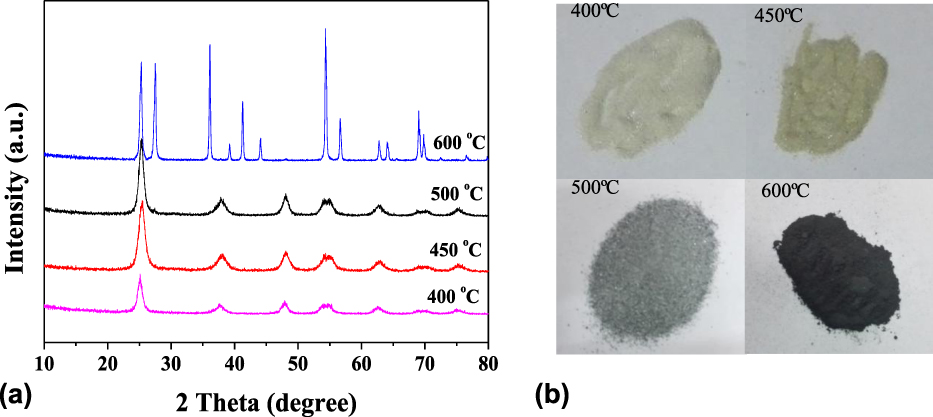
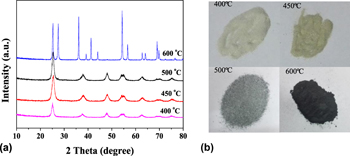
Figure 1(a) represents XRD patterns of prepared black TiO2 samples by Mg reduction with the Mg and TiO2 ratio of 9:1 in nitrogen atmosphere at the calcining temperatures of 400, 450, 500, and 600 °C. As shown in Fig. 1(a), for the samples at temperatures 400, 450, and 500 °C, the diffraction peaks at 2θ = 25.4, 37.8, 47.5, 54.3, and 62.4°, respectively, are the TiO2 anatase crystal planes of (101), (004), (200), (105), and (204); severally, implying the three samples are all anatase TiO2,Reference Kumar, Rajadurai and Sundararajan47,Reference Xia, Li, Zhang, Kruger, Murowchick, Selloni and Chen48 and there were no other phases, illustrating that the samples are kept in the same phase as below 500 °C, and as the temperature increases, the crystallinity of the sample increases, which will be beneficial to the photocatalytic reaction.
XRD curves of TiO2 samples prepared by Mg reduction at different calcination temperatures (a) and the photos of different color prepared TiO2 samples (b).

Comparing the XRD curves of the former three samples, the XRD curves of the fourth sample show strong diffraction peaks at 2θ = 27°, indicating that the anatase phase begins to transform into rutile phase, and the content of rutile phase in the product is higher. This indicates that the anatase phase begins to transform into rutile phase at 600 °C, which is different from that of many literatures. Most of the literatures reported that the phase transition temperature of bulk TiO2 is higher. The different results in our tests are mainly attributed to two reasons. One is due to the quantum effect of nanoparticles. The phase transition temperature of different nanocrystals is not the same. When the grain size is reduced to nanoscale, with the further increase of the temperature, the grain begins to grow large, but the grain size is not uniform and presents a normal distribution. Thus, smaller-grain-sized nanoparticles exhibit lower phase transition temperatures. Another reason may be due to the addition of the Mg reductant, which is active in high temperature and the chemical reaction between the Mg and the relatively stable crystal structure of TiO2 occurred in the calcination process, which affects the crystal structural changes, further causing changes in its phase transition temperature. Based on the high crystallinity anatase phase TiO2, the photocatalytic performance is even more superior. In the next comparative experiment, the calcination temperature of 500 °C will be used as the reference condition.
In Fig. 1(b), we can see the color deepening as the temperature increases, and the color changes from white to gray and black. Therefore, Mg reduction of TiO2 nanoparticles leads to surface modification, which is reflected in enhanced light absorption and the color change.Reference Li, Xu, Yan, Liu, Chen, Luo, He and Shen45
Based on XRD data, the corresponding crystallite sizes were estimated using the Scherrer formula from the full-width at half-maximum of the (101) diffraction peak (2θ = 25.4°) of TiO2. The statistics of crystallite sizes are shown in the Table I. From 400 to 500 °C, when the temperature rises, the crystallite size increases slowly. However, the crystallite size of the sample 600 °C is higher than others, which may indicate that the presence of Mg at high temperature also facilitates the phase transformation. Similar results were also found in other reports.Reference Sinhamahapatra, Jeon and Yu46,Reference Wang, Fu, Yin, Wu, Guo, Xu and Zhong49
The crystallite sizes of samples using the Scherrer equation from XRD data.

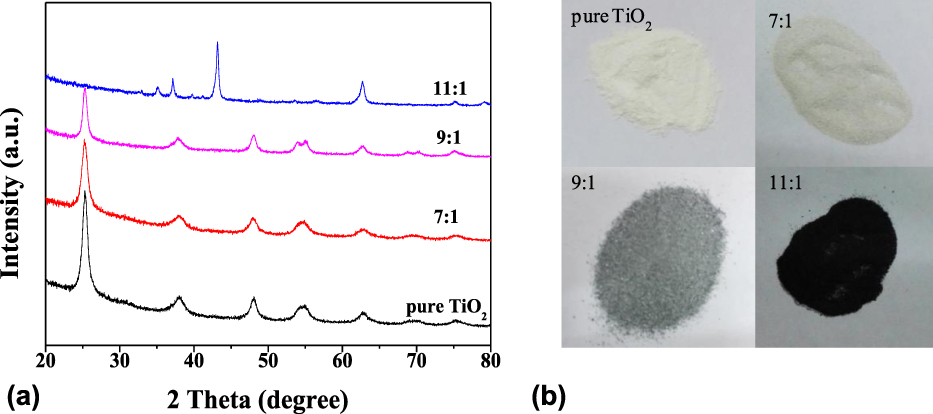
Figure 2(a) represents the XRD patterns of black nano-TiO2 samples with different ratios of Mg and TiO2. In Fig. 2(a), the XRD curves represent the characterization results of samples: pure TiO2 and Mg and TiO2 ratios of 7:1, 9:1, and 11:1, prepared at the calcining temperature of 500 °C. The crystal phase composition of three samples was anatase TiO2 except the sample 11:1, according to Joint Committee on Powder Diffraction Standards (JCPDS) card no. 21-1272, with no other crystalline impurities detected. The characteristic peaks of nano-TiO2 crystals synthesized by the sol–gel method were sharp, suggesting high crystallinity. When the ratios of TiO2 and Mg increase to 11:1, the TiO2 is completely reduced because of excessive reductant, resulting in a lower valence titanium oxide (Ti2O3). Figure 2(b) shows corresponding samples. It can be seen from Fig. 2(b) that the color of TiO2 gradually deepens with increasing ratio of Mg and TiO2.
XRD curves of samples with different ratios of Mg and TiO2 (a) and the photos of the different samples (b).

As shown in Table II, the crystallite sizes of pure TiO2 and black TiO2 samples with reducing agent ratio of 7:1, 9:1, and 11:1 are 12.3, 12.5, 13.6, and 15.7 nm, respectively, based on the XRD results calculated by Scherrer equation. When the ratios of Mg and TiO2 are 7:1 and 9:1, the increase in average crystal size is not evident. The grain size of the sample with a reducing agent ratio of 11:1 is obviously larger than those of other samples, which may be attributed to excessive magnesium, for which titanium dioxide reacts dramatically with magnesium, forming the new compound Ti2O3, as shown in Fig. 2(a), so that the crystallite size of the sample increases more than others.
The crystallite sizes of samples prepared at different ratios of Mg and TiO2.

B. Raman spectroscopy
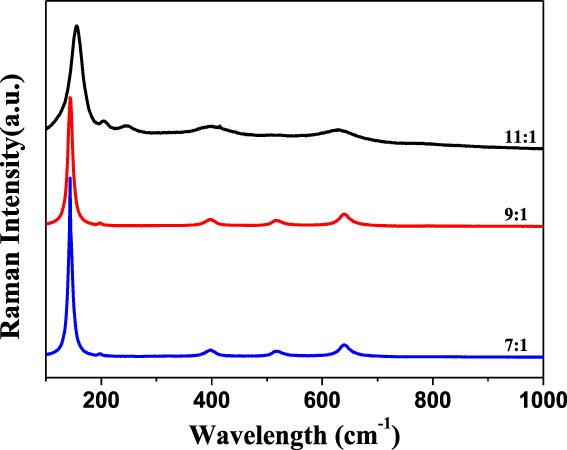
Figure 3 shows the Raman spectroscopy of the prepared black nano-TiO2 with different ratios of Mg reduction. The Raman spectrum of three curves shows characteristic Raman bands of the typical anatase TiO2 phase with the strongest E g band at around 144 cm−1. The results show that the three samples are mainly anatase TiO2. It is observed that with the increase of Mg reductant proportion, the intensity of each characteristic peak gradually decreases and the peaks tend to be broadened. Several small peaks of sample of ratio 9:1 with the most amount of Mg reductant tend to be flattened. In particular, the characteristic peak at 516 cm−1 completely disappears, indicating that the crystallinity of the sample gradually decreased. It shows that because of the addition of metal reductant, the original crystalline surface of TiO2 began to appear disorderly layer structure, and with the increasing amount of reducing agent, the disordered layer thickness increases, and the core–shell structures become more obvious.Reference Sinhamahapatra, Jeon and Yu46 As reported in the previous studies, the shift and broadening of the peaks of TiO2 were ascribed to the crystal domain size and nonstoichiometry.Reference Wang, Yang, Lin and Yin38,Reference Sinhamahapatra, Jeon and Yu46
Raman curves of white and black nano-TiO2 samples.

C. TEM analysis
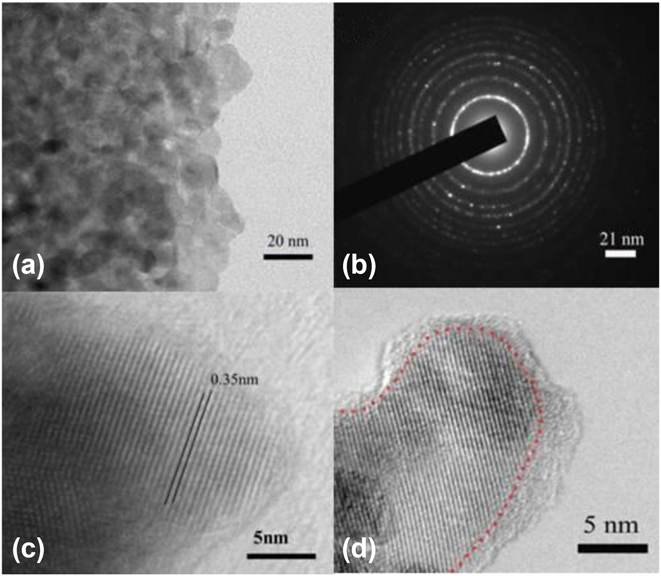
Figure 4 is the test results of TEM and high resolution transmission electron microscopy (HRTEM) of the black nano-TiO2 sample at the calcining temperature of 500 °C with Mg and TiO2 ratio of 9:1. Figure 4(a) reflects the aggregation of black nano-TiO2 particles, the grain size is about 15 nm, and the particle size distribution is relatively uniform. As is seen in Fig. 4(c), the average interplanar space of the sample is 0.35 nm by measuring lattice fringes. The sample’s Debye ring has more bright spots in the picture, and the Debye ring is more obvious, indicating that the sample has higher crystallinity [Fig. 4(b)]. Figs. 4(c) and 4(d) together indicate that the sample has a good crystal structure. It can be seen from Fig. 4(d) that the reduced nanocrystal displays a unique crystalline core–disordered shell structure and the thickness of the disordered layer is about 2–3 nm. This is because after the Mg reduction reaction, a disordered layer microstructure is formed on the surface of the black nano-TiO2 particles. This is consistent with the results of Raman spectroscopy and has similar microstructure to black nano-TiO2 particles reported in other studies.Reference Chen, Liu and Huang30,Reference Sinhamahapatra, Jeon and Yu46
TEM and HRTEM images of black nano-TiO2 samples at the calcining temperature of 500 °C with the ratio of Mg and TiO2 (9:1): the aggregation TiO2 particles (a), the Debye ring image of the black nano-TiO2 (b), the average interplanar space (c), the crystalline core–disordered shell structure (d).

D. Specific surface area and pore size distribution
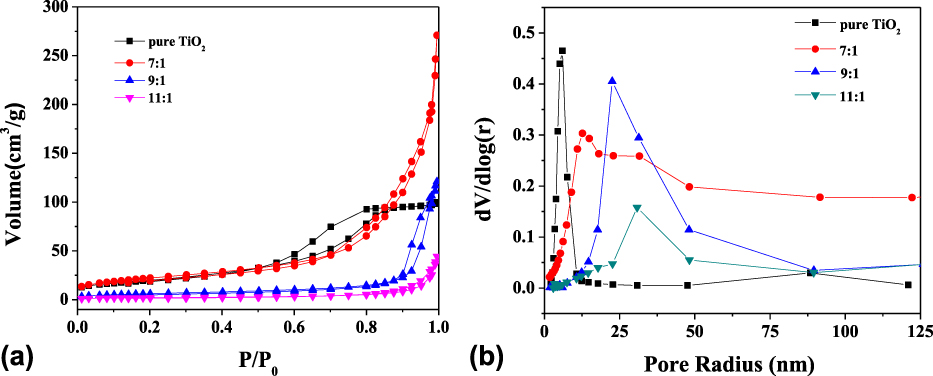
Figure 5(a) represents N2 adsorption–desorption isotherms for the as-prepared samples. It can be observed that the adsorption–desorption isotherms in the low pressure region (P/P 0 < 0.4) are coincident, which shows that there is no microporous structure (<2 nm) in the sample. In the region of medium pressure (0.4 < P/P 0 < 0.8), a hysteresis loop appeared in the pure TiO2 sample. The adsorption–desorption isotherms for the pure TiO2 showed a typical type IV behavior, indicating the formation of mesopores. For the black TiO2 samples, the hysteresis loop broadened to high pressure (P/P 0 > 0.8), indicating mesoporous–macroporous structure, which is attributed to the Mg reduction.
The N2 adsorption–desorption isotherms for different samples with the ratio of Mg and TiO2 (a), and figure of pore size distribution (b).

Specific surface areas were determined as shown in Table III. The obtained surface areas are 70.67, 38.76, 32.15, and 17.00 m2/g for pure TiO2 and the black TiO2 samples prepared with Mg and TiO2 ratios of 7:1, 9:1, and 11:1, respectively. The specific surface area of pure TiO2 is larger than those of all the black TiO2 samples. The data showed that the specific surface areas decrease obviously with increase of Mg content, indicating that this decrement is mainly due to Mg reduction. The drastic decrement of the specific surface areas for 11:1 can be attributed to the increase of crystallite size, for which there is excessive Mg in the reduction reaction and the Ti2O3 was formed as shown in XRD results.
The specific surface areas of different samples.

Figure 5(b) shows pore size distribution for different samples with Mg and TiO2 ratios of 7:1, 9:1, and 11:1. The data showed that the pore size increases obviously with increase of Mg content. The average mesopore sizes of the samples estimated using the Barrett–Joyner–Halenda (BJH) approach from the desorption branch are 6.4, 18.5, 30.7, 35.1 nm for the pure TiO2, the samples with different ratios (7:1, 9:1, and 11:1), respectively. From the crystallite size of the samples as discussed in the XRD results, the pores were probably formed by the agglomeration and connection of adjacent nanoparticles in the sample, which were seen in the TEM results [Fig. 4(a)].
E. PL emission spectra
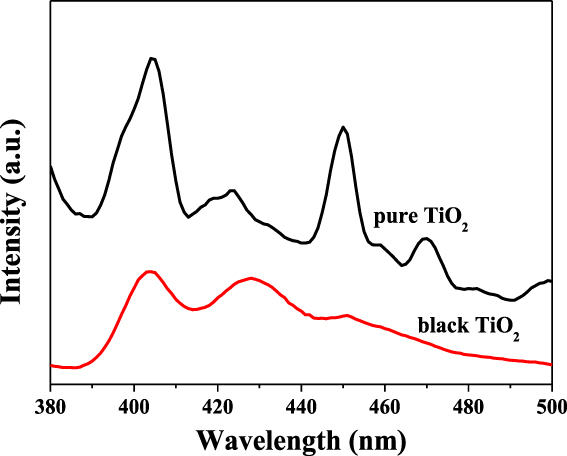
The PL emission spectra are effective to track the behavior of light-generated electrons and holes in the samples because PL emission results from the recombination of free carriers. The PL spectra of pure TiO2 and the Mg-reduced black TiO2 samples are shown in Fig. 6. The shapes of the emission spectra of two samples are similar profiles. Four main emission peaks are observed at 402 nm (3.12 eV), 426 nm (2.88 eV), 450 nm (2.75 eV), and 472 nm (2.65 eV), respectively. The first one is attributed to the emission of band gap transition of anatase TiO2. The peaks at 450 and 472 nm are attributed to the free excitons at the band edge. Moreover, several small PL peaks observed in the wavelength range are mainly due to the surface defects of the TiO2 samples. Compared with pure nano TiO2, the peak intensity of black nano-TiO2 is weaker. The intensity of the PL line is related to light-generated electrons and holes recombination. This shows that the black nano-TiO2 has a relatively low light-generated electrons and holes recombination rate, which benefits enhancement of the photocatalytic activity.
Photoluminescent spectra of pure TiO2 and the black TiO2 sample calcined at the temperature of 500 °C with the ratio of Mg and TiO2 (9:1).

F. UV-vis diffuse reflectance spectra
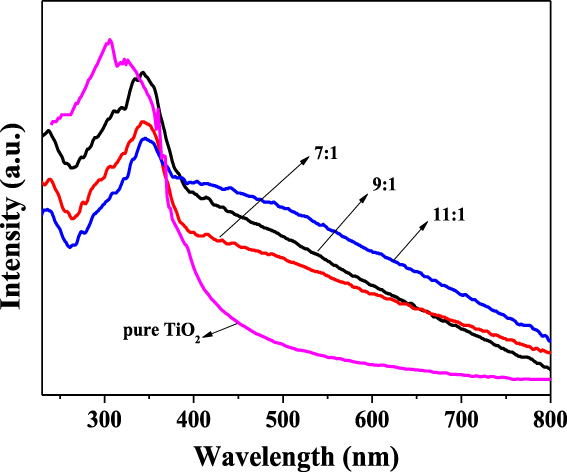
Figure 7 shows the UV-vis diffuse reflectance curves of pure nano-TiO2 and black nano-TiO2 samples. The UV-vis curve is used to analyze the light intensity response of the different samples. It can be seen from the figure that all the TiO2 samples have strong absorption in the UV region of 200–400 nm with little differences, indicating that the modified black nano-TiO2 sample basically remains unchanged in response to UV light. The absorption edge of pure TiO2 is about 410 nm. Compared with the pure TiO2, the absorption edges (about 440, 460, and 510 nm, respectively) of the black TiO2 samples (7:1, 9:1, and 11:1) shift into visible region, and their light absorption in the visible region obviously intensifies. In the visible region of 400–800 nm, the absorption intensity of all samples showed a decreasing trend, but the degree of decline is different. The curve of white nano-TiO2 sample drops sharply at 390 nm, and the absorption intensity in the visible region is almost invisible. In contrast, the light absorption intensity in the visible region of black nano-TiO2 samples is relatively stronger, and with the increase of the ratio of Mg and TiO2, the light absorption intensity increases. This shows that as the amount of reducing agent increases, the sample color deepens and the visible light absorption intensity increases. As shown in other reports, the surface disorder layer is one of the reasons for the darkening of nano-TiO2.Reference Zhang, Hu, Zhang, Wang, Sun, Li, Qiao, Wang and Zhou23,Reference Sinhamahapatra, Jeon and Yu46,Reference Wang, Fu, Yin, Wu, Guo, Xu and Zhong49
UV-vis diffuse reflectance spectra of normal nano-TiO2 and black nano-TiO2 samples.

G. Photocatalytic hydrogen generation
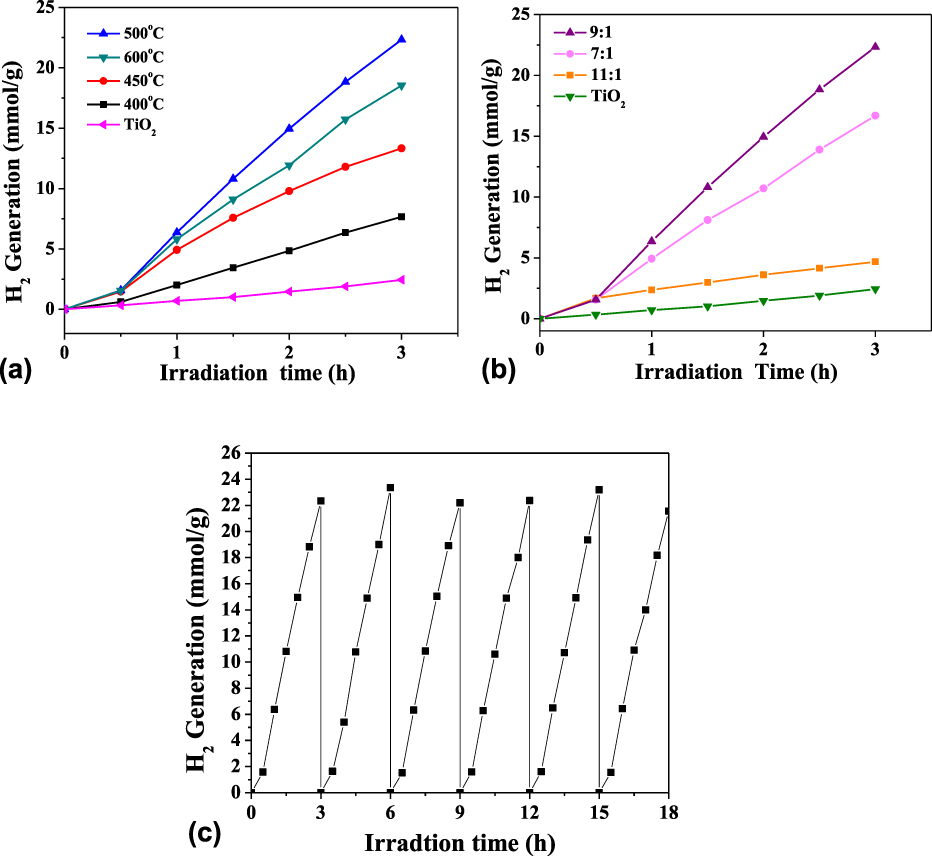
The photocatalytic hydrogen generation from water under the full solar wavelength light irradiation was used to evaluate the photocatalytic activity of black nano-TiO2 samples. Pt (1 wt%) was used as a cocatalyst by a UV-vis light–induced reduction procedure. Hydrogen production profile under the full solar wavelength range of light for samples in different calcining temperatures is shown in Fig. 8(a). After 3 h, the H2 production rate of pure TiO2 (prepared by sol–gel method) is about 0.81 mmol/(h g). It is obvious in Fig. 8(a) that the photocatalytic activity of the black nano-TiO2 has been improved with the Mg reduction temperature. The 500 °C Mg–reduced black TiO2 sample steadily produced hydrogen gas at about 7.44 mmol/(h g). Compared with pure TiO2, the rates of hydrogen generation for the black TiO2 samples have been enhanced obviously. The sample below 500 °C is still an anatase crystal, and the crystallinity becomes higher as the temperature rises, so the photocatalytic rate will increase when the calcining temperature rises.Reference Green, Xu, Liu, Zhao, Li, Liu, Qin, Zhu, Shen and Chen50,Reference Xia, Zhang, Oyler and Chen51 However, for the 600 °C Mg–reduced black TiO2 sample, the rate of hydrogen generation is lower than that of 500 °C Mg–reduced black TiO2 sample, which may be attributed to the phase transform and increase of crystal size for the 600 °C Mg–reduced black TiO2 sample, as shown in above discussion.Reference Riaz, Qi, Fang, Xu, Zhou, Jin, Hong, Zhi and Liu52,Reference Yan, Chen, Zou and Wang53 These results have illustrated that within 400–500 °C, increasing calcining temperature can enhance the photocatalytic activity of hydrogen generation.
The black TiO2 photocatalytic water splitting for hydrogen generation under the full solar wavelength range of light at different calcining temperatures (a), with different ratios of Mg and TiO2 (b), and recycling measure of hydrogen generation through photocatalytic water splitting with black TiO2 (500 °C, 9:1) under the full-spectrum solar light source (c).

The continuous hydrogen production profile and the rate of hydrogen production under the full solar wavelength range of light for different samples in different magnesium and TiO2 ratios are shown in Fig. 8(b). Compared with white TiO2, the rates of hydrogen production for the black TiO2 samples have been enhanced significantly. The hydrogen generation rate increases as the ratio of Mg and titanium dioxide increases to 9:1. However, the hydrogen generation rate starts to decrease at the ratio of 11:1 although it is observed that with the increase of the Mg amount, the sample turns darker and the absorption of visible light also increases. This result can be ascribed to the generation of new recombination sites because of over-reduction in the presence of a high amount of Mg. Because of its excellent photocatalytic activity, the stability of the sample (9:1) as a photocatalyst was further studied for hydrogen production under full solar light. As shown in Fig. 8(c), the recycle experiments reveal that the sample does not exhibit evident decline of photocatalytic activity for H2 generation after 6 photocatalytic cycles. The cycling tests reveal that the black TiO2 sample was very stable in 6 photocatalytic cycles.
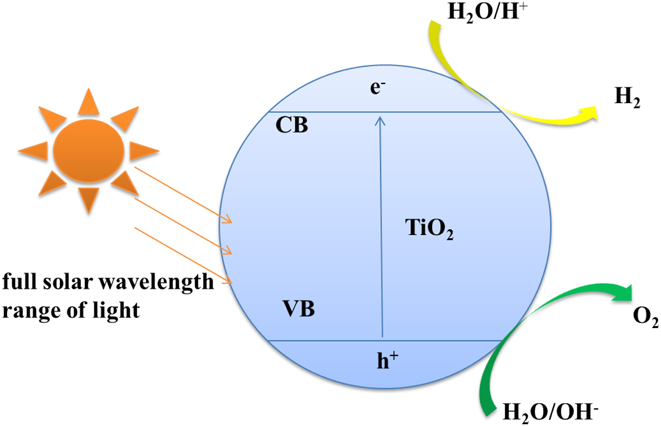
As shown in Fig. 9, the light is radiated on the semiconductor. When the energy of the radiation is greater than or equal to the forbidden band width of the semiconductor, the electrons in the semiconductor are excited to transition from the valence band to the conduction band. The holes remain in the valence band, separating the electrons and holes, and then reducing the water to hydrogen or oxidizing the water to oxygen at different locations in the semiconductor. The water splitting reaction comprises two half reactions, the H2-evolution reaction [Eq. (1)] and O2-evolution reaction [Eq. (2)]. The standard redox potential ΔE 0 of the multielectron water splitting (WS) is given in the equation.
 $$2{{\rm{H}}^ + } + 2{{\rm{e}}^ - } \to {{\rm{H}}_2}\left( {\rm{g}} \right)\quad \Delta {E^0} = - 0.41\;{\rm{V}}\quad ,$$
 $$2{{\rm{H}}_2}{\rm{O}}\left( {\rm{l}} \right) \to {{\rm{O}}_2}\left( {\rm{g}} \right) + 4{{\rm{H}}^ + } + 4{{\rm{e}}^ - }\quad \Delta {E^0} = + 0.82\;{\rm{V}}\quad .$$
Schematic diagram of the black TiO2 photocatalytic water splitting for hydrogen generation.

For water to be decomposed into hydrogen and oxygen, the bottoms of the conduction band must be located at a more negative potential than the reduction potential of H+ to H2 (−0.41 V, at pH 7), whereas the top of the valence band must exceed the oxidation potential of H2O to O2 (0.82 V).Reference Li, Yu, Low, Fang, Xiao and Chen26 Thus, the minimum band gap energy of the photocatalyst should be 1.23 eV to convert the energy into H2 and O2.Reference Li, Yu, Low, Fang, Xiao and Chen26 For the black TiO2 samples, the valence band maximum energy blue-shifts toward visible region. Combined with the results from UV-vis diffuse reflectance spectra suggests a narrowed band gap, which is due to the Mg reduction. This is the reason that the black samples can be used as efficient photocatalysts to decompose water under the full solar wavelength range of light.
IV. CONCLUSIONS
The black TiO2 samples with a crystalline core–disordered shell structure were prepared by a sol–gel method combined with Mg reduction of different ratios of Mg and TiO2 at different temperatures. The disordered layers are well controlled by reduction conditions and are responsible for enhanced wide-spectrum light absorption and photocatalysis. It is concluded that the calcining temperature and the ratio of Mg and TiO2 are the key factors that affect the microstructure and light absorption properties of the samples. Under the full solar wavelength range of light, the reduced black TiO2 samples exhibit greater photocatalytic hydrogen production ability than white nano-TiO2, and the sample prepared with the ratio of 9:1 of Mg and TiO2 calcined at 500 °C has the maximum hydrogen production rate.
ACKNOWLEDGMENTS
Science and Technology Guidance Project of China National Textile and Apparel Council (No. 2016040).