

We owe to Philip Jenkins the evocative image of a shift in the ‘centre of gravity’ of global Christianity from North to South,Footnote 2 a metaphor that has resonated with many who have thought about the contemporary history of the Anglican CommunionFootnote 3 and its recent challenges.Footnote 4 This paper considers an emerging debate about the extent of Anglican growth in sub-Saharan Africa, and analyses four multi-country, nationally representative surveys not previously considered in the debate. I consider what conclusions this data will permit us to draw, looking at five countries with proportionately sizeable Anglican populations: Kenya, Nigeria, South Africa, Tanzania and Uganda.
The purpose of this paper is straightforward, and in certain key respects, largely technical. On the basis of the best available survey data, using nationally representative samples, I establish statistically sound estimates of the population that identifies as Anglican (when they are asked by an interviewer) in each of the five countries. This involves two different kinds of estimate. First, I provide parameter estimates of the proportion and number of Anglican-identified in each of these countries; these are estimates in which we can have a high degree of confidence. In other words, I will establish the range within which we can be as certain as available statistics allow, about the true proportion (and population size) of those who identify as Anglicans in each of the five countries. Second, using the same data, I will provide point estimates for the proportion and number of Anglicans that are most likely on the basis of this data. A point estimate provides not a range, but a figure that is the best statistical estimate we can make about how many identify as Anglicans in each of the five countries using the data at hand.
The most important findings, and those likely to be most controversial, are as follows. First, the number of those who claim Anglican identities in Nigeria in 2015 is highly unlikely to be any more than 12 million, and the best (point) estimate is that about 7.4 million identify as Anglicans in Nigeria. This means that it comes second to the Church of Uganda in the rank ordering of provinces in terms of the size of population identifying with the Church. The statistical estimate of the number of those with Anglican identities in Uganda provided here, by contrast, is considerably larger than the population of the church that is usually reported: the best statistical estimate is that about 10.9 million Ugandans identify as Anglican in 2015. While it is clear that the Anglican population of Uganda is growing, there is also very good evidence that the percentage of Ugandans who identify as Anglicans is in decline. In developing this later point, I examine the three most recent enumerations of the Ugandan National Census of Population and Housing. While the Census offers a more optimistic picture than do the nationally representative survey data, it nevertheless also gives a clear indication of proportional decline. By considering both data sources, I show how the evidence suggests that the decline stems from the church losing ground in relative terms to Pentecostal and Charismatic Churches, and further that the evidence is consistent with inter-generational change.
Background and Debate: How Many Anglicans in the Provinces of Sub-Saharan Africa?
It has been commonplace to contrast the decline in Anglican Churches of the Global North (in particular, England, the USA and Canada) with the growth of some Global South Anglican provinces; the Church of Nigeria, the Church of Uganda and the Anglican Church of Kenya are often used as exemplars of dramatic church growth. For example, the former primate of the Church of Uganda, Archbishop Henry Luke Orombi, combined the assertion of numerical growth with spiritual health and postcolonial critique. He asserted that: ‘The younger churches of Anglican Christianity will shape what it means to be Anglican. The long season of British hegemony is over.’Footnote 5
In a controversial article published in this journal, Daniel Muñoz has used a range of available church statistics from provincial, diocesan and parish sources, as well as employing less orthodox methods, such as counting people in parish photographs, to challenge the now often taken for granted assumptions about the changing global centre of gravity in the Anglican Communion.Footnote 6 Based on available information (which requires considerable extrapolation to approximate missing data and to correct what is obtainable) he argues that the contrast within the Communion between the secularizing North and spiritually/numerically vibrant South is much less striking than both scholars and church leaders have come to assume. Muñoz accepts official church figures for adherents in the Church of Nigeria of 18 million at the time of his research (sociologists of religion would prefer to describe these as those who ‘identify’ with a religious tradition, but the sense is largely the same). On the other hand, Muñoz argues that the proportion of ‘active participants’ is like that of the Church of England, with an ‘inner circle’ of around 6.3 per cent of those with Anglican identities. Muñoz arrives at this conclusion by extrapolating from the publicly available data for the diocese of Jos, and the size of parish participation from parish photographs. Using these methods, Muñoz estimates that the committed participants in the Church of Nigeria amount to 1,136,286 people. Of course, one would have numerous reasons for thinking that the diocese of Jos might not be typical of other dioceses, as well as for why congregational photos might have serious limits for estimating congregation size.
Likewise, looking at Kenya, Muñoz argues that there is an ‘outer circle’ of those with Anglican affiliation or identity of about 3.3 million. As the Anglican Church of Kenya had two different official figures, he took an average of the two. Then, using similar methods to those used for calculating the ‘inner circle’ of the Anglican Church of Nigeria, he suggests an active membership of about 388,000 active Anglicans, or about 12 per cent of the outer circle of membership.Footnote 7 Despite some significant weaknesses and limitations of his methods, Muñoz has made a serious attempt to calculate in a systematic fashion the population of Anglicans in parts of the world where this is a challenging undertaking. While some of his methodology and working assumptions are open to question, he is to be commended for having made them openly; by making his methodology explicit he allows for them to be challenged, informing an ongoing scholarly debate.
Others have made different assessments of the numerical vitality of Anglican churches in sub-Saharan Africa. With reference to the conclusions of Muñoz’s study, David Goodhew argues in the introduction to Growth and Decline in the Anglican Communion: 1980 to the Present (2017), ‘a wide range of researchers, including the team behind this volume, offer substantial evidence to the contrary’.Footnote 8 Contributors to that volume consider evidence for growth and decline in 12 of the Communion’s 38 provinces; three chapters in Goodhew’s volume are particularly relevant here, as they deal with several of the larger provinces in sub-Saharan Africa (and that are included in the analysis presented here).
Richard Burgess offers a knowledgeable and often insightful history of the Church of Nigeria in a time of numerical growth. What stands out for a social scientist are the assumptions that the Church has continued to grow in proportional terms in recent decades, and that this growth is the product of the Church’s evangelistic efforts. He thus makes no attempt to estimate the population of those who identify as Anglicans in Nigeria, who participate in the life of its churches, nor to engage with even the most basic demographic considerations that might permit a scholarly assessment of growth itself taking into account its relationship to the growth of the population as a whole. No one would dispute that the Church is much more populous in 2015 than it was in 1980. But, so also is the country as a whole; Nigeria has grown, according to the best estimates, from 71 million to over 180 million in this time period.
Joseph Galgalo’s contribution to Goodhew’s volumeFootnote 9 is a careful examination of available figures for another of the Anglican success stories in sub-Saharan Africa and, as such, has much more to say by means of direct response to Muñoz’s challenge. Galgalo provides a judicious assessment of the estimates of the Anglican population of Kenya, taking issue with the figures in the Church of Kenya’s official provincial survey of 2009, as well as with the diocesan counts of the faithful; these latter figures would themselves suggest a Church in rather steep decline as a proportion of the total population. Galgalo argues that the Church’s recent, un-evidenced claims of 5 million members is in fact closer to the mark than are any of its actual counts; he estimates a membership of between 4 and 4.5 million in the Anglican Church of Kenya. If we accept his contention that earlier statistics are much more reliable than more recent ones (which does seem reasonable), there were somewhere in the neighbourhood of 742,300 Anglicans in Kenya in 1970; this would amount to a rate of Church growth substantially greater than the rate of growth of the population as a whole.
Some of Galgalo’s working assumptions leave room for further consideration of the Kenyan case. For example, the assumption that participation at cathedrals is a good indicator of participation for the rest of the diocese, calls for further consideration.Footnote 10 Evidence from the Church of England, though it is admittedly a very different context, should make us somewhat cautious about assuming a strong correlation between the health of the diocese and that of its cathedral.Footnote 11 Likewise, one might have concerns about producing a reliable indication of the number of Anglicans from figures for Protestants in the national Census when it cannot be disaggregated; the Census does not record the details of denominational affiliation, which makes such an estimate subject to a great deal of guesswork.
Finally, Growth and Decline includes Barbara Bompani’s judicious assessment of the demographics of Anglicans in South Africa, the largest part of the Province of Southern Africa.Footnote 12 The South African Census provided a question on religion that included denominational affiliation until the 2001 Census, allowing those who identify as Anglicans to be counted with relative precision up to that point. Nevertheless, Bompani shows evidence of a significant drop out, particularly among white South Africans. She surmises that, following a drop as a proportion of the population, Anglican identification has likely stabilized at somewhere around 3 or 4 per cent of the population of South Africa.
Even if Muñoz’s estimates of active participation do seem rather low, he has opened up an important line of inquiry and debate where assumptions and assertions previously stood. There is no question that the Anglican churches in Africa have grown dramatically over the past 60 or 80 years – particularly in the period of decolonization, where they gained in proportionate as well as absolute terms. However, we do need to ask whether more recently Anglican churches might have been riding a demographic wave, growing as the population does, but not converting a greater proportion of the population. Figures from the World Christian Database suggest that the growth of Christianity has levelled off and stabilized in proportional terms relative to Muslims and Traditional Worshippers (on average) across sub-Saharan Africa.Footnote 13 Where one stream or tradition of Christianity is growing as a proportion of the population, therefore, it is mostly at the expense of other Churches, rather than because of successful evangelistic efforts among Muslims, traditional worshippers, or the small fraction of the population with no religious identification at all.Footnote 14
The challenges of collecting good quality social and demographic data in sub-Saharan Africa are manifold, and that challenge has not often been well met, particularly because of poor infrastructure, rapid population growth and the limited resources available (or made available), for careful and systematic counting. This is by no means a challenge reserved for scholars interested in religious demography, but plagues even attempts by states, international organizations and non-governmental organizations across the region to gather even the most basic social and economic statistics, such as population, exports, imports, unemployment, GDP, or even a reasonably accurate count of the total population.Footnote 15 Churches are not exempt from these challenges, as Galgalo has demonstrated in the case of Kenya.Footnote 16 Inadequate, inaccurate or misleading figures do not necessarily betray an attempt to mislead. Church leaders have many competing demands on their time, efforts and resources; careful counting of their flocks does not often seem to be the most pressing of their concerns, and often one suspects that these have begun as rough estimates which are subsequently compounded. Where such membership and attendance accounting is attended to, the figures will certainly contribute to the overall picture, though they typically will be asking a somewhat different question than the one addressed in this article.Footnote 17 They will be more concerned with commitment and participation; here we are asking about how many identify as Anglican. That is not exactly the same thing, though generally we would expect figures for identification to be the upper limit of those for participation.
A well-conducted national census is generally the gold standard as a source of data for demographic analysis, particularly where one is interested in relatively uncommon characteristics in a population. In a census, the government attempts, more or less successfully, to ask a set of questions of every household about every member of the population.Footnote 18 A census is an enormously expensive enterprise; in many parts of sub-Saharan Africa there can be substantial gaps between censuses for financial and political reasons. Where there have been recent censuses, enumerating religious groups has not often been a priority (as in South Africa since 2001); other states have had concerns about the potential impact of results on tensions between roughly equal numbers of Christians and Muslims (e.g. Nigeria). The National Population and Household Census of Uganda is a notable exception, even if it is by no means straightforward to interpret its results. High quality, professional surveys drawn from nationally representative samples are the next best source of the same kind of data.
Data and Methods
Four nationally representative surveys of sub-Saharan Africa have included questions on denominational affiliation across a range of countries of interest, and the data they contain can be used to inform this debate. These are rounds four to six of the Afrobarometer survey programme (2008, 2010–11 and 2016), and the Pew Forum on Religion and Public Life’s Islam and Christianity in Sub-Saharan Africa survey (2008). Although the Afrobarometer and the Pew Forum survey have been produced to high professional methodological specifications, they are national-scale sample sizes (though large ones in the case of most of the Afrobarometer surveys); this poses challenges for using them to describe the prevalence of less common characteristics in a population. Because, with the exception of Uganda, Anglicans are – in proportional terms – a relatively small minority across much of sub-Saharan Africa, this imposes limits on our ability to make population estimates. This is the major reason for limiting our consideration here to those countries with proportionately substantial numbers of Anglicans: Kenya, Nigeria, Tanzania, Uganda and South Africa.
The Afrobarometer survey programme is coordinated by three core partners, Michigan State University, the Institute for Democracy in South Africa, and the Center for Democratic Development in Ghana, and has now conducted six rounds of a multi-country survey of African nations, beginning in 1999–2001, with a seventh currently under way. In each round, a nationally representative sample of the population is taken for each of the countries included. The sample is a multi-stage stratified cluster sample with randomized selection at each stage. Each round is independent of those that have been taken in previous rounds, having been produced from a new sampling frame.Footnote 19 From Round 4, the surveys contain useable denominational-level data; only non-institutionalized persons over the age of 18 are included. The Pew Forum on Religion and Public Life’s project on Islam and Christianity in Sub-Saharan Africa conducted nationally representative surveys across sub-Saharan Africa with a view to examining relations between Muslims and Christians across the region. In each of the five national surveys considered here, they conducted face-to-face surveys with non-institutionalized respondents over the age of 18 selected by means of a stratified random sample.
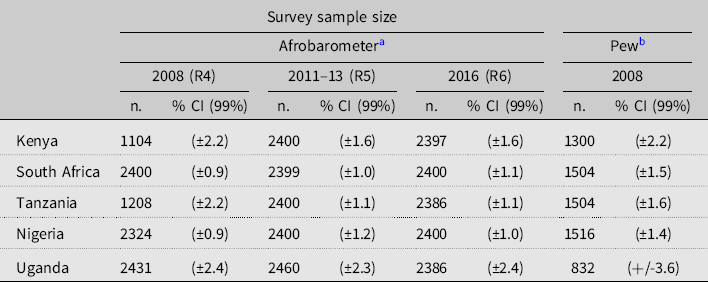
The individual sample sizes and confidence intervals are reported in the Appendix. The confidence intervals presented have been calculated for the proportion of Anglican-identifiedFootnote 20 as is required in the estimation of confidence intervals,Footnote 21 and indicate the 99 per cent confidence level. To the extent that a sample is selected randomly (defined as every unit of a population having an equal chance of inclusion), we can say that it provides a ‘representative’ sample for a survey. The sample surveyed will provide a microcosm of the larger universe being sampled, though it will not match the population it describes exactly. Because of this we use confidence intervals, which give us an indication of how likely our sample is to deviate from the true value (the one that we would achieve using a perfectly conducted census). Because this error is predictable, we may not know how right exactly we are, but we know our chances of being wrong, and by how much.Footnote 22 Confidence intervals only indicate the deviation from the true value that occurs due to random error – in this case, we can be 99 per cent sure that the true value lies within the range plus or minus the confidence interval. Non-random distortions also have an impact on both probability samples and censuses, despite researchers’ best intentions; this is the most likely reason for the variation between the samples in their estimates of the number of Anglicans. As a consequence, we have adopted a very conservative approach to estimating the total population of Anglican-identified individuals as presented in the results section below: in making parameter estimates, we have prioritized confidence over precision, meaning that we can be relatively sure of our parameter estimates, but they do constitute a rather large range.
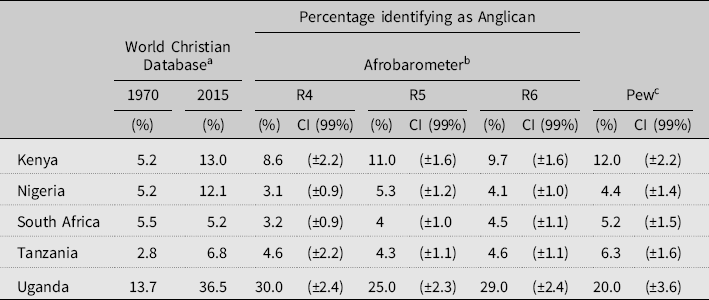
Note that the data under consideration cannot address the question of membership (however defined), nor will we consider the participation (for example, reported attendance at Anglican services) of those who identify as Anglican. Table 1 presents the proportion of those who identify themselves as Anglican; this could be seen as parallel to the ‘outer circle of membership’ in Muñoz’s study, though we prefer the more standard term of ‘religious identification’. The questions are asked in a slightly different fashion in the Afrobarometer surveys and in the Pew Forum Survey. The Afrobarometer survey instrument instructs the interviewer to ask ‘What is your religion, if any?’ and to code from a list. The Pew Forum survey by contrast uses a two-step process, whereby, respondents are asked ‘What is your present religion, if any?’; those who answer that they are Christian, are then asked what ‘denomination or church, if any, [they] identify with most closely’. The survey instrument was originally designed to collect secondary identifications as well, but very few respondents provided secondary identifications; this question was dropped across all of the national surveys due to concerns about analytic viability and respondents’ confidentiality.
Proportion of Anglicans in five countries (with confidence intervals for representative surveys)

a Figures as reported in Ross et al., Christianity in Sub-Saharan Africa.
b Publicly available machine readable data files. See http://www.afrobarometer.org/data (downloaded 22 March 2018).
c Publicly available machine readable data files for the Pew Forum on Religion and Public Life Report, Tolerance and Tension, http://www.pewforum.org/datasets/
The figures in the World Christian Database (WCD) have become something of an industry standard in studies of World Christianity, and are presented for comparative purposes. WCD figures have often been criticized,Footnote 23 but there is also evidence to suggest that they are often true in the broadest brush-strokes. Thus, some research has shown the Database to be broadly consistent with sound data sources, particularly on the proportions of major religious traditions in many countries; in the USA it provides relatively accurate estimates of levels of denominational affiliation.Footnote 24 What is important to remember is that WCD figures are educated estimates, generally made without making explicit the evidence and assumptions from which particular estimates derive. Often the compilers have clearly been reliant on the figures provided by the churches in question themselves.Footnote 25
Recent estimates of the number of Anglicans in Uganda, including those of WCD and the Church of Uganda itself, seem to rely on the National Population and Housing Census of Uganda for 2002. Below we will consider three different Census enumerations, 1991, 2002 and the most recent Census of 2014. This information is necessary both because there is a clear discrepancy between the survey results and the national censuses, which needs to be explained, but also because the Census allows us to gain some purchase on the trajectory of the proportion of Ugandans identifying as Anglican.Footnote 26
There are important methodological differences to be noted. In the Census of Population and Households, the enumerator does not ask individuals to identify their own religious affiliation. Rather, one person responds on behalf of all members of the household (presumably, more often than not, the ‘head of the household’ as they are identified by the Uganda Bureau of Statistics). This contrasts further with the approach adopted by the surveys examined here, which only include individuals 18 years of age or older; the Census includes everyone, even very young children.
Anglicans as a Proportion of the Population: Survey Results
Table 1 reports on the percentage of Anglicans in each of the five nations under consideration here, in each of the four surveys (plus the WCD estimates). Because of the limits of accuracy entailed, the small number of data points, and the typically long time-scale of aggregate religious change, we cannot use the different rounds of the Afrobarometer survey to show change over time. The data presented in Table 2 provides the basis for our subsequent calculation of parameter and point estimates for the number of Anglicans in each country (in Tables 3 and 4 below).
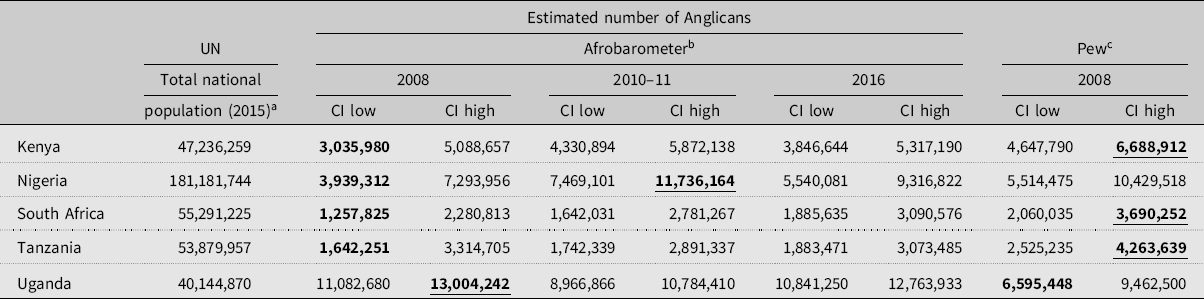
Total population by country; with lower and upper confidence interval limits (99%) of those with Anglican identities by country

Note: Lowermost limit estimate in bold; uppermost limit estimate underlined.
a United Nations, Department of Economic and Social Affairs, Population Division, ‘World Population Prospects: The 2017 Revision’.
b ‘Afrobarometer’ publicly available machine readable data files.
c ‘Tolerance and Tension’ publicly available machine readable data files.
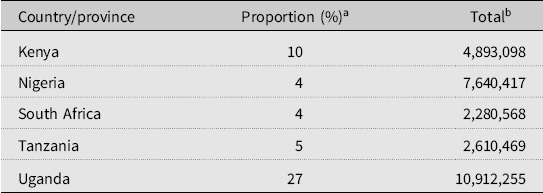
Most likely proportion and number of Anglican-identified by country

a Weighted average of the proportion of Anglicans in the four surveys.
b Calculated by multiplying the proportion of Anglicans by the UN population total for 2015.
Uganda Population and Housing Census Distribution of Population by Religious Beliefs

a Percentages do not total 100% because of rounding.
Sources: Uganda Bureau of Statistics (2016), The National Population and Housing Census 2014 – Main Report, Kampala, Uganda, p. 19; Uganda Bureau of Statistics (2006), The National Population and Housing Census 2002 – Population Composition, Kampala, Uganda, p. 27.
Looking first at the data from South Africa, we find that the three Afrobarometer surveys and the Pew Forum survey all yield comparable figures for the proportion of Anglicans. The figures range between 3.2 per cent (±0.9 per cent at 99 per cent confidence) for the Afrobarometer survey in 2008 and 5.2 per cent for the Pew Forum survey (±1.5 per cent), also conducted in the same year; the high and low figures differ minimally and the confidence intervals at 99 per cent overlap with one another.
What all of these figures provide is a consistent approximation of the proportion of Anglicans in South Africa. They confirm the reasonableness of the World Christian Database estimate, and they are in line with what we might expect given the most recent, the South African Census, that included a question about denominational affiliation (2001) where the total proportion of Anglicans amounted to 4.8 per cent of the population. There may have been some decline since that Census (particularly among white South Africans), as Bompani suggests, but the findings here confirm her assessment that the changes are unlikely to have been dramatic. None of this is surprising, and conforms to what we know of the Province of the Church in Southern Africa, and its place in South Africa. While Anglicans have been influential in recent South Africa, they are also a minor denomination within that society.
Turning to Tanzania, all the sources of data likewise report consistent results in terms of the proportion of Anglicans. The World Christian Database estimates growth from 2.8 per cent of the population to 6.8 per cent of the population from 1970 to 2015. While all three Afrobarometer results and the Pew Forum survey show a smaller proportion of Anglicans relative to the overall population than does the World Christian Database figures for 2015, the numbers are relatively close. In Afrobarometer surveys R4 and R6, Anglicans account for 4.6 per cent (±1.6 for R4 and ±1.1 per cent for R6) of the population. Afrobarometer R5 has a marginally lower proportion of Anglicans 4.3 per cent (±1.1 per cent) in the sample. In the Pew Forum sample, Anglicans account for 6.3 per cent (±1.6), just half a per cent lower than the World Christian Database estimate. While the 99 per cent confidence intervals for the surveys with the lowest (Afrobarometer R5) and the highest (Pew Forum) proportion of Anglicans do not overlap, the gap between them is very small. The confidence intervals for the proportion of Anglican respondents in all of the other combinations of samples do overlap with one another. All available sources of data provide a relatively similar picture of the proportion of Anglicans in Tanzania with Anglican identities.
Figures for the proportion of Anglicans in Kenya presented in Table 1 show minor divergence between the different samples. The World Christian Database estimates dramatic growth between 1970 and 2015, doubling in proportional terms from 5.2 per cent to 13 per cent of the population. The four recent surveys considered here all contain a somewhat smaller proportion of Anglicans relative to the recent WCD estimates. Only the 2008 Pew Forum sample contains the WCD estimate of the proportion of Anglicans within its 99 per cent confidence interval. None of the Afrobarometer samples do. Although all of the surveys contain a lower proportion of Anglicans, the difference is not dramatic either: Afrobarometer R4 has 8.6 per cent (±2.2 per cent), R5 has 10.8 per cent (±1.6 per cent), and R6 has 9.7 per cent Anglicans (±1.6 per cent). The WCD estimate may be inflated, but in view of the data presented here, it seems unlikely to be grossly off the mark either.
Turning to the figures for Uganda, we find somewhat more surprising results. The first thing to note is that the World Christian Database figure for 2015 cleaves very close to the proportion of Anglicans enumerated by the National Population and Household Census of 2002, which reported that those with Anglican identities account for 36.7 per cent of the Ugandan population; the most recent (2014) Census, released in 2016 puts the figure at 32 per cent.Footnote 27
None of the surveys contain the WCD estimate within its 99 per cent confidence indicator. One of the Afrobarometer samples contains the 2014 Census result (32 per cent Church of Uganda) within its 99 per cent confidence intervals, however (Afrobarometer R4, 30 per cent, ±2.4 per cent); one is close to the cut-off (R6, 29.5 per cent, ±2.4 per cent). Afrobarometer R5, and the Pew Forum samples contain far lower proportions of Anglicans, and do not contain the 2014 Census proportion of Anglicans within their 99 per cent confidence threshold; R5 found 24.6 per cent self-reported Anglicans (±2.3 per cent), and the Pew Forum survey has 19.5 per cent Anglicans (±3.5 per cent). Since the representative samples are all consistent in reporting fewer Anglicans than does the Census, this difference will need to be explained. It should be noted that the point estimate, provided below for 2015 comes very close to the Ugandan Census figure for 2014; I will address this in a separate section below that addresses what can be learned from the Ugandan Censuses.
Relative to any of the other cases we have considered here, WCD estimates differ most dramatically from any of the four surveys in terms of the proportion of Anglicans in Nigeria. The WCD estimates a dramatic proportional increase in Anglicans in the 45 years leading up to 2015, from 5.2 per cent to 12.1 per cent. The highest proportion of Anglicans on any of the surveys is found in the R5 Afrobarometer survey, where Anglicans comprise 5.3 per cent of a nationally representative sample (with a 99 per cent confidence interval of ±1.2 per cent). The previous Afrobarometer survey (R4), has the lowest proportion of Anglicans, with 3.1 per cent (and a 99 per cent confidence interval of 0.9 per cent). Thus, while the confidence intervals of the surveys with the lowest and the highest proportion of Anglicans do not overlap, the gap between them is again quite narrow.
All of the surveys report a much smaller proportion of Anglicans than appears in the WCD figures. The WCD has arrived at its estimate for the proportion of Anglicans in 2015 by taking the last reported figures provided by the Church of Nigeria itself to the WCD (20 million in 2010) and extrapolating growth to 2015 (to 22 million).Footnote 28 In correspondence with the author, Todd Johnson of WCD has noted that, collectively, the churches and denominations of Nigeria claim 25 million more members than the best estimate of the Christian population would allow.Footnote 29 As the parameter estimates in the following section show, the WCD figures, based on estimates provided by the Church of Nigeria, are highly unlikely to be anywhere near the true number of Anglican identified in Nigeria.
Parameter Estimates for the Population of Anglicans in the Five Countries
Estimating the total number of Anglicans using the proportions found in representative samples entails further uncertainties, including the fact that the total population may itself be a matter of some disagreement. For the sake of consistency, I have adopted the UN population estimates for 2015 and multiplied these by the proportional estimates presented.Footnote 30 The upper and the lower limits of the ±99 per cent confidence interval have been calculated for each survey, with a view to establishing the maximum and minimum number of Anglicans in each of the five provinces.
Since there is discrepancy in the results of these surveys, and some of this may be the result of non-random error (made more likely given the difficult conditions for carrying out such research), we have adopted a very cautious approach, one that maximizes confidence in the range, though it does so at the expense of precision (meaning our estimate ranges are very large). For each country, we have taken the survey reporting the lowest possible number of Anglicans, and taken the lowest end of the range within the 99 per cent confidence interval to establish the lowest possible figure. We have likewise taken the sample with the highest proportion of Anglicans, and treated the upper end of the 99 per cent confidence interval as a means of calculating the greatest possible number of Anglican-identified in that country. This establishes the limits within which debate over estimates of those identifying as Anglicans in each country is reasonable; estimates beyond that level are so improbable that they should not be seriously entertained.
We can say with near certainty that those who identify as Anglicans in South Africa in 2015 amount to at least 1.26 million, and no more than 3.7 million. Likewise, we can say that the Anglican-identified population of Kenya amounts to between 3.04 million and 6.69 million; Tanzania will have somewhere between 1.64 and 4.26 million that identify as Anglicans; in Uganda there are between 6.6 and 13 million that identify themselves as Anglicans. These are extremely wide ranges, wanting much by way of precision, and they hold few surprises. We can be as certain as statistics allows that the true value will lie in these ranges.
The results from the four representative samples of Nigeria hold more by way of interest. On the basis of the survey data included here, we are able to determine that it is highly unlikely that there are fewer than 4.94 million Anglican identified in Nigeria, and –more strikingly – on the basis of the best available representative survey data, it is equally unlikely that there are more than 11.74 million who identify as Anglican. In statistical terms, this makes the usual figures that get discussed, the ‘more than 18 million’ sometimes cited by leaders of the Church of NigeriaFootnote 31 and built upon by the World Christian Database, and even the 17.5 million that appears as the number of members in the Church of England Year Book,Footnote 32 exceedingly unlikely indeed.
Point Estimates: The Most Likely Total National Populations Identifying as Anglican
Even if we can be confident that the 2015 population of Anglicans in each of the five sub-Saharan countries we have been considering here lie within the ranges we have identified, this does not provide much by way of precision. Do the representative samples of these four surveys allow us to make a point estimate (a single number that is the most likely number of Anglican-identified)? Here I submit what are, on the basis of the four representative surveys, the proportion and the total number of those with Anglican identities that is statistically most likely on the basis of these four nationally representative surveys. To calculate the most likely proportion of Anglicans, I have taken a weighted average of the four surveys. Since larger statistically representative samples have greater accuracy (narrower confidence intervals), they are therefore given more weight. In practice, this means that the Pew Forum Survey has less influence in the calculation of the most likely figure than do any of the Afrobarometer surveys. In each case, the United Nations population estimate for 2015 has been used to calculate the number of Anglicans, as a proportion of the population. Whereas the parameter estimates set the boundaries for reasonable positions in the debate about the number of Anglican-identified in each of the four countries, the point estimate is my contribution to the debate. In probability terms, this is the best wager one could make.
The best estimate of the population of South Africa is about 4 per cent of the population in 2015, and just under 2.3 million Anglicans, which squares with Bompani’s assessment.Footnote 33 Likewise, at 10 per cent of the Kenyan population, or just under 4.9 million Anglicans, the surveys offer broad support for Galgalo’sFootnote 34 analysis of available church membership figures – so long as we assume that most of those who identify as Anglican in Kenya are also participants. That 5 per cent of Tanzanians would identify as Anglican (2.6 million) seems unlikely to be hotly contested.
The other findings will undoubtedly be more contentious. The proportion of Nigerians that identify as Anglicans is most likely 4 per cent; assuming the UN population estimates for 2015, that amounts to 7.6 million Nigerians who think of themselves as Anglicans, and respond accordingly when asked. The proportion of Anglicans in Nigeria, on this evidence, is roughly equivalent to the proportion estimated by the World Christian Database for 1970 of 5 per cent. The WCD estimate for this earlier date evidently does require some caution. It nevertheless seems unlikely that in 1970, Anglicans would have amounted to a radically smaller proportion of the Nigerian population than 4–5% (2.8 million), given that Nigeria was widely seen as having been a particularly successfully growing part of Anglican West Africa and on this basis had formed its own province in 1979.Footnote 35
The Church of Nigeria has of course grown – in fact it has grown dramatically. On the evidence presented here, it is most likely that it has grown at the same frenetic pace as the population of Nigeria as a whole. The total national population of Nigeria has grown from 56 million in 1970 to 181 million in 2015Footnote 36 – growth of over 320 per cent. For the Church to have kept pace with population growth is no mean accomplishment, given the stabilization in the proportions of Christians to Muslims and Traditional worshippers, with relatively low levels of conversions between the groups. More recently, newer, largely charismatic and Pentecostal, Churches have been competing aggressively for adherents within the Christian (and more narrowly the Protestant) slice of the pie. Assuming that Anglicans are not having fewer children than other Nigerians (nor suffering substantially higher rates of mortality), even if there have undoubtedly been converts to Anglicanism, the number adopting Anglican identities has been largely proportional to those leaving them behind. Given the growth of new Churches, it is remarkable that the outflow is not much faster than the inflow.
In contrast to the usual rankings, this data shows that it is unlikely that the Church of Nigeria is the largest Anglican province in Africa. In terms of the number of people identifying as Anglicans, the Church of Uganda is much more likely to be the largest. With 27 per cent of the population identifying as Anglicans, this amounts to almost 10.9 million individuals, against the most likely count of 7.6 million Nigerians (4 per cent of the population).
The Census Compared with Representative Surveys, and Proportional Decline
The Church of Uganda is not only the Anglican Church with the largest ‘market share’ of any province in sub-Saharan Africa (as is widely recognized), but, as I have shown here, it also very likely has a larger population of people who identify with it, compared with any other Anglican province in the region. There is some evidence, however, that it has been losing ground in proportional terms, even as, given the increase in population, it is still growing in absolute numbers.
Percentages for reported religious identification from the 1991, 2002 and 2014 National Population and Housing Census of Uganda are reported in Table 4. Between the 1991 Census and the 2014 Census, reported identification with the Church of Uganda fell from 39.2 per cent in 1991 to 36.6 per cent in 2002 and 32.0 per cent in 2014. This parallels a similar, though less pronounced, decline of those identifying as Roman Catholic, which fell from 44.5 in 1991 to 39.3 in 2014. The grab-bag category of assorted ‘others’ declined from 4 per cent to 1.4 per cent (though this may be partly explained by changes in the categories of reporting). Identification with traditional religions, already a miniscule proportion of the population, have also shrunk from a per cent to a tenth of one per cent.
Other traditions grew. Muslims increased from 10.5 to 13.7 per cent of the population. The category labelled in Table 4 as Pentecostal, which is not a category reported in the Census reports for 1991, accounts for 5 per cent of the population in 2002 and over 11 per cent in 2014. In 2014, however, the category has been expanded to include those who identify as ‘Pentecostal/Born-Again/Evangelical’. It is impossible to disaggregate the category, or to determine what proportion identify with the different merged terms. Neither is it possible to know precisely how much of the difference between the figure reported in 2002 and that reported in 2014 is due to a difference in reporting, and how much is due to changing religious allegiances. That said, this group of identities have evidently grown at the expense of the largest categories (Anglican, and to a lesser extent, possibly Catholic). It is clear that the gains in this category have not come from the ‘other’ category (representing all religious groups claiming less than 0.1 per cent of religious identities), which could contribute an absolute maximum of 2.1 per cent, from the non-religion category, or from those who formerly would have claimed ‘traditional’ religious identities. The extent to which ‘latent’ Pentecostal identities only become visible in 2002 is impossible to tell, though there is little doubt from fieldwork observations that Pentecostal and independent Evangelical churches have been growing dramatically in recent years in Uganda.Footnote 37
The Census categories themselves do not themselves align perfectly with how social scientists studying religion would distinguish between, for example, Evangelicals, Fundamentalists and Pentecostals, nor with local terminology, where terms like ‘savedee’ and Balakole would be part of this mix.Footnote 38 There are also uncertainties about how interviewers translated local terms into the categories provided by the Census questionnaire. All things considered, however, the Census reports provide the most positive indicators of the strength of Anglican identities in Uganda, and also very strong suggestion of recent substantial proportional losses.
What, then, of the discrepancy, noted earlier, between the Census and the representative surveys? All four surveys, each based on a statistically representative sample, contain a much smaller proportion of Anglicans than we find in the 2014 Census. Given that the surveys are all consistent in this respect, the discrepancy needs to be accounted for. We need to consider whether all four surveys could be under-counting Anglicans, or if the Census is over-counting them. Differently worded questions can produce different results. Indeed, The Afrobarometer, the Census and the Pew Forum questions are all slightly different in the questions that they ask about religious affiliation, as discussed earlier. It is difficult, however, to see how this could have resulted in suppressing the number of Anglicans, especially since the Pew Forum survey contains the highest proportion of Anglicans in South Africa, Kenya and Tanzania of all the surveys considered here.Footnote 39
By far the most important difference is that in the Census (unlike in the surveys), the enumerator does not ask individuals to identify their own religious affiliation. Rather, in the Census, one person responds on behalf of all members of the household (presumably, more often than not, the ‘head of the household’ as they are identified by the Uganda Bureau of Statistics). As such, this is a household religious identification. Even a slight tendency of the head of the household to claim members of the household who have moved on to other religious identities as Church of Uganda, would easily inflate the number of Anglicans in the Census enumeration. The survey research adopts the standard practice of only including those individuals 18 years of age or older; the Census includes everyone, even very young children, who are included in the total.
It seems likely that in this discrepancy we are catching sight of a generational change, whereby young people are more likely than their elders to opt for Pentecostal/Charismatic or Independent Evangelical identifications. This comes up, albeit somewhat anecdotally, as one of the most common concerns of church leaders across sub-Saharan Africa. In a recent interview, one bishop expressed a worry shared by many of his colleagues, when he expressed concerns about ‘the exit of young people for charismatic churches and ministries’.Footnote 40 Referring specifically to the growth of Pentecostal and Charismatic Churches in Uganda, Amos Kasibante writes that Pentecostalism’s ‘numerical success has been so great that there is talk in the Church of Uganda of a mass exodus of mostly young people from their churches to the new churches’.Footnote 41 If what we are seeing is in part a generational change, this would help make sense of the discrepancy, which is otherwise difficult to explain. It would also mean that it is likely that the nationally representative surveys on which I have reported in this essay may be much closer to the mark in identifying the true prevalence of Anglican identities in Uganda at present than are the figures provided by the national Census. The Census results, in other words, lag behind real denomination-level changes.Footnote 42
Conclusion
In this contribution to the emerging debate about the growth and numerical strength of the Anglican Provinces of sub-Saharan Africa, I have used the best available, nationally representative data in order to assess the prevalence of Anglican identities in five countries. This is broadly speaking the ‘outer circle’ of Anglicans, which I have referred to as those with Anglican identities. This was not the primary focus of Muñoz’s analysis,Footnote 43 and identification is different than participation; those who identify are highly likely to be a larger group than those who participate and, at least in traditional churches, will constitute the outer limit of those who will be regular participants.
I have provided parameter estimates within which we can be confident of the ‘true value’ of those who identify as Anglicans in each of the five countries. I have also provided point estimates, and compared these, where possible, to other data and estimates. The findings from these surveys about the percentage and population of Anglican-identified in Kenya, South Africa and Tanzania have been relatively consistent with other scholarly estimates. The findings for Nigeria and Uganda are more surprising, and likely to be contentious. On the basis of four nationally representative surveys, I show that the proportion of Nigerians who identify as Anglican is much lower than is usually assumed (about 4 per cent of Nigerians, or 7.6 million persons in 2015); while the church has undoubtedly grown, the best available evidence suggests that it has grown at the same pace as the population. Given the rise of Pentecostal churches and Charismatic ministries, this is no mean accomplishment (and has certainly outperformed the churches of the global, and increasingly secular, North.Footnote 44 Nevertheless, the Church’s own estimates (statistically speaking) lie well beyond the realm of the possible.
Using nationally representative survey data, I estimate that those who identify with the Church of Uganda amounted to about 27 per cent of the population in 2015, much lower than the 32 per cent enumerated in the 2014 Census of Population and Housing. I suggest that, given that the Census itself shows a drop of 7.2 per cent since 1991, and the fact that the Census enumerates religious identities as indicated by one respondent for the household, this suggests that the Census results may be lagging well behind actual religious change. The drop-off, in proportional terms, has likely been much steeper than is evident by considering the figures in the Census alone, without comparison or methodological context. Nevertheless the results presented here suggest that the Church of Uganda is numerically larger than the Church of Nigeria, at least in terms of the population that identify as Anglicans.
Appendix: Total survey sample size (with 99% confidence intervals for proportion of Anglicans)