The world's population is projected to rise approximately 9·46% from 2016 to 2025, reaching a total of 8·1 bln people, and this growth in population will increase demand for food protein (OECD/FAO, 2016) that could be satisfied mainly through efficiency improvements in crop area and livestock herds. The cattle herd should slowly increase and milk yield should continue to follow the demand by growing slowly and following the expansion in population and income. As the prices are expected to increase by between 6 and 8% over the outlook period, the domestic demand for dairy products (butter, cheese, skimmed milk, and whole milk powder) will follow the slight increase in milk production. On the other hand, small properties dedicated to dairy cattle farming have been suffering with the drop in economic profitability mainly due to the higher cost of inputs (corn, soybean meal, chemicals for endo and ectoparasite control, pasture fertilizers, etc.). Moreover, small producers usually lack the appropriate scale of production and ‘technology package’ to remain in this business. Thus, seeking superior animals that can boost the zootechnical indices of a farm is of crucial importance.
Using animal breeding tools, the producer is able to assess and identify which animals are the most interesting for the production system in place. However, selecting the best sires for the system is not an easy task since several genetic values of several traits, as well as different selection indices, are reported in the summary of dairy bulls. This way, using an economic selection index adapted to the system is a good solution to maximize the system's profit. Therefore, the present study aimed to calculate economic values (EVs) and economic selection indices for milk production systems in small rural properties, in tropical areas.
Material and methods
The present study was carried out using zootechnical data of Holstein Friesian, Jersey and crossbred cows (Holstein × Jersey) belonging to 29 small commercial properties in southern Brazil during 2011. Contemporaneous inventories of revenues and costs were collected from the same farms. The prices were recorded in Real, the Brazilian currency, whose exchange rate to the American dollar at the time was BRL 1·67 for every USD 1·00. On-farm data collection was conducted according to routine management procedures and conformed to the guidelines of NRC (1996).
The milk production systems were defined based on actual performance data and on the inventory of revenues and costs of all properties using clustering analysis. To compare all the traits of the production systems, they were adjusted based on the distribution of births, and according to their stage of lactation and parity, as suggested by Keown & Everett (Reference Keown and Everett1985) and Zhang et al. (Reference Zhang, Dekkers, Banos and Burnside1994). After that, all variables available such as family work units (fixed labour), milk production area, number of animals, zootechnical parameters (amount and quality of the milk produced, live weight, calving interval, etc.), and amount of concentrate and silage consumed, among other variables, were standardized.
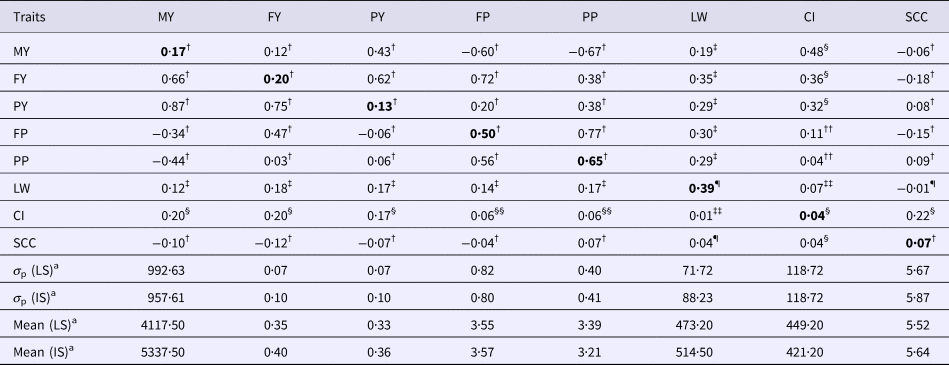
Next, in order to perform clustering analysis and identify the possible milk production systems, Euclidean distance was used as coefficient of similarity for quantitative variables. The similarity among the elements to be clustered was measured using Ward's method (Ward, Reference Ward1963). The clustering analysis indicated two production systems with some differences among the parameters (Table 1). The first system detected was called less intensive (LS) and was characterized by having 23 Jersey and crossbred cows (Holstein × Jersey), of which ten were lactating cows that produced on average 13·5 l/d and consumed 1·8 kg of concentrate/d and 12·1 kg corn silage/d, and three dry cows. The lactating cows’ average live weight was 473·2 kg and their calving interval (CI) was 449·2 d. This system featured properties with an average size of 15·3 ha and two family units in fixed labour earning the equivalent of two minimum wages of USD 305·39 per month (corresponding to the family unit). The other production system was called more intensive (IS) and was characterized by having 42 Holstein Friesian and crossbred cows (Holstein × Jersey), of which 22 were lactating cows that produced on average 17·5 l/d and ate 3·4 kg of concentrate/d and 10·6 kg of corn silage/d. The lactating cows’ live weight was 514·5 kg and their CI was 421·2 d. This system featured properties with 23·8 ha and 2·5 family units in fixed labour earning the equivalent of 2·5 minimum wages of USD 305·39 per month (corresponding to the family unit).
Means, phenotypic standard deviations (σ p), heritability (diagonal), genetic correlation coefficients (above the diagonal), and phenotypic correlations (below the diagonal) for the traits 305-d milk yield (MY, in kg), daily yield of fat (FY, in kg) and protein (PY, in kg), daily percentage of fat (FP, in %) and protein (PP, in kg), mean cow live weight (LW, in kg), calving interval (CI, in d), and logarithm of the daily somatic cell count (SCC)

IS, More intensive system; LS, Less intensive system
† Schutz et al. (Reference Schutz, Hansen, Steuernagel, Reneau and Kuck1990)
‡ Muller et al. (Reference Muller, Cloete, Olivier, Botha and de Waal2006)
§ Pritchard et al. (Reference Pritchard, Coffey, Mrode and Wall2013)
¶ Pryce & Harris (Reference Pryce and Harris2006)
†† Campos et al. (Reference Campos, Wilcox, Becerril and Diz1994)
‡‡ Pérez-Cabal & Alenda (Reference Pérez-Cabal and Alenda2003)
§§ Osman et al. (Reference Osman, El-Bayomi and Moawed2013)
aField data of this study
After the clustering analysis defined the production systems, bioeconomic models were developed using Microsoft® Excel® 2007 sheets to identify breeding goals and selection criteria and calculate the production performance and net profit of the systems, as well as the EVs of the traits. The breeding goals studied were 305-d milk yields (MY, in kg), percentage of fat and protein (FP and PP, in %), cow live weight (LW, in kg) per lactation, calving interval (CI, in d), and logarithm of daily somatic cell counts in milk (SCC). Thus, ten selection criteria were considered in the analyses, in which these traits were combined, switching FP and PP by fat and protein yield (FY and PY, in kg). The traits were calculated based on the adjustment factors described by Keown & Everett (Reference Keown and Everett1985) and Zhang et al. (Reference Zhang, Dekkers, Banos and Burnside1994).
The revenues and costs involved in this study refer exclusively to the milk production process, including rearing female calves and breeding heifers for replacement and sale. In both systems, the producers received a bonus for milk quality in terms of PP, FP, and SCC. The payment policy applies 1·6% of bonus or penalty of base price (USD 0·34/l) for yields bigger or smaller than 3·1 and 3·3% of PP and FP, respectively, and 2·7% of bonus or penalty of base price for yields bigger or smaller than 401 000 of SCC in the raw milk. Moreover, the systems also had the costs of dry cows and the culling of male calves (no revenue), and part of the revenue came from the sale of culled animals (heifers and lactating cows).
The 2011 prices of the products and production components were obtained from national reports of specialized economical statistics (ANUALPEC, 2011; IEA, 2013) and from dairy industries that process milk in the region. The costs of forming and maintaining pastures and forages were calculated based on expenses with inputs and labour, obtained from actual data from all properties.
The costs included were feed (such as pasture, consumption of concentrate and silage), hiring fixed and temporary labour, taxes, medication, energy, water, fuel, cleaning materials, semen purchase (cost of two and a half times for every inseminated cow), and fixed costs, i.e. expenses with maintenance and depreciation of machines and facilities.
The daily energy requirements for maintenance, growth, gestation, and milk production were calculated so as to meet the recommendations by the NRC (1989), with the aim of obtaining the production cost. The costs with feed per cow in lactation could be calculated based on the feed management system and daily net energy requirement (Mcal). The costs with temporary labour for artificial insemination were also included. The equations to calculate the net profit (NP) of each system were split into five equations of profit or only cost according to the animal category: lactating dairy cow (LDC), dry cow (DC), heifers up to two years old (YH), heifers over two years old (OH), and heifer calves (HC), as follows:
 $${\rm ANP}_{\rm LDC} = {\rm RMS}_{\rm LDC} + {\rm RAS}_{\rm LDC}-{\rm CF}_{\rm LDC}-{\rm CD}_{\rm LDC}-{\rm CME}_{\rm LDC}-{\rm CML}_{\rm LDC}$$
 $${\rm AN}{\rm P}_{{\rm DC}} = -{\rm C}{\rm F}_{{\rm DC}}-{\rm C}{\rm D}_{{\rm DC}}-{\rm CM}{\rm E}_{{\rm DC}}-{\rm CM}{\rm L}_{{\rm DC}}$$
 $${\rm ANP}_{\rm YH} = {\rm RAS}_{\rm YH}-{\rm CF}_{\rm YH}-{\rm CD}_{\rm YH}-{\rm CME}_{\rm YH}-{\rm CML}_{\rm YH}$$
 $${\rm AN}{\rm P}_{{\rm OH}} = -{\rm C}{\rm F}_{{\rm OH}}-{\rm C}{\rm D}_{{\rm OH}}-{\rm CM}{\rm E}_{{\rm OH}}-{\rm CM}{\rm L}_{{\rm OH}}$$
 $${\rm AN}{\rm P}_{{\rm HC}} = {\rm RA}{\rm S}_{{\rm HC}}-{\rm C}{\rm F}_{{\rm HC}}-{\rm C}{\rm D}_{{\rm HC}}-{\rm CM}{\rm E}_{{\rm HC}}-{\rm CM}{\rm L}_{{\rm HC}}$$
where ANP, annual net profit; RMS, revenue with sale of milk; RAS, revenue with cow sale; CF, cost of feed; CD, cost of depreciation; CME, cost with medications; and CML, cost with managing labour.
The system's net profit was estimated by adding the five annual equations, i.e. the profit or cost of each category.
After that, the EVs were obtained from the difference in annual net profit of each system, when the yield level of one of the traits studied (breeding goal) was increased by one without changing the other traits for a fixed number of animals in each system (Groen et al. Reference Groen, Steine, Colleau, Pedersen, Pribyl and Reinsch1997) divided by the number of cows. Each EV expresses the annual monetary gain due to superior genetics of a given trait, when the yield level is improved by one unit per mated cow (Veerkamp, Reference Veerkamp1998). In order to calculate the marginal change in feeding costs derived from the increase by one unit in the mean individual performance through genetic improvement related to the traits under study, the amount of net energy (Mcal) needed to meet the requirements of cows in terms of MY, FP, PP, CI, and LW will be estimated. The increases in feeding costs were calculated, comparing the post- and pre-selection (initial) situations, to meet the post-selection energy requirements and this difference was added to the initial feeding costs. For the SCC, feeding costs did not change from the pre- to the post-selection situations.
After EVs were calculated, sensitivity analyses were performed to assess the impact of possible changes such as in the expenses with artificial insemination, in LW (simulating the change in animal frame), and in the expenses with concentrate and silage on the economic values of the traits studied. To that end, the initial value was varied by +50, +10, ±20, and ±15%, respectively.
In order to obtain the economic selection indices, the traits MY, FP, PP, LW, CI, and SCC were used as breeding goals. Those same traits were used as selection criteria, except for FP and PP, which instead used the traits FY and PY as selection criteria. After the breeding goals and selection were defined, using the R statistical computing environment (R Core Team, 2015), the weight factors (b) were estimated that maximized the correlation between H (breeding goal) and economic selection index (criterion), according to Schneeberger et al. (Reference Schneeberger, Barwick, Crow and Hammond1992) (supplementary material) and following the classic selection index model (Hazel, Reference Hazel1943), using the genetic and phenotypic parameters in the literature (Table 1) and the EVs estimated by means of the basic situation (Table 2). After the economic selection index was calculated, the relative importance (%) of each selection criterion was estimated to compare the level of each trait in the index.
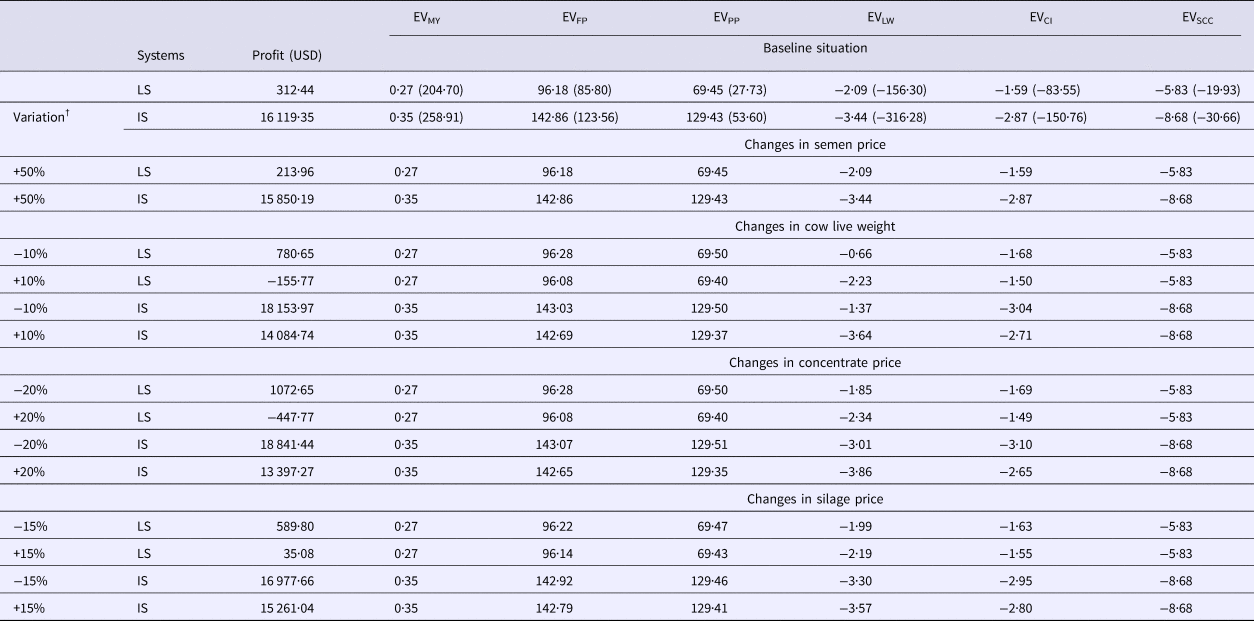
Economic values (EV) expressed in USD and standardized EV (in parentheses) for the traits 305-d milk yield (MY, in kg), daily percentage of fat (FP, in %) and protein (PP, in %), mean cow live weight (LW, in kg), calving interval (CI, in d), and logarithm of daily somatic cell count (SCC) in the milk for two production systems, namely more intensive (IS) and less intensive (LS), in the baseline situation and after sensitivity analysis (variation of the situations in percentage), besides the respective net annual profits in each situation

Exchange rate: USD 1·00 = BRL 1·67 (2011)
† Variation = sensitivity analysis, varying the prices of the situations in percentage, as well as the cow's live weight (simulating a change in the animals’ biotype)
The accuracy of the index (R IH) was calculated as the correlation between the economic selection index and the breeding goal (aggregated genotype, H), and the genetic superiority expected in the breeding goals (S ESI) was took into account one standard deviation in the selection, according to Schneeberger et al. (Reference Schneeberger, Barwick, Crow and Hammond1992). The genetic gain of each trait (R g) was calculated following the study by Yamada et al. (Reference Yamada, Yokouchi and Nishida1975). Additional details about these formulas can be found in the online Supplementary File Materials and Methods.
The responses expected (R g, S ESI) and the accuracies (R IH) were calculated by modifying the systems’ selection criteria considering ten economic selection indices (Table 3). Those ten selection criteria (Table 3) were studied so that an economic selection index could be proposed depending on what the producer had available to select, besides testing strategies of how to make the selection.
Composition of selection criteria combining the traits in the economic selection indices

Traits in the economic selection index: MY = 305-d milk yield (kg), FY = daily yield of fat (kg), PY = daily yield of protein (kg), LW = cow live weight (kg), CI = calving interval (d), and SCC = logarithm of the daily somatic cell count (cells/ml of SCC in the raw milk)
The parameters to estimate the economic selection indices such as means, phenotypic standard deviations (σ P), heritability coefficients (h 2), genetic coefficients, and phenotypic coefficients for the traits employed in this study are presented in Table 1 and were collected from the literature and from the field data itself.
Result and discussion
The net annual profits observed in the baseline situation were USD 312·44 in LS and USD 16 119·35 in IS (Table 2). It is worth pointing out that those values came from subtracting the function cost from the function revenue of the whole dairy activity in that year. This generates a monthly profit per cows in lactation of USD 2·60 and USD 68·77, respectively for LS and IS. The costs involve the wages of the fixed (family labour) and temporary labour, depreciation, payroll tax, and taxes. This generates monthly costs with managing labour, feeding, husbandry, and medication per cows in lactation of USD 1035·32, USD 803·38, USD 177·21, and USD 43·18, respectively for LS and in the same order of USD 795·62, USD 1128·83, USD 189·21, and USD 102·60 for IS. The large difference between the costs in the two systems is due to the inversion between costs with labour management and feeding, which was expected since IS has 19 animals more than LS. In addition, the lactating cows produce more milk and are heavier in IS (Table 1). When the expenses with labour management and feeding in each system are compared, the values suggest that LS could invest more in feed to increase productivity. These results indicate higher profitability in IS compared to LS despite the higher production cost.
Table 2 also shows the EVs observed for either system. The data show that, in the baseline situation, the EVs of the traits MY, FP, and PP related to the main source of income, i.e. milk sale and bonus for milk quality (PP and FP), were all positive, whereas the EVs of the other traits (LW, CI, and SCC) were all negative in all situations. These results were expected since the traits with negative EVs are associated with higher expenses, either related to feeding or to the preventive control and treatment of animals. Banga et al. (Reference Banga, Neser, van der Westhuizen and Garrick2009) and Kalantari & Cabrera (Reference Kalantari and Cabrera2015) estimated similar EVs. Therefore, these negative EVs indicate that the cows' weight and CI should be controlled, as well as SCC should be lowered, while the positive EVs suggest increasing production and milk quality (PP and FP) to raise the profitability in either systems.
When the EV of each trait is multiplied by its respective additive standard deviation, the standardized EV (Table 2) indicates the economic importance of the MY and LW traits in the genetic improvement of the system as a whole. Those traits are followed by CI and FP and, lastly, by PP and SCC as the ones with the least importance in the breeding goal. However, the economic select index must be estimated, which involves the correlations among the traits besides heritability. In terms of EV, among the most important traits, LW has lower importance in LS than MY. That was expected since the cows have higher LW in IS, which makes LW have a greater impact on the profit of that system and MY, a greater impact in LS.
Although the EVs for FP and PP were positive and high in both systems (Table 2), they were less expressive than MY, despite the policy of differentiated pay for milk components. That indicates the additional bonus or penalty paid for the milk components is enough to make breeding for those traits advantageous, but more profit will be reached with selection for MY in relation to FP and PP. In the same way, Banga et al. (Reference Banga, Neser, van der Westhuizen and Garrick2009) and Cardoso et al. (Reference Cardoso, Lima, Nogueira, Carneiro, Sesana, Oliveira and El Faro2014) obtained similar results for MY, FY and PY. However, Madalena (Reference Madalena2000), Vercessi Filho et al. (Reference Vercessi Filho, Madalena, Ferreira and Penna2000), Martins et al. (Reference Martins, Madalena, Bruschi, Costa and Monteiro2003), and Cardoso et al. (Reference Cardoso, Nogueira, Vercesi Filho, El Faro and Lima2004) obtained negative economic values for fat and protein in dairy cattle production systems in Brazil in a context that had no type of bonus payment. It is also observed that the EV obtained for PP was lower than the value for FP, contrasting with the result by Pérez-Cabal & Alenda (Reference Pérez-Cabal and Alenda2003) for dairy cattle production systems. That indicates that, in order to obtain a 1% increase in protein in the system's annual production, a proportionally greater increase in this trait would be required compared to the fat content.
As also expected for, the traits LW, CI, and SCC had negative EVs in both systems, since those traits are strongly associated with higher costs. Pérez-Cabal & Alenda (Reference Pérez-Cabal and Alenda2003) defined EVs for those traits in a study carried out in Spain. Those authors reported negative values and suggested that increasing LW and CI could harm the overall profit per cow per year, which matches Groen et al. (Reference Groen, Steine, Colleau, Pedersen, Pribyl and Reinsch1997) and Banga et al. (Reference Banga, Neser, van der Westhuizen and Garrick2009).
When a 50% increase in costs with artificial insemination was simulated, a reduction in profits was observed, with the annual revenue dropping to USD 213·96 and USD 15 850·19, respectively, for LS and IS (Table 2). However, the profit regarding the benefits of using superior genetic material was not computed. Those results indicate that IS, compared to LS, has a greater margin to invest in acquiring doses of semen of animals with better genetic values, which are often more expensive. Cabrera (Reference Cabrera2014) showed the dairy cattle reproductive economics working with different fertility performance of dairy cows.
The increase by 10% (Table 2) in LW would make LS unviable (USD -155·77) and cause a reduction in annual profit in IS (USD 14 084·74) since the higher LW leads to higher nutritional demands and, consequently, higher feeding costs, which ultimately hinders the net profit of the production systems. Nonetheless, a reduction by 10% in LW would significantly increase the profit in either system to USD 780·65 (LS) and USD 18 153·97 (IS). These results indicate that, when working with a smaller system (fewer animals), the animal's frame greatly impacts profitability. According to Cardoso et al. (Reference Cardoso, Nogueira, Vercesi Filho, El Faro and Lima2004), the issue of whether or not to increase the animals’ weight must be discussed based on their relations with the feed intake capacity and milk yield. For those authors, the increase in size of specialized dairy breeds, followed by an increase in the feed intake capacity, may be favourable within an optimal level, as extensively discussed by Veerkamp (Reference Veerkamp1998). However, Cardoso et al. (Reference Cardoso, Nogueira, Vercesi Filho, El Faro and Lima2004) argue that, taking into account the milk yield potential of crossbred dairy cows, the occurrence of negative energy balance problems is not expected to be such a serious issue as in the case of high-yield dairy cows given the lower nutritional requirements of the former.
LS was more sensitive when the price of concentrate changed by ±20%, with its annual revenue ranging from USD −447·77 and USD 1072·65. After a variation by −20% in concentrate price, IS had a profit of USD 18 841·44, and it was the highest profit among all sensitivity analyses for IS and LS. Likewise, after a variation by ±15% in silage price, similar results were obtained compared to the variation in concentrate price, with the greatest impacts on LS. This analysis clearly showed that feeding was the factor with the greatest impact on the profitability of LS despite being the second largest cost in that system, as previously mentioned. Thus, during the breeding process for both systems, more efficient animals in terms of feed conversion should be considered. Vercessi Filho et al. (Reference Vercessi Filho, Madalena, Ferreira and Penna2000) also found that the high feeding cost significantly impacted the EV of LW in a production system featuring crossbred Gir and Holstein animals.
Both systems (LS and IS) had a large amplitude in EV of the traits both for the baseline systems and for the sensitivity analyses, which reflects the difference between the sources of revenue and expense of either system when it comes to milk quality. Overall, the EVs of the traits had the same behaviour in either system in terms of order of importance, except for the EVs of LW and CI, which changed when the price of concentrate decreased by 20% in IS and when LW decreased by 10% in either system. Those results indicate great confidence for the EVs in order to estimate ESIs and select animals in face of those variations in price since, when LW decreases in either system, that trait has lower importance in terms of profitability (low EV).
Table 4 show the weight factors (b) and the relative importance of each trait when it is the phenotypic selection criteria. As expected, the weight varied as a function of the production system and for the traits considered as a selection criterion.
Phenotypic weight factors (b p) and relative importance (RI) in percentage (in parentheses) for the traits 305-d milk yield (MY, in kg), daily yield of fat (FY, in kg) and protein (PY, in kg), mean cow live weight (LW, in kg), calving interval (CI, in d), and logarithm of the daily somatic cell count (SCC) in milk for two production systems, namely more intensive (IS) and less intensive (LS), in the baseline situation

† Phenotypic selection criterion (SCp): 1 = MY; 2 = FY + PY; 3 = MY + FY + PY; 4 = SCC; 5 = FY + PY + SCC; 6 = MY + FY + PY + SCC; 7 = LW + CI; 8 = MY + LW + CI; 9 = MY + FY + PY + LW + CI; 10 = MY + FY + PY + LW + CI + SCC
Considering phenotypic selection criteria number 1, emphasizing the breeding exclusively for milk yield, the phenotypic weights had lower values, close to zero, in both systems, i.e. this selection criterion did not influence the traits contained in the breeding goal, which indicates the low importance of selecting only for MY.
For phenotypic selection criteria number 2, positive phenotypic weights were found for LS, with relative importance of 6·80% and 93·20% for FY and PY, respectively. For IS, a negative value was observed for FY (−60·09) and a positive value for PY (95·51), with relative importance of 38·62 and 61·38%.
In phenotypic selection criteria number 3, which considers MY, FY, and PY, positive values were found for all three traits in LS, whereas the values were negative for MY and FY and positive for PY in IS. If the farmers chose this phenotypic selection criteria, they should use a specific index for each system, since for the LS we observed a relative importance of 89·06% for MY, 4·51% for FY and 6·43% for PY, indicating that in this system MY is more important than FY or PY. However, in the IS, the relation of relative importance between the traits changes to 42·25% for MY, 7·87% for FY and 49·88% for PY, suggesting that the PY in this system is more important, considering in both systems the same payment policy (bonus or penalty).
As expected, negative phenotypic weights were obtained in both LS and IS for phenotypic selection criteria number 4, whose target would be lowering SCC. The weighted values of that trait were also negative for phenotypic selection criteria numbers 5 and 6, with relative importance between 14·44 and 43·97%. In both, the weights of FY were negative and, as previously discussed, those results indicate that the bonus for fat percentage was not enough to make the weights positive.
The phenotypic selection criteria number 7, which contemplates LW and CI, had negative weights in all cases for LW with relative importance values above 75% for this trait. The weight of CI, in turn, was negative only for b in IS and positive for the other cases, exhibiting an antagonism in those cases aiming to shorten the calving interval. When MY was included in phenotypic selection criteria number 8, the weights for that trait were positive in all cases, with relative importance values between 8·15 and 39·02%, while the weights of LW remained negative and maintained high relative importance values in the indices. Finally, the weights of CI were negative in IS, which meets the goal of shortening CI, and positive in LS with low relative importance values.
The estimation of some weights in the selection criteria was antagonistic (MY, CI, FY), with moderate or low relative importance values, which shows the importance of the other traits. Only the weight of MY in IS was antagonistic to the goal of improving that trait in phenotypic selection criteria number 9, while the other weights in that selection criterion matched the breeding goal, with a strong relative importance of LW (47·09%). For the LS, the phenotypic selection criteria number 9 reach the best weights for intention of improving the breeding goal. However, in this index it is necessary to perform milk quality analysis to obtain protein and fat phenotypes.
The weights of the complete indices phenotypic selection criteria number 10, largely followed the intention of improving in the breeding goal, except for b of MY in IS, which was negative with high relative importance (21·16%) and for b of CI in LS with small relative importance (0·49%).
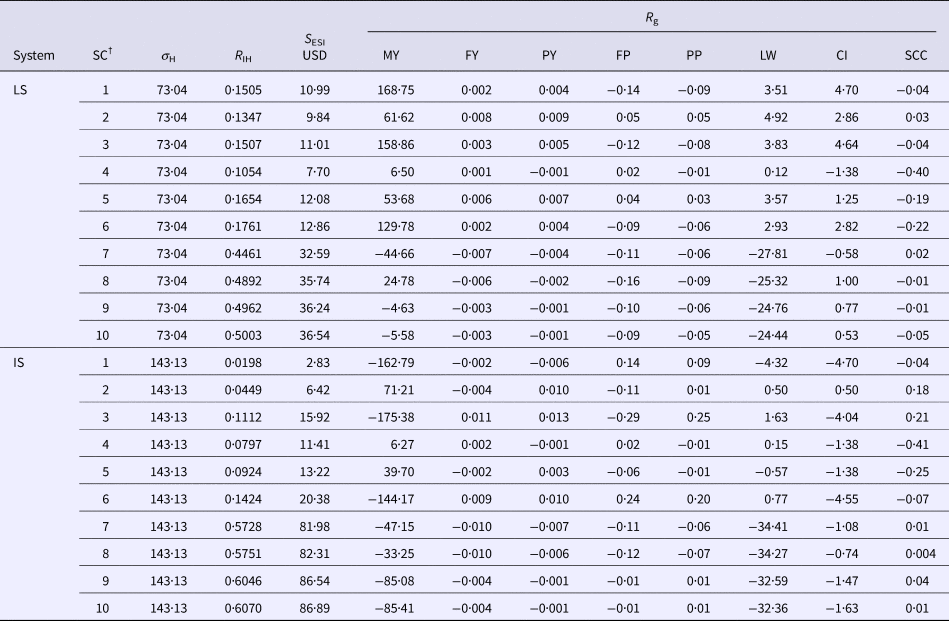
Table 5 shows the parameters, such as accuracy, expected responses to selection (S ESI) in dollars (USD) per generation, and individual response expected for each trait in the breeding goal, according to each selection criteria, using the phenotypic weights. In both systems, the most important selection criteria were those including the trait LW in the economic selection index, i.e. selection criteria numbers 7, 8, 9, and 10, since they had the highest accuracies (above 0·447) and greatest expected responses to selection (S ESI) in USD, which indicates LW is strongly associated with aggregated genotype. It is worth pointing out that LW's relative importance both in LS and in IS (Table 4).
Standard deviations of the breeding goal (σ H), correlations between the selection index and breeding goal (R IH), expected responses to selection (S ESI), in USD, and individual response expected for each trait (R g) according to the selection criterion (SC)

† Critério de Seleção (SC): 1 = MY; 2 = FY + PY; 3 = MY + FY + PY; 4 = SCC; 5 = FY + PY + SCC; 6 = MY + FY + PY + SCC; 7 = LW + CI; 8 = MY + LW + CI; 9 = MY + FY + PY + LW + CI; 10 = MY + FY + PY + LW + CI + SCC. MY = 305-d milk yield; FY = daily fat yield; PY = daily protein yield; LW = mean cow live weight; CI = calving interval; SCC = logarithm of the daily somatic cell count in milk. IS = more intensive system; LS = less intensive system
Assuming selection intensity equal to the unit and in case the breeding were performed exclusively for milk yield (selection criteria number 1), the expected responses to selection per generation would be US 10·99 and USD 2·83 for LS and IS, respectively (Table 5). However, when selection criteria number 1 of both systems is compared with selection criteria number 9 of LS and selection criteria number 8 of IS, much higher responses to selection are expected, at USD 36·24 and USD 82·31, respectively, which reinforces the practice of selecting according to the economic selection index and not only to the improvement in the animals’ milk yield.
Despite the high importance of milk quality, as mentioned in several studies (Boor, Reference Boor2001; Santos et al. Reference Santos, Ma and Barbano2003), breeding to reduce SCC alone (selection criteria number 4), to increase PY and FY (selection criteria number 2), or to improve milk quality through all three traits (selection criteria number 5) would not result in high expected responses to selection or accuracies in either system (Table 5). When breeding targets milk quality along with MY (selection criteria number 6), both expected responses to selection and accuracy increase only in IS (Table 4), however, still at much lower levels than the gains already discussed by selection criteria numbers 7, 8, 9, and 10. Those results show once again that breeding only for milk components and volume in the index would add very little aggregated genetic merit. Although milk quality is known to be very important, when the aggregated genotype is considered in breeding one must take into account the other traits, such as LW and CI, so that the progress is not incipient.
In more accurate economic selection indices (selection criteria numbers 7, 8, 9, and 10), many of the individual responses expected for each trait (R g; Table 5) were unfavourable, except for the responses of LW in both systems and of CI in IS. Those results indicate that animal size is an important factor in the system's profit since feeding is a significant expense in the profitability of systems and the increase in milk yield is positively related to LW and, consequently, to higher feeding costs and not necessarily to the net profit of the system as a whole.
The phenotypic economic selection indices presented in Table 4 are extremely important from the productive standpoint since a small producer with only one holding pen who uses a scale of thoracic circumference tape to correlate this measure with the cow's weight, who uses a portable scale to weigh the milk and writes down the dates of births to establish the calving intervals, as well as who performs systematic zootechnical control and records information would be able to select animals with over 57% (Table 5) association with the aggregated genotype by using selection criteria numbers 7 and 8 in the IS as previously mentioned.
According to the results obtained in the sensitivity analyses, the levels of input use impacted the economical responses of the two production systems, particularly the price of grains since they make up the concentrate feed for production animals. It was also observed that the bonus policy for milk yield, components, and reduction in SCC were not enough to make the weights of the selection indices of those traits greater than the weight of cow live weight. A bonus system with higher prices would incentivize increased production by providing better marginal compensation. Thus, the production systems hereby presented with modest-sized herds and moderate production in which the animals are kept in perennial tropical pastures with the use of byproducts would benefit from adapted animals, i.e. an adequate biologic type with more efficient, smaller animals that would entail lower costs with energy and better reproductive performance.
Conclusions
Cow frame (cow live weight) is the trait with the greatest impact on the profit of a milk production system because a larger animal represents higher feeding cost, particularly in the more intensive system assessed in the present study. Although the milk quality traits have important economic values, they did not satisfactorily impact those two milk production systems compared to cow live weight. However, the production yield trait is the second most important selection criterion, followed by somatic cell count and fat yield, respectively. The results indicated that a selection index for each system comprising phenotypic weight factors can be used through the phenotypic values of the traits 305-d milk yield, cow live weight, and calving interval (phenotypic selection criteria number 8) with a high accuracy of obtaining satisfactory economic return.
Supplementary material
The supplementary material for this article can be found at https://doi.org/10.1017/S0022029918000894
Acknowledgements
The authors acknowledge the Rede Leite (Pesquisa-Desenvolvimento em Sistemas de Produção com Pecuária de Leite na Região Noroeste do Rio Grande do Sul) and the participating dairy cattle farms for the use of their data to conduct this study.