Iodine is an essential micronutrient required for the synthesis of thyroid hormones, which regulate metabolism, growth and development(Reference Moreno-Reyes, Feldt-Rasmussen and Piekiełko-Witkowska1). Recognition of the wide range of iodine deficiency disorders led to the establishment of the Iodine Global Network (IGN; formerly the International Council for the Control of Iodine Deficiency Disorders, ICCIDD), which has advocated for the use of iodised salt in households as well as in food processing and manufacturing. Although iodine deficiency has declined globally, it remains a public health issue in thirty-two countries, with millions of school-aged children still at risk(Reference Lazarus2). Key dietary sources of iodine consist of iodised salt, seafood, seaweed and dairy products(Reference Rohner, Zimmermann and Jooste3). Nevertheless, people who have dietary restrictions or limited availability of high-iodine items face a higher likelihood of iodine deficiency.
Urinary iodine concentration (UIC) has traditionally been the biomarker of choice, as most ingested iodine is excreted in urine(Reference Zimmermann and Andersson4). Despite being the primary tool, the use of UIC has a number of limitations. Urine collection is not always acceptable due to privacy concerns, or discomfort associated with the process, which can affect participation and data reliability. Moreover, UIC is subject to wide diurnal variation(Reference Als, Helbling and Peter5), as well as significant day-to-day fluctuations(Reference Zimmermann, Jooste and Pandav6). Hydration status and renal function also have an impact on measured iodine concentrations, further complicating interpretation(Reference Rohner, Zimmermann and Jooste3). The current gold standard for assessing iodine status is a 24 h urine collection(Reference Zimmermann, Jooste and Pandav6), as it provides the most accurate measure of iodine excretion. However, its collection from a large number of individuals is logistically challenging and often impractical(Reference Vejbjerg, Knudsen and Perrild7). Also, the use of creatinine to adjust for urine volume has its own limitations, particularly because dietary meat intake significantly influences creatinine levels(Reference Abraham, Penczynski and Monien8), further reducing the reliability of this method. Other biomarkers, including thyroglobulin and thyroid-related hormones, have been proposed; however, their use in population-based studies is limited by the need for venous blood collection and their indirect reflection of dietary iodine intake(Reference Rohner, Zimmermann and Jooste3). To address these limitations, alternative biomarkers are needed.
Salivary iodide has emerged as a promising non-invasive biomarker. The constitutive expression of the sodium-iodide symporter (SLC5A5) in salivary glands allows salivary iodide concentrations (SIC) to reflect interstitial fluid iodide levels(Reference Venturi and Venturi9– Reference Portulano, Paroder-Belenitsky and Carrasco11). Previous literature highlights the potential of SIC as an indicator of iodine status, offering advantages such as easier sample collection and reduced variability compared to urinary markers(Reference Alsaeedi, Rose and Welham12). Studies have demonstrated that SIC correlates well with spot UIC in assessing iodine nutrition in populations with varying iodine intake levels(Reference Zhang, Li and Wang13) and is applicable to vulnerable groups, such as pregnant women(Reference Li, Guo and Jin14). A recent study observed that salivary iodide corrected for protein (SI/P) demonstrated a stronger correlation with 24 h urinary iodine excretion (UIE) than uncorrected SIC, suggesting improved accuracy and interpretability(Reference Dekker, Touw and van der Horst-Schrivers15). This finding supports our rationale for using SI/P in the present study, as this approach may reduce variability introduced by differences in saliva dilution.
Therefore, this proof-of-concept study aimed to determine whether SI/P could reliably distinguish between iodine-deficient and iodine-adequate groups, as defined by 24 h UIE, and to conduct an assessment of its potential utility for evaluating iodine status at the individual level. Specifically, we examined: (i) whether SI/P and UIC differ between iodine-deficient and iodine-adequate individuals; (ii) the strength of correlation between spot samples and 24 h UIE; (iii) the responsiveness of SI/P and UIC to short-term dietary iodine restriction and (iv) the diagnostic accuracy of these biomarkers using receiver operating characteristic (ROC) curve analysis and AUC metrics. This study provides preliminary evidence on the diagnostic utility and comparative performance of SI/P and UIC for assessing iodine nutrition across different dietary conditions and sampling times and is intended to serve as foundational work for future validation studies.
Methods
An observational single-centre study was conducted at the University of Nottingham (UK) using convenience sampling and was designed as a proof-of-concept investigation. It was conducted according to the guidelines laid down in the Declaration of Helsinki, and all procedures involving human participants were approved by the Research Ethics Committee of the Faculty of Medicine & Health Sciences at the University of Nottingham (Ref: FMHS 29–0622; approved on 26 August 2022). Written informed consent was obtained from all participants.
Recruitment
Participants were recruited between October 2022 and June 2023 using posters, through university communication, word of mouth and emails sent to internal mailing lists. Interested individuals were provided with a participant information sheet which outlined the study’s practical requirements in simple, non-technical language.
Participants were asked to complete a screening questionnaire using ‘Online Surveys’ (formerly ‘Bristol Online Surveys’)(16), which gathered consent and general details including email address, socio-demographic information, anthropometric measurements, medical history, medication history, lifestyle and dietary habits. In addition, the screening questionnaire included a modified version of the validated FFQ developed for the Norfolk component of the European Prospective Investigation into Cancer and Nutrition (EPIC-Norfolk)(17) to determine habitual iodine intake over the three months preceding study participation.
The original FFQ was adapted for online administration via the ‘Online Surveys’ platform(16). It aimed to categorise participants into two groups: a high-iodine intake group (>140 µg/day) and a low-iodine intake group (<70 µg/d), based on UK dietary reference values(18). An intake above 140 µg/d exceeds the reference nutrient intake (140 µg/d), while an intake below 70 µg/day falls beneath the lower reference nutrient intake (70 µg/d), suggesting likely deficiency.
Although the EPIC-Norfolk FFQ has been validated for dietary assessment in UK populations and is widely used in nutritional epidemiology, it was not specifically designed for iodine intake estimation. Therefore, additional components were incorporated, and the modified FFQ was structured around five questions aimed at capturing iodine-specific dietary behaviours, as summarised in Supplementary Tables 1 and 2. While the FFQ was used for initial dietary grouping to increase the likelihood of identifying individuals with contrasting iodine intakes and to minimise participant burden by reducing the number of required 24 h urine collections, final participant classification was based on 24 h UIE collected on study day 1 to ensure a more objective and accurate categorisation of iodine status. Concordance between initial FFQ-based grouping and final classification based on 24 h UIE was subsequently assessed descriptively.
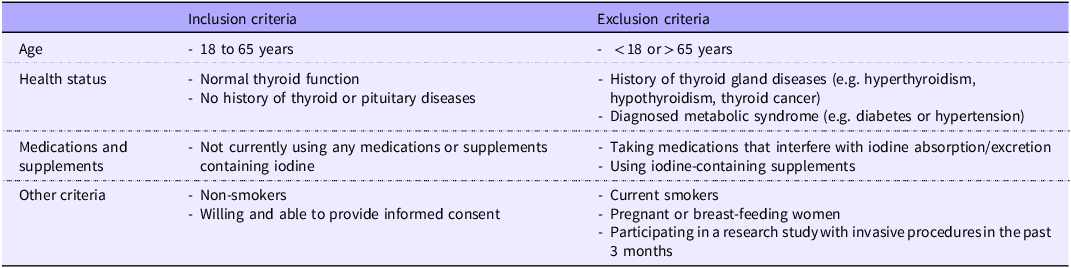
Participants who met the inclusion criteria (Table 1) were then asked to complete a 24 h food diary for a randomly chosen day using ‘Intake24’(19), to assess current iodine intake. ‘Intake24’ is an online, self-administered 24 h dietary recall system developed for nutritional surveys in the UK. It guides participants through a structured, multi-pass recall of all foods and drinks consumed during the day, using an interface designed to mimic interviewer-led surveys. Potential participants attended screening appointments and were assigned unique ID numbers by an independent researcher to maintain anonymity. Those selected for inclusion in the study were given a £50 voucher upon the completion of the final sample collection.
Inclusion and exclusion criteria

Table 1 Long description
A table comparing inclusion and exclusion criteria for a study. The table has four rows and three columns. The columns are labeled 'Inclusion criteria', 'Exclusion criteria', and 'Age'. The rows are labeled 'Age', 'Health status', 'Medications and supplements', and 'Other criteria'. Row 1: Age, Inclusion criteria: 18 to 65 years, Exclusion criteria: less than 18 or greater than 65 years. Row 2: Health status, Inclusion criteria: Normal thyroid function, No history of thyroid or pituitary diseases, Exclusion criteria: History of thyroid gland diseases (e.g., hyperthyroidism, hypothyroidism, thyroid cancer), Diagnosed metabolic syndrome (e.g., diabetes or hypertension). Row 3: Medications and supplements, Inclusion criteria: Not currently using any medications or supplements containing iodine, Exclusion criteria: Taking medications that interfere with iodine absorption/excretion, Using iodine-containing supplements. Row 4: Other criteria, Inclusion criteria: Non-smokers, Willing and able to provide informed consent, Exclusion criteria: Current smokers, Pregnant or breast-feeding women, Participating in a research study with invasive procedures in the past 3 months.
Note: Inclusion and exclusion criteria were assessed using a self-reported health and lifestyle questionnaire completed during initial screening.
Screening session
The pre-study screening for eligible participants was conducted at the Clinical Skills Lab, on the Sutton Bonington campus of the University of Nottingham. During the screening visit, we provided a comprehensive explanation of the study procedures. Anthropometric measurements (body weight, height, waist and hip circumference) were obtained for each participant. Body composition was assessed using bioimpedance (Tanita, MC-780MA P). A copy of the signed consent form was provided to each participant, and the original signed form was retained securely at the study site.
Each volunteer then received a study pack. This pack included two 4-litre iodine-free plastic containers (Scientific Laboratory Supplies, CON2062) for the collection of 24 h urine samples, six 100 mL sterile cups with lids (Sarstedt, 75·562·300) for spot urine collection and six sterile screw-cap polypropylene tubes (Greiner Bio-One, 188 261) for saliva sample collection. To maintain participant anonymity, their assigned ID number was used on all documents instead of names. All documents were sealed in envelopes for secure handling and storage.
Study protocol
Participants collected spot urine and unstimulated saliva samples simultaneously at three separate time points on day 1 (2 h after each of the three main meals), along with a 24 h urine collection, starting just before breakfast on day 1 and ending at the same time on day 2. The first void of urine after waking up on day 1 was discarded, marking the start of the 24 h urine collection. On the following day, they adhered to a low-iodine diet for 24 h. Details of foods rich in iodine that were to be excluded to achieve a low-iodine diet were provided verbally, using text and image references (Supplementary Table 3 and Figure 1). Participants then repeated the same sampling procedures as on day 1 (Figure 1). Participants were instructed not to drink or brush their teeth immediately prior to saliva collection. They were also instructed to refrain from physical activity during the study days and asked to drop off their samples in a designated collection box on each collection day.
Study protocol.

To calculate iodine intakes over the study days, participants recorded their dietary intakes using ‘Intake24’, which had also been used at baseline for screening purposes(19). Dietary data were then extracted into Excel. As the ‘Intake24’ software occasionally overestimated iodine values for certain items (e.g. assuming all plant-based alternative milks were fortified unless otherwise specified), we applied manual corrections to improve accuracy. Specifically, plant-based milks were considered unfortified unless brand or fortification details were provided, and iodine contents for vegan substitutes not listed in the database (fourteen items; Supplementary Table 4) were estimated using Nutritics software(20) or nutritional information from product packaging.
Laboratory analysis
Iodine concentration
The analysis of iodine concentration in urine and iodide in saliva samples was conducted at the Elemental Analysis Facility, School of Biosciences, University of Nottingham, using inductively coupled plasma-mass spectrometry (ICP-MS; iCAP TQ, Thermo Fisher Scientific). Both samples were centrifuged (2000 rpm) at 20°C for 5 minutes using a GT4R centrifuge (Thermo Fisher Scientific). One millilitre of each supernatant was diluted 1:10 (v/v) in a 1 % (w/v) tetramethylammonium hydroxide (TMAH; Thermo Fisher Scientific, R14G028) solution, mixed thoroughly, stored at room temperature and analysed within 2 weeks of preparation. The limit of detection and limit of quantification for iodine measured by ICP-MS were 0·039 μg/l and 0·131 μg/l, respectively, determined from repeated measurements of twenty-four procedural blanks. All urinary and salivary iodine concentrations measured in this study were above the limit of detection; therefore, no imputation of values below the limit of detection was required.
Only 24 h urine samples were analysed in duplicate as part of internal quality verification procedures. These replicates were run across six analytical batches, and the mean CV calculated across participants within each batch was approximately 2·4 %, ranging from 1·6 to 3·2 %, indicating high within-batch analytical precision. Approximately 50 mL of urine and the remaining saliva samples were stored at −80°C for further analyses.
We used freeze-dried human urine (Seronorm Trace Elements Urine L-2, Ref No. 210 705) as a standardised reference material (certified iodine mean content of 297 μg/l [95 % CI: 237–356 μg/l]). In this study, the measured concentrations for the reference material ranged from 296 to 323 μg/l (mean ± sd: 309·71 ± 10·16 μg/l), which fell within the certified range.
Creatinine concentration
The concentration of creatinine (Cr; mg/dl) was determined to enable normalisation of urinary iodine (UI/Cr) for urine dilution in all urine samples using the Jaffe reaction according to previously published protocols(Reference Jaffe21, Reference Moore and Sharer22). Prior to analysis, all urine samples were diluted at a ratio of 1:10 with ultrapure H2O (PURA-Q2, SLS Lab Pro). Each diluted sample was measured in triplicate. For 24 h urine samples, measurements were additionally made on three separate plates. Absorbance readings were taken at 550 nm using a BIO-RAD microplate reader (680 XR, Japan).
Protein concentration
To account for variations in water content potentially caused by salivary gland stimulation, the SIC was not only presented in μg/l but also normalised relative to salivary protein secretions (SI/P; μg/g). The concentration of total protein in saliva samples was determined using the Lowry assay(Reference Lowry, Rosebrough and Farr23). Prior to analysis, saliva samples were diluted at a ratio of 1:10 with ultrapure H2O (PURA-Q2, SLS Lab Pro, UK). Each diluted sample was measured in triplicate. Absorbance readings were taken at 655 nm using a BIO-RAD microplate reader (680 XR, Japan). The unit of measurement for protein concentration is milligrams per millilitre (mg/ml). The SI/P value was calculated by converting salivary protein from mg/ml to grams per litre (g/l), and then dividing the SIC (μg/l) by the salivary protein concentration (g/l).
Iodine status
Iodine status was described with reference to WHO population-level criteria for UIC(24). For the purposes of this proof-of-concept study, participants were classified using 24 h UIE thresholds (<100 or ≥100 µg/day) as a pragmatic approach to distinguish lower v higher iodine status at the individual level. UIE was calculated by multiplying the 24 h UIC (μg/l) by the total 24 h urine volume (L). The urinary iodine-to-creatinine ratio (UI/Cr) was also calculated by converting creatinine from mg/dl to g/l and dividing UIC (µg/l) by creatinine (g/l).
Sample size calculation
To our knowledge, no published data were available linking SIC or SI/P with the gold-standard biomarker, 24 h UIE. Consequently, there was no direct evidence to guide sample size estimation for this study. We therefore referred to two previously published datasets. The first study compared SIC between healthy individuals and patients with dental caries(Reference Gulaboglu, Akgul and Akgul25), reporting mean (±sd) values of 83 ± 28 µg/l and 44 ± 22 µg/l, respectively. These data corresponded to an estimated effect size (Cohen’s d) of 1·55, indicating that 8 participants per group (n 16) would provide 80 % power at α = 0·05. Sample size calculations were performed using GPower software (version 3·1). The second study reported SI/P values for healthy volunteers stratified by 24 h UIE (<150 v ≥ 150 µg/d)(Reference Dekker, Touw and van der Horst-Schrivers15), with medians (interquartile range (IQR)) of 199 (140–260) µg/g and 421 (236–452) µg/g, respectively. sd were approximated from IQR using the formula sd = IQR/1·35(Reference Chi, Li and Chen26), resulting in sd of 88·9 and 160 µg/g. This gave an estimated effect size (Cohen’s d) of approximately 1·7, requiring a minimum of seven participants per group (n 14) for 80 % power at α = 0·05. Although these populations are not directly comparable, this approach provided a pragmatic, data-driven benchmark for planning this proof-of-concept study, with additional recruitment to account for potential dropouts.
Statistical analysis
The IBM Statistical Package for Social Science (version 27·0·1·0; IBM SPSS Statistics) was used for conducting data analysis, and GraphPad Prism (version 10·0·2; GraphPad Software Inc.) was used to draw graphs. A significance level of P < 0·05 (two-tailed) was chosen for all statistical analyses. For each variable in this study, the first quartile (Q1) and the third quartile (Q3) were calculated to determine the interquartile range (IQR) and identify extreme outliers, using the outer fences which were defined as Q3 + 3 × IQR for the upper fence and Q1–3 × IQR for the lower fence. Data points beyond these thresholds were regarded as extreme outliers and were not included in the analyses. Following the removal of extreme values, a normality test was performed using the Shapiro–Wilk test. Summary statistics are presented as medians and IQR because the majority of the data were not normally distributed.
Categorical data were summarised by frequencies and percentages. Spearman’s rank correlation was computed to assess the associations due to skewed data and small sample sizes. Fisher’s exact test was reported for dichotomous categorical variables and Fisher–Freeman–Halton exact test for trichotomous or polytomous categorical variables. The differences in the median data between the two groups were compared using the non-parametric Mann–Whitney U test. To estimate the strength of the observed differences, effect sizes were calculated using the standardised test statistic (Z) derived from the Mann–Whitney U test. Specifically, the effect size r was computed using the formula r = Z /√ n, where n is the total sample size. Effect sizes were interpreted according to conventional thresholds, with r values of approximately 0·1, 0·3 and 0·5 representing small, medium and large effects, respectively.
To evaluate changes in measurements across two consecutive days within the same group, we applied the Wilcoxon signed-rank test. Intra-individual variability in iodine biomarkers across multiple time points within the same day was assessed by calculating the coefficient of variation (%CV) for each participant. This was done for spot SI/P and spot UIC across the three postprandial samples collected on day 1 (habitual iodine intake) and day 2 (low-iodine diet). The %CV was computed as the sd divided by the mean for each participant’s three measurements, expressed as a percentage. These values were then summarised by group and study day to compare variability between biological matrices and dietary conditions.
To evaluate the diagnostic potential of spot SI/P and UIC, participants were categorised into iodine-deficient and iodine-adequate groups based on 24 h UIE on study day 1. Separate ROC curve analyses were conducted for each postprandial time point (post-breakfast, post-lunch and post-dinner) to assess the ability of SI/P and UIC to distinguish between these groups. For each time point, two samples per participant (one from each study day) were included, providing a total of fifty-two samples (twenty-six participants × two study days). The AUC was calculated for each time point and biomarker, and optimal cut-off values were determined using the Youden index [(sensitivity + specificity) − 1].
Results
Study participants
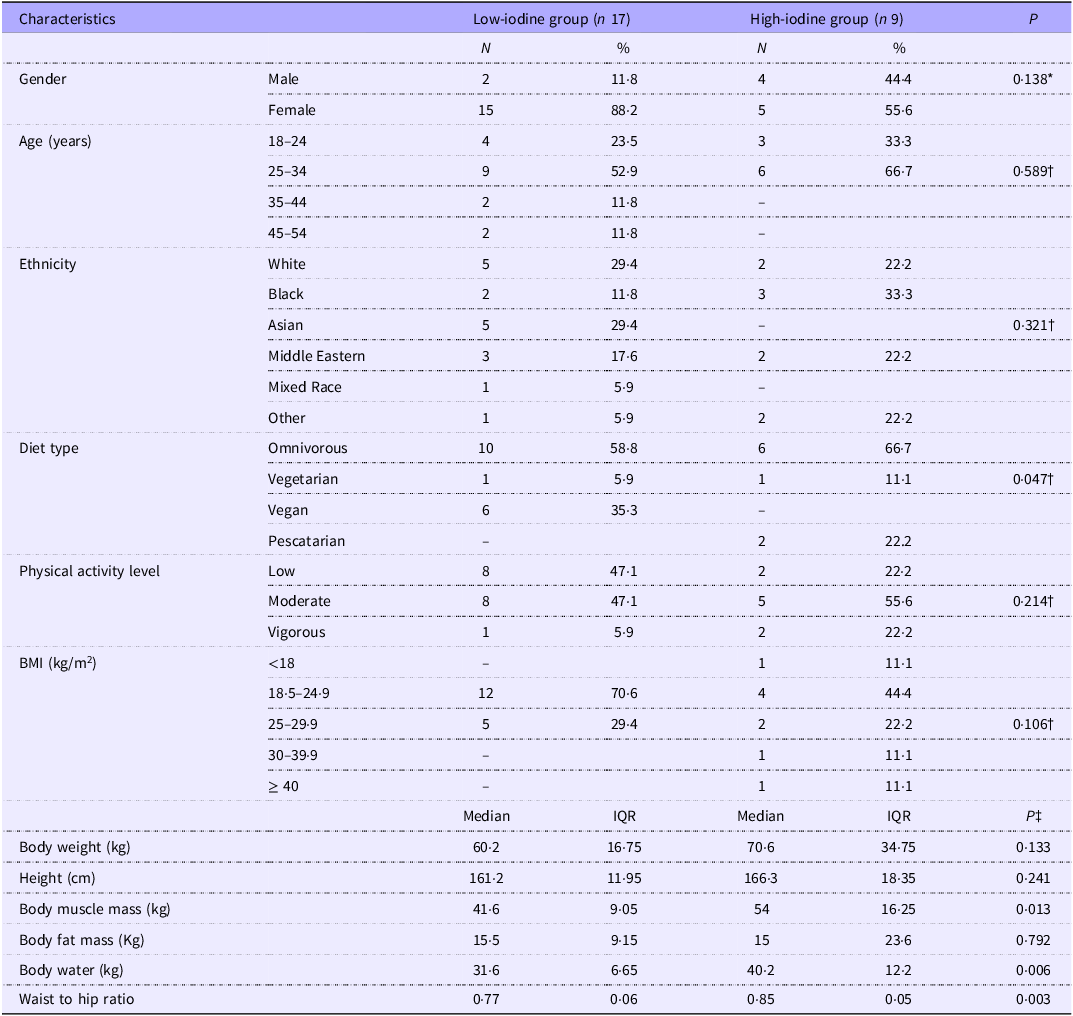
A total of seventy-eight participants initially completed the online survey. Of these, thirty-seven were deemed ineligible for various reasons, leaving forty-one eligible participants (Figure 2). Based on their estimated iodine intake assessed via FFQ, these eligible participants were divided into two groups: Twenty-seven participants in the high-iodine intake group (intake > 140 µg/d) and fourteen participants in the low-iodine intake group (intake < 70 µg/day). All eligible participants were invited to a screening session; however, nine participants from the high-iodine intake group and two participants from the low-iodine intake group did not respond to the invitation. Following screening, two participants, one from the high-iodine group and one from the low-iodine group withdrew, leaving seventeen in the high-iodine group and eleven in the low-iodine group. Final group classification was based on the 24 h UIE levels on study day 1, resulting in experimental groups containing seventeen participants for low-iodine (excretion < 100 µg/d) and nine for high-iodine (excretion ≥ 100 µg/d). Comparison of initial FFQ-based grouping with final classification based on 24 h UIE showed that twelve out of twenty-six participants (46 %) changed category following biochemical assessment. The baseline characteristics of study participants (n 26) are summarised in Table 2.
Recruitment and participant categorisation flowchart. UIE, urinary iodine excretion.

Iodine intake and status
After separation into low and high groups, there was no statistically significant difference in median iodine intake (by FFQ) between the two groups (163·12 [IQR 168·51] μg/d v. 257·44 [IQR 245·36] μg/d, respectively; P = 0·085, r = 0·344; Figure 3). Similarly, iodine intake assessed by food diaries recorded on a random day (FD-RD) and study day 1 (FD-D1) (FD-RD = 41·43 [IQR 97·22] μg/d v. 87·08 [IQR 97·25] μg/day, respectively; P = 0·201; FD-D1 = 50·12 [IQR 91·56] μg/d v. 81·61 [IQR 162·23] μg/d, respectively; P = 0·559). Both groups adhered to a low-iodine diet on day 2 and consumed similar amounts. In addition to iodine intake, broader dietary comparisons between groups, including total energy, macronutrients and key micronutrients, were examined. No significant differences were observed, and full results are available in Supplementary Table 5. Full descriptive statistics for iodine intake, urinary biomarkers and salivary biomarkers across study days are provided in Supplementary Tables 6 and 7.
Iodine intake assessed by FFQ, food diaries on a random day (FD-RD), study day 1 (FD-D1), and study day 2 (FD-D2) for the low urinary iodine excretion (UIE < 100 µg/d; n 17) and high UIE (≥ 100 µg/d; n 9) groups. The shaded area represents iodine intakes below the reference nutrient intake (RNI) of 140 μg/d. There were three participants with missing FD-RD data in the low UIE group. Differences between the group medians were assessed using the Mann–Whitney U test. # indicates significant within-group comparisons between days 1 and 2, assessed using the Wilcoxon signed-rank test. On average, iodine intake decreased by 52 % in the low UIE group (P = 0·002) and 76 % in the high UIE group (P = 0·004) from day 1 to day 2. The plus sign (+) represents the mean value. One extreme outlier was identified in the low UIE group on study day 1 (FD-D1; intake = 419·65 µg/d). However, its removal did not influence statistical outcomes (Before removal: P = 0·559, After removal: P = 0·751).

UIE on day 1 was significantly elevated in the high-iodine group compared with low-iodine (P < 0·001, r = 0·809; Figure 4c). Similarly, iodine concentrations, both uncorrected and corrected for creatinine, were significantly higher in the high-iodine group (uncorrected: P = 0·025, r = 0·439; corrected: P = 0·032, r = 0·430; Figure 4 (a) and (b)). Adherence to a low-iodine diet for 24 h (day 2) resulted in a 37 % decrease in UIE in the high-iodine group (P = 0·004), while for low iodine, there was no difference in excretion level. Absolute UIC did not differ in either group between days 1 and 2, but after correction for creatinine, the UI/Cr fell in both groups (low-iodine 47 % drop, P = 0·005; high-iodine 61 % drop, P = 0·016; Figure 4b).
Urinary iodine in 24 h samples from the low urinary iodine excretion (UIE < 100 µg/d; n 17) and high UIE (≥ 100 µg/d; n 9) groups. (a) 24 h urinary iodine concentration (24 h UIC) on day 1 and day 2. (b) 24 h urinary iodine-to-creatinine ratio (24 h UI/Cr) on day 1 and day 2. (c) 24 h urinary iodine excretion (24 h UIE) on day 1 and day 2. Differences between the group medians were assessed using the Mann–Whitney U test. # indicates significant within-group comparisons between days 1 and 2, assessed using the Wilcoxon signed-rank test. Plus sign (+) represents the mean value. In panel B, one extreme outlier was identified in the low UIE group on day 1 (689·95 µg/g Cr). Its removal resulted in a shift from a non-significant to a statistically significant difference between groups (Before: P = 0·075, After: P = 0·032). Two additional outliers in the high UIE group on day 2 (229·15 and 163·16 µg/g Cr) had no effect on the overall statistical outcome (Before: P = 0·133, After: P = 0·494). *P = <0·05, ***P = <0·001.

Spot sample assessments of iodine status
Spot urine measurements
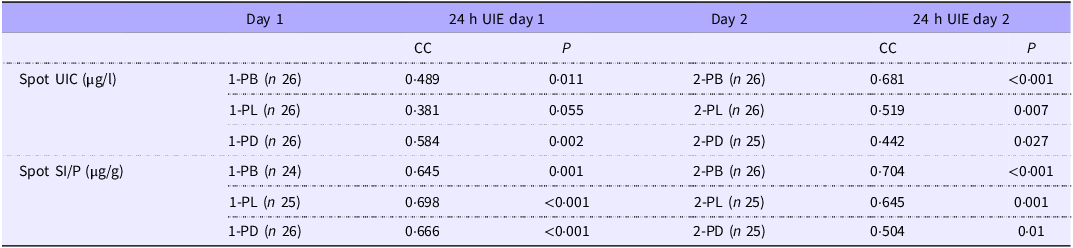
The median UIC in spot urine samples showed limited ability to discriminate between iodine groups. On day 1, UIC was higher in the high-iodine group at all sampling times; however, this difference reached statistical significance only post-dinner (156·15 [IQR 110·09] v. 36·63 [62·86] μg/l; P = 0·009, r = 0·502), while no significant differences were observed post-breakfast (117·15 [129·25] v. 41·02 [93·89] μg/l; P = 0·220) or post-lunch (91·83 [182·03] v. 66·71 [73·26] μg/l; P = 0·148) (Figure 5a). Following 24 h dietary iodine restriction (day 2), spot UIC values decreased in both groups, and no significant between-group differences were observed at post-breakfast (92·27 [154·46] v. 48·09 [85·48] μg/l; P = 0·107), post-lunch (46·98 [136·30] v. 37·40 [59·95] μg/l; P = 0·312) or post-dinner (42·07 [41·60] v. 31·35 [42·43] μg/l; P = 0·315) (Figure 5b). We additionally measured creatinine concentration in all spot urine samples and repeated the analyses detailed above. Creatinine concentrations did not significantly differ between groups on either day (Supplementary Table 6 and 7), and the UI/Cr ratios showed similar results to UIC alone at all time points (Supplementary Figure 2). Under conditions of ‘normal’ iodine consumption (day 1), we found relatively poor, but nonetheless significant (P < 0·05) or almost significant (P = 0·055), correlations between UIC and UIE for the combined population at all time points, respectively (Table 3). Consumption of low-iodine diets (day 2) resulted in a significant association between spot UIC and UIE at all time points (Table 3). Conversely, there were fewer significant correlations between UI/Cr ratios and UIE compared with UIC to UIE on day 1 and a complete loss of any association between UI/Cr and UIE at all time-points on day 2 (Supplementary Table 8).
Spot urine and saliva samples from the low urinary iodine excretion (UIE < 100 µg/d; n 17) and high UIE (≥ 100 µg/d; n 9) groups. (a) Spot urinary iodine concentration measured 2 hours post breakfast (1-PB), lunch (1-PL) and dinner (1-PD) day 1. (b) Spot urinary iodine concentration measured 2 hours post breakfast (2-PB), lunch (2-PL) and dinner (2-PD) on day 2. (c) Spot salivary iodide-to-protein ratio measured two hours post breakfast (1-PB), lunch (1-PL) and dinner (1-PD) on day 1. (d) Spot salivary iodide-to-protein ratio measured 2 hours post breakfast (2-PB), lunch (2-PL) and dinner (2-PD) on day 2. A spot saliva sample was missing for one post-breakfast measurement in the low UIE group on day 1. Differences between the group medians were assessed using the Mann–Whitney U test. The plus sign (+) represents the mean value. In panel B, one outlier was identified in the high UIE group post dinner (2-PD: 247·01 µg/l), and its removal had no effect on statistical significance (p > 0·05). In panel C, an outlier in the low UIE group post breakfast (1-PB: 302·26 µg/g) shifted the result from borderline to statistically significant (before: P = 0·074, after: P = 0·03). Another outlier at 1-PL (low UIE group: 122·36 µg/g) slightly strengthened the significance (before: P = 0·011, after: P = 0·003). In panel D, outliers at 2-PL (low UIE group: 147·16 µg/g) and 2-PD (high UIE group: 193·95 µg/g) did not alter the significance of the results (2-PL: P < 0·001 both before and after; 2-PD: before: P = 0·018, after: P = 0·043). *P = < 0·05, **P = < 0·01, ***P = < 0·001.

Baseline characteristics of study participants

Table 2 Long description
A table comparing characteristics of participants in low-iodine and high-iodine groups. The table has 17 rows and 7 columns. The columns are labeled Characteristics, Low-iodine group (n 17) N, Low-iodine group (n 17) percent, High-iodine group (n 9) N, High-iodine group (n 9) percent, and P. The rows are labeled Gender, Age (years), Ethnicity, Diet type, Physical activity level, BMI (kg per square meter), Body weight (kg), Height (cm), Body muscle mass (kg), Body fat mass (kg), Body water (kg), and Waist to hip ratio. Each row provides data for the low-iodine and high-iodine groups, including the number of participants (N), percentage (percent), and P value. The table includes various characteristics such as gender, age, ethnicity, diet type, physical activity level, BMI, body weight, height, body muscle mass, body fat mass, body water, and waist to hip ratio. Notable trends include differences in gender distribution, diet type, and physical activity level between the two groups.
Values are presented as numbers (percentages) or median (Mdn) and interquartile range (IQR).
P < 0.05 indicates statistical significance.
* P value of Fisher’s exact test was reported.
† P value of Fisher–Freeman–Halton exact test was reported.
‡ P value of the Mann–Whitney test was reported.
Spot saliva measurements
Saliva samples more consistently reflected typical iodine status than spot UIC. On day 1, SI/P concentrations were significantly higher in the high-iodine group than in the low-iodine group at all sampling times: post-breakfast (61·28 [IQR 162·75] v. 27·89 [34·30] μg/g; P = 0·030, r = 0·444), post-lunch (71·03 [40·87] v. 27·40 [22·87] μg/g; P = 0·003, r = 0·577) and post-dinner (114·13 [151·42] v. 31·58 [34·55] μg/g; P = 0·002, r = 0·587). A similar pattern was observed on day 2, with higher SI/P in the high-iodine group at post-breakfast (81·86 [73·99] v. 26·51 [26·78] μg/g; P = 0·013, r = 0·481), post-lunch (54·56 [86·15] v. 18·83 [13·29] μg/g; P < 0·001, r = 0·691) and post-dinner (38·20 [32·16] v. 18·79 [19·60] μg/g; P = 0·043, r = 0·408) (Figure 5(c) and (d)). In addition, SI/P showed a stronger association with UIE than spot UIC across all time-points on both study days (Table 3). Intra-individual variability, expressed as the % CV, was assessed for spot SI/P and spot UIC across the three samples collected on each study day. The SI/P exhibited lower variability than spot UIC across both days. The mean %CV for SI/P was 38·6 % on day 1 and 41·1 % on day 2, compared with 53·3 % and 52·4 % for UIC, respectively. When stratified by iodine group, SI/P consistently showed lower intra-individual variability than spot UIC. For the low-iodine group, the %CV for SI/P ranged from 34·0 % (day 1) to 39·1 % (day 2) compared with 53·3 % (day 1) and 54·2 % (day 2) for UIC. Similarly, for the high-iodine group, the %CV for SI/P ranged from 43·4 % (day 1) to 45·0 % (day 2), while UIC values ranged from 48·9 % (day 2) to 53·2 % (day 1).
Diagnostic potential of salivary iodide as a biomarker for iodine adequacy
Given the proof-of-concept nature of the study and the small sample size, ROC analyses were undertaken to explore the potential diagnostic utility of SI/P for distinguishing iodine-deficient from iodine-adequate individuals, as defined by 24 h UIE, rather than to establish definitive clinical cut-off values. SI/P demonstrated the strongest discriminative power after lunch, with an AUC of 0·891 (95 % CI: 0·791–0·991; P < 0·0001). The optimal cut-off value at this time point was 44·03 μg/g, yielding a sensitivity of 0·833, specificity of 0·906 and a Youden index of 0·74. Post-dinner samples also showed good diagnostic utility (AUC = 0·791; 95 % CI: 0·661–0·921; P < 0·0001; cut-off = 33·53 μg/g; sensitivity = 0·765; specificity = 0·706; Youden index = 0·47), followed by post-breakfast (AUC = 0·781; 95 % CI: 0·647–0·915; P < 0·0001; cut-off = 81·12 μg/g; sensitivity = 0·500; specificity = 0·937; Youden index = 0·44) (Figure 6a–c). In contrast, spot UIC exhibited consistently lower diagnostic performance. The highest AUC for UIC was observed post-dinner (AUC = 0·718; 95 % CI: 0·571–0·865; P = 0·004), with an optimal cut-off of 98·94 μg/l) sensitivity = 0·412, specificity = 0·941; Youden index = 0·35). Post-breakfast and post-lunch AUC were 0·681 (95 % CI: 0·532–0·831; P = 0·017) and 0·649 (95 % CI: 0·485–0·812; P = 0·074), respectively, with corresponding Youden indices of 0·34 and 0·29 (Figure 6d–f). Correction of UIC for creatinine (UI/Cr) did not improve its ability to predict iodine status (data not shown).
Receiver operating characteristic (ROC) curves evaluating the diagnostic performance of the salivary iodide-to-protein ratio (SI/P; µg/g) and spot urinary iodine concentration (UIC; µg/l) in identifying iodine adequacy, with 24 h urinary iodine excretion (UIE) on Day 1 used as the reference standard (cut-off: 100 µg/day). (a–c) ROC curves for SI/P collected after breakfast, lunch and dinner, respectively. (d–f) ROC curves for spot UIC collected at the same postprandial time points. The area under the curve (AUC) is displayed on each plot. SI/P consistently outperformed UIC across all time points, with the highest diagnostic accuracy observed after lunch (AUC = 0·891).

Discussion
This study provides the first demonstration that SI/P accurately reflects recent iodine intake, as indicated by 24 h UIE and can discriminate between individuals with low and adequate iodine status. Previous studies linking salivary iodide with status from 24 h UIE are confined to comparisons between healthy participants and patients with dental caries(Reference Gulaboglu, Akgul and Akgul25), or two sets of participants with different intakes but which all consume above the reference nutrient intake for iodine intake(Reference Dekker, Touw and van der Horst-Schrivers15). In this study, we show a clear difference in SI/P between those above and below the reference nutrient intake level, which is superior to urine (either alone or corrected for creatinine) and which shows promise for confirming whether an individual is at risk of iodine deficiency. Unlike spot UIC, which is primarily used for population-level surveillance, SI/P consistently differentiated iodine status across multiple time points and under both habitual and restricted iodine intake conditions. It also showed stronger correlations with 24 h UIE, lower intra-individual variability and superior diagnostic accuracy based on ROC analysis. These findings support the potential of SI/P as a promising, non-invasive biomarker for individual-level iodine assessment; however, validation in larger, more diverse populations is still needed.
Salivary iodide as a reliable biomarker
It is well established that saliva contains iodide(Reference Venturi and Venturi9), a finding attributed to the expression of the sodium-iodide symporter (SLC5A5), which in salivary glands is thought to be constitutive(Reference De la Vieja, Dohan and Levy10,Reference Portulano, Paroder-Belenitsky and Carrasco11) . This consistent expression suggests that SIC mirror interstitial fluid levels offer a potential indicator of systemic iodine status. Several studies have confirmed this, demonstrating that salivary iodide is a useful biomarker for assessing iodine status across different groups(Reference Alsaeedi, Rose and Welham12, Reference Wang, Tayier and Nie27), with a few studies reporting moderate discriminatory performance, with AUC values around 0·75, indicating reasonable accuracy in distinguishing iodine deficiency or excess(Reference Zhang, Li and Wang13, Reference Guo, Pan and Zhang28). However, rate of saliva flow varies from person to person(Reference Affoo, Foley and Garrick29), influencing iodide concentration through dilution, which supports the idea that correcting for flow may enhance diagnostic accuracy. Correction of SIC with protein was used in one study to demonstrate differences in the SI/P between people considered iodine replete (24 h UIE ≥ 150 µg/day) and those who were not (24 h UIE < 150 µg/d; 421 µg/g and 199 µg/g, respectively)(Reference Dekker, Touw and van der Horst-Schrivers15), but the predictive capability of SI/P values for iodine status was not assessed.
In the current study, we evaluated the additional impact of protein correction and found that this adjustment improved the interpretability and consistency of salivary iodide measurements across all sampling times. SI/P was shown to consistently reflect 24 h UIE, whereas uncorrected SIC was less reliable at certain time points (e.g. post-breakfast on Day 1 and post-dinner on Day 2). When evaluating diagnostic accuracy using ROC analysis, the strongest performance was observed in post-lunch samples: SI/P achieved an AUC of 0·89 (Youden index = 0·74), compared with 0·81 (Youden index = 0·58) for uncorrected SIC. Therefore, although the absolute improvement in diagnostic performance (as indicated by AUC) may seem modest numerically, the clinical relevance lies in the consistent predictability of SI/P across all sampling times – a key advantage over both SIC and UIC. The continued production of saliva with elevated iodide concentrations in the high-iodine group after consuming a minimal dietary iodine for 24 h indicates a potentially different level of expression in salivary glands of SLC5A5 in high-iodine v. low-iodine individuals. This potentially implies that there may be novel regulatory mechanisms mediating salivary gland SLC5A5 expression influenced by circulating iodide levels; however, this requires further study.
Challenges in urinary iodine measurement for assessing iodine status
Spot urinary iodine measurement is a well-established method for assessing iodine status over short periods due to its low cost, simplicity and ease of collection(Reference Zimmermann, Jooste and Pandav6). However, individual iodine intake, and consequently spot UIC, can fluctuate significantly from day to day and during the course of the day, making spot samples unreliable for assessing individual iodine status. Therefore, 24 h urine collections provide a more accurate estimation of iodine intake(Reference Zimmermann, Jooste and Pandav6). While non-invasive, the acceptability of urine collection for iodine status assessment is an important factor in its widespread use, and the process of collecting urine over a 24 h period is logistically demanding and requires participants to follow strict instructions, such as timing collections accurately and ensuring no missed samples. As a result, these practical difficulties can introduce variability into the results, making it harder to accurately assess iodine status. Alternative biomarkers, such as salivary iodide, may therefore offer better compliance, easier collection and more reliable assessments of iodine status.
While urinary iodine measurement is widely used as a primary tool to estimate iodine intake, its reliability is influenced by factors such as hydration status(Reference Remer, Fonteyn and Alexy30). Creatinine acts as an indicator of hydration levels and potential urine dilution(Reference Arndt31). Therefore, correcting urine samples with creatinine partially addresses this variability. However, the WHO indicated that this approach is unreliable(32), and that estimating daily iodine excretion from spot samples using creatinine may not be accurate, particularly in malnourished individuals(Reference Zimmermann33). In our study, the excreted creatinine in 24 h was 0·96 [IQR 0·56] g in the high-iodine group on a typical diet, compared with 0·46 [IQR 0·54] g in the low-iodine group (P = 0·029). This aligns with recent research showing dietary influences on creatinine levels(Reference Abraham, Penczynski and Monien8), which reported that vegans excrete significantly less creatinine over 24 h compared with omnivores (1·21 g/24 h v. 1·51 g/24 h, respectively; P = 0·009), and their urinary creatinine concentrations were also lower (53·5 mg/dl v. 72·0 mg/dl, respectively; P = 0·012).
Creatinine concentrations (mg/dl) in our study whilst higher in the high-iodine group on a typical diet were not significantly different to those from the low-iodine group (P = 0·458). This highlights the difficulty in reliance upon urinary creatinine as an indicator of dilution, particularly in light of the significant variation in urine volumes which ranged from 0·6 L to 4·4 L. Urine volumes in the high-iodine group were almost double those of the low-iodine group (2·0 L v. 1·2 L; P = 0·066), which will undoubtedly have had an influence on iodine concentrations. The lack of a reliable marker for dilution in urine samples further highlights the importance of the need for a suitable alternative biomarker to be considered. In the current study, both uncorrected and creatinine-corrected spot UIC were significantly higher in the high-iodine group at only one of six time points (post-dinner on Day 1(. ROC analysis further demonstrated their lower discriminative power compared with SIC and SI/P, reflecting their limited ability to distinguish between iodine-deficient and iodine-adequate individuals. This aligns with findings from a systematic review, which reported limited evidence supporting the accuracy of spot urinary samples in reflecting daily iodine intake compared with 24 h UIE(Reference Ji, Lu and Dary34).
Study limitations
This study has several limitations. Participant grouping strategy excluded individuals with intermediate iodine intakes (70–140 μg/day). While this approach was adopted to enhance group separation and identify differences, if they existed, between extreme groups (i.e. high v. low-iodine status), this will likely have led to an overestimation of test performance. Inclusion of individuals with intermediate iodine intakes would likely reduce the observed discriminative performance of the ROC analyses by increasing overlap between groups. Future studies will include a broader range of intake levels to better reflect real-world dietary variation. In addition, the lack of a statistically significant difference in FFQ-estimated iodine intake between groups may reflect known limitations of FFQ, including potential under-reporting and imprecision in estimating iodine intake from mixed food sources. However, FFQ data were used only for initial dietary screening, while final group classification was based on 24 h UIE. Similarly, dietary iodine intake during study days was estimated using short-term 24 h dietary recalls, which may not fully capture habitual iodine intake. Study duration was short, which limited the ability to assess long-term adaptations to iodine restriction or the stability of biomarkers over time. Sample size was relatively small, and the study population consisted predominantly of university-educated adults, which limits the statistical power and generalisability of the findings to the wider UK adult population. While the sample was sufficient for a proof-of-concept investigation, larger-scale studies are required for full biomarker validation. Despite these limitations, a major strength of this study is its direct comparison of urinary and salivary biomarkers under defined iodine status (i.e. high v. low iodine).
Conclusions
SI/P appears to be a more reliable biomarker of iodine status than spot UIC, particularly at the individual level. Unlike UIC, which is primarily suited for population-level surveillance, SI/P demonstrated consistent performance across varying dietary conditions and sampling times, raising its potential use for assessment of status in individuals, with fewer repeat samples. The consistent elevation of salivary iodide in high-iodine individuals following short-term dietary restriction suggests a potentially novel regulatory mechanism of SLC5A5 expression in the salivary glands. Furthermore, saliva collection is generally more acceptable to participants than urine collection, which may enhance compliance and broaden assessment coverage. However, work is still needed to validate these findings in larger, more diverse populations and to investigate the feasibility of incorporating salivary iodide testing into routine iodine monitoring programmes.
Spearman’s correlation between 24 h UIE and spot urine and saliva samples collected on day 1 and day 2 in both groups

Table 3 Long description
The table presents data on spot UIC and spot SI/P levels measured on Day 1 and Day 2, with 24-hour urine iodine excretion (UIE) measurements taken after each day. The table is divided into two main sections: Spot UIC and Spot SI/P, each with measurements taken at different times of the day. The table has 8 rows and 8 columns. Column headers are Day 1, 24 h UIE day 1, Day 2, and 24 h UIE day 2. Each of these columns is further divided into CC and P. Row labels include 1-PB, 1-PL, 1-PD, 1-PB, 1-PL, and 1-PD, with sample sizes indicated in parentheses. The values in the table represent correlation coefficients and p-values for the comparisons between the groups. Row 1: 1-PB (n 26), CC 0.489, P 0.011, 2-PB (n 26), CC 0.681, P less than 0.001. Row 2: 1-PL (n 26), CC 0.381, P 0.055, 2-PL (n 26), CC 0.519, P 0.007. Row 3: 1-PD (n 26), CC 0.584, P 0.002, 2-PD (n 25), CC 0.442, P 0.027. Row 4: 1-PB (n 24), CC 0.645, P 0.001, 2-PB (n 26), CC 0.704, P less than 0.001. Row 5: 1-PL (n 25), CC 0.698, P less than 0.001, 2-PL (n 25), CC 0.645, P 0.001. Row 6: 1-PD (n 26), CC 0.666, P less than 0.001, 2-PD (n 25), CC 0.504, P 0.01. The table shows the correlation coefficients and p-values for the comparisons between the groups at different time points and under different conditions of iodine intake.
CC, correlation coefficient; correlations were calculated using the full sample (low- and high-iodine groups combined). Spot urinary iodine concentration (UIC) and salivary iodide to protein ratio (SI/P); collected 2 h post breakfast on the first (1-PB) and second day (2-PB), 2 h post lunch on the first (1-PL) and second day (2-PL) and 2 h post dinner on the first (1-PD) and second day (2-PD); 24 h UIE, urinary iodine excretion over 24 h. One spot saliva sample was missing for a post-breakfast measurement on day1. Table values reflect correlations after the removal of extreme outliers. Only one outlier per some variables was excluded. Prior to exclusion, the strength and significance of some associations were lower (e.g. 1-PB SI/P: r = 0.490, P = 0.013; 1-PL SI/P: r = 0.538, P = 0.005), while others were slightly higher (e.g. 2-PD UIC: r = 0.492, P = 0.011; 2-PL SI/P: r = 0.673, P < 0.001; 2-PD SI/P: r = 0.559, P = 0.03). However, the direction and overall interpretation of results remained consistent.
Supplementary material
To view supplementary material for this article, please visit https://doi.org/10.1017/S0007114526106692
Acknowledgements
We would like to thank the Government of Saudi Arabia and the University of Hafr Al Batin for their financial support. We also extend our gratitude to Saul Vazquez Reina from the School of Biosciences, University of Nottingham, for his assistance with the ICP-MS sample analyses.
This study was supported by PhD funding from the Government of Saudi Arabia, the University of Hafr Al Batin. The funding sources had no role in the study design, data collection, analysis, data interpretation, manuscript writing or the decision to submit for publication.
E. A., P. R., E. B. and S. W. designed research; E. A. and S. W. conducted research; E. A. and S. W, analysed data; and E. A., P. R., E. B., and S. W. wrote the paper. S. W. had primary responsibility for final content. All authors read and approved the final manuscript.
The authors declare no conflicts of interest.
Data described in the manuscript will be made available upon request.