In North America during the early twentieth century, polio's image as a disease of dirt and poverty transformed into one of a disease that could attack anyone, especially children from “clean middle-class homes” (Rogers Reference Rogers1989: 490). Other polio historians give similar descriptions; Rutty (Reference Rutty1996: 277) characterizes the middle class as “polio's principal target” and Oshinsky (Reference Oshinsky2005: 256) calls polio “a disease of cleanliness, striking hardest at the middle class.” As early as 1912, Helen MacMurchy (Reference MacMurchy1912: 111), a Canadian medical doctor and public health advocate, wrote in MacLean's Magazine that “victims of this disease are not among the poor, or delicate. Often the vigorous and healthy are attacked and those who have comfortable homes and good care.” The same phenomenon was reported in Ohio. Boudreau (Reference Boudreau and Brain1914: 14) observed that the Ohio data “demonstrate[d] that the so-called middle classes, or families in moderate circumstances, suffered the most,” but noted that “of course this class comprises a large majority of the population.”
Building on such early observations, the hygiene hypothesis of polio's epidemic emergence assumes it is an ancient disease that was previously endemic in human populations. Poliovirus infections would occur in infancy, when individuals were still protected by maternal antibodies. Individuals would then develop their own immunity to the virus, with regular reinfection boosting their immunity into adulthood (Zinkernagel Reference Zinkernagel2001). Improvements in hygiene and sanitation in industrialized countries in the nineteenth and twentieth centuries broke the chain of infection and delayed exposure beyond infancy, with the likelihood of severe infection increasing with age at infection. The hygiene hypothesis views polio as a “disease of development” (Bunimovich-Mendrazitsky and Stone Reference Bunimovich-Mendrazitsky and Stone2005), seen first and most severely among the upper classes.
Did polio have an inverse relationship with class, as the hygiene model suggests, such that those of higher socioeconomic status (SES) were disproportionately affected? Or did polio follow a more democratic or “socially neutral” pattern (Mamelund Reference Mamelund2006), placing all socioeconomic levels equally at risk—with the upper classes only seeming at increased risk because they usually were less affected by other infectious diseases? Hall (Reference Hall1911: 116) suggests this may have been the case, stating that “this disease affects all classes of society, children of the rich and poor in equal proportion. Many diseases, as we know from experience, affect the poor and not the rich.” Or was it some combination of the two patterns, which differed by time and place? One alternative to the hygiene model is Nielsen and colleagues’ (Reference Nielsen, Aaby, Wohlfahrt, Pedersen, Melbye and Mølbak2001, Reference Nielsen, Aaby, Wohlfahrt, Mølbak and Melbye2002) intensive-exposure hypothesis, which posits that crowding (generally associated with lower SES) increased risk of severe polio by increasing the likelihood of a higher dose of poliovirus at first exposure. Can the intensive-exposure hypothesis explain polio mortality patterns better than the hygiene model alone? These questions are addressed here using data on polio deaths in Wentworth and York counties in Ontario, Canada, from 1900 through 1937, the year of a large, province-wide polio epidemic. Both counties border Lake Ontario and contain major cities, Hamilton in Wentworth County and Toronto in York County. In the early twentieth century, Hamilton and Toronto were large, growing cities with outlying suburban and peri-urban areas with rural farms beyond. These cities were popular destinations for both new immigrants to Canada and migrants from other parts of the province and country.
This article is organized as follows. First, I provide background information, covering polio pathogenesis, the composition of the cities of Hamilton and Toronto in the early twentieth century, socioeconomic conditions in these cities, and the relationship between SES and risk of infectious disease for infants and children. Second, I outline the data sources used for this study, along with details of the resulting sample of deaths attributed to polio and methods for status score coding and statistical analysis. Third, I compare proportions of the population in each status score according to the 1921 Census to the distribution of polio deaths. I also examine the relationship between status score and age at death and how this changed, or did not change, over time. I demonstrate that in this sample, polio mortality by SES follows some anticipated patterns, such as a high mean age at death at higher socioeconomic levels. However, there was no clear pattern of increased polio mortality with increased SES. In particular, individuals at status score three (skilled laborers and their families) were overrepresented among polio deaths. I examine these results in comparison to other polio studies and in the context of the demographic patterns, economic conditions, and sanitation improvements happening in this region at the time. I argue that the view that the middle and upper classes were more vulnerable to epidemic polio is overly simplistic. What is evident instead in Wentworth and York counties is a more complex relationship between SES and polio mortality.
Background
Poliomyelitis is a disease caused by infection with one of the smallest known viruses, an enterovirus in the Picornaviridae family of RNA viruses. There are three serotypes of the poliovirus that vary in neurovirulence. Spread through the fecal-oral route (contaminated water or food, or person-to-person through contaminated hands) or by droplets or aerosols (person-to-person), the virus can move from the throat or intestines to the lymph nodes and then to the bloodstream. From there it might enter the central nervous system, where it damages motor neurons, causing paralysis and other complications (Smallman-Raynor et al. Reference Smallman-Raynor, Cliff, Trevelyan, Nettleton and Sneddon2006). Symptoms of polio infection can vary from sore throat and headache to severe and potentially fatal paralysis. There are three clinically recognized forms of poliomyelitis: abortive (minor illness only), nonparalytic (major illness without paralysis), and paralytic (major illness with subsequent paralysis). Three stages of the paralytic form are generally recognized: the acute illness (the first ten days), the convalescent or recovery period (cutoff variously defined as six months post-acute illness up to two years), and the chronic stage. Between 90 to 95 percent of infections are asymptomatic, with 4 to 8 percent being the abortive form and only 1 to 2 percent becoming major illnesses (ibid.). The most severe forms include polio-encephalitis, bulbar poliomyelitis, and spinal respiratory paralysis (ibid.). Complications such as pneumonia may also develop and result in death. Polio survivors, especially those with severe paralysis, are also subject to increased mortality in the long term (Nielsen et al. Reference Nielsen, Rostgaard, Juel, Askgaard and Aaby2003).
In 1900 the population of Hamilton was more than 50,000, reaching 115,000 by the 1920s and more than 155,000 by the 1930s, while Toronto's population was more than 200,000 in 1900 and more than tripled to more than 630,000 by the 1930s (Canada, Dominion Bureau of Statistics 1932, Table 11). This growth was not steady; Hamilton grew from 114,000 in 1921 to 155,000 in 1931 through immigration, a high birthrate, and declining mortality (Weaver Reference Weaver1982: 137). However, in the 1930s, Hamilton's population growth stagnated due to a falling birthrate and fewer immigrants (Weaver Reference Weaver1982), even falling slightly between 1931 and 1936 (Wood Reference Wood, Dear, Drake and Reeds1987).
Hamilton's population was largely blue collar working class, with a large number of men employed at the steel and construction industries, and became increasingly so in this period as the city became more industrial and less commercial (ibid.). Offices relocated to Toronto, taking white collar jobs such as clerks and bookkeepers with them (ibid.). Toronto then saw an expansion in its white collar population. Between the 1911 and 1921 census years, the number of white collar workers in Toronto increased 33 percent, and blue collar workers declined 2.8 percent (Piva Reference Piva1979: 15). This meant that only 58.9 percent of Toronto's workforce was blue collar in 1921, compared to 66.3 percent in 1911 (ibid.).
When the Depression hit in 1929, blue collar workers were impacted more than those in white collar work, and manufacturing was hit harder than the transportation and commerce sectors (Weaver Reference Weaver1982). In 1935, 60 percent of relief recipients in Hamilton related to the building trades (ibid.: 131). Other workers kept their jobs but had their hours reduced. At the worst of the Depression in 1933, 25 percent of Hamilton families were receiving relief (ibid.: 135).
Socioeconomic Status and Infant and Childhood Infectious Disease Risk
The relationship between SES and disease risk is not always as simple as increased risk with lower SES. Available evidence indicates that inequality in infant and childhood mortality between socioeconomic classes increased in the late nineteenth and early twentieth centuries during the transition to overall lower levels of mortality. Both Garđarsdóttir (Reference Garđarsdóttir2002) and Ewbank and Preston (Reference Ewbank, Preston, Caldwell, Findlay, Caldwell, Santow, Cosford, Braid and Broes-Freeman1990) attribute this to the upper classes more readily adopting new knowledge and advances in infant care and hygiene. However, there are other possible explanations for these disparities, which depend on particular local contexts. Mercier (Reference Mercier2006) found that for 1901 Toronto, instead of social class and living conditions, residential grouping by religion was the main factor in differing child mortality rates. Slums with large Jewish populations did not have higher mortality, but largely Catholic areas did. Mercier and Boone (Reference Mercier and Boone2002) found a similar pattern in Ottawa, in that once cultural factors were controlled for (French vs. non-French), economic standing did not account for differences in mortality. However, as economic class rose, the difference in infant mortality rates (IMRs) declined between groups, indicating that better economic position helped reduce the cultural disadvantage of the French Catholics (ibid.).
Often lower income meant higher infant mortality. However, sometimes the opposite was true, depending on relative patterns of infant feeding. Gagan (Reference Gagan1981) says cholera infantum affected all classes in Hamilton between 1900 and 1914 and was actually higher in the wealthier southern part of the city, probably because of bottle feeding by the middle class. However, Gagan did not consider the role of ethnic factors in Hamilton as Mercier (Reference Mercier2006) and Mercier and Boone (Reference Mercier and Boone2002) did for other cities in Ontario. It is possible that there was a large population with low breastfeeding rates clustered in the south of Hamilton that might also contribute to that discrepancy. For example, the Corktown area, located in the south part of Hamilton, was associated with Irish immigrants, and Preston and Haines (Reference Preston and Haines1991) note that Irish immigrants in the United States experienced higher levels of mortality than the general population, likely because of infant feeding patterns.
Children of lower SES may be especially vulnerable to malnutrition, which in the past has been linked to increased mortality from some infectious diseases (see, e.g., Ulijaszek Reference Ulijaszek, Harrison and Waterlow1990). However, overcrowding has been argued as a more important factor in measles severity (Aaby Reference Aaby1988; Hardy Reference Hardy1992) and whooping cough mortality (Hardy Reference Hardy1992). However, measles and whooping cough affect nutrition and decrease the victim's resistance to other infections (ibid.). This is important, as measles and whooping cough mortality were associated in part with secondary infections and complications such as bronchitis (ibid.: 394). Mamelund (Reference Mamelund2006) notes that other research has shown that malnutrition does not increase susceptibility to viral infections (Scrimshaw et al. Reference Scrimshaw, Taylor and Gordon1959), but certain types of malnutrition do increase susceptibility to bacterial infections (Fox et al. Reference Fox, Hall and Elveback1970). Thus, while malnutrition might not substantially increase susceptibility to the initial disease in cases of viral infections like measles, influenza, or polio, it may play a role in susceptibility to the secondary bacterial infections that often complicate such cases.
Mamelund (Reference Mamelund2006) notes that often there is little distinction made between the chances of being infected by, versus the chances of dying from, a particular disease. While some diseases, such as the 1918 influenza pandemic, might not show any social differences in infection rates, SES affects one's chances of surviving the disease. Mamelund's (Reference Mamelund2006) results from an investigation of influenza mortality in Norway in 1918–19 show that mortality was significantly higher among those in a poor versus a wealthy parish and among those living in smaller apartments. These findings challenge the view of Spanish influenza as a “socially neutral” or “egalitarian” disease in terms of class. Diphtheria in particular was characterized as a “democratic” disease that affected the rich and poor, hygienic and dirty alike (Hooker and Bashford Reference Hooker and Bashford2002). Like polio, it challenged previous conceptions of disease as associated with crowded, polluted places (ibid.). A small study of diphtheria patterns in Hamilton, Ontario, in the early twentieth century similarly found that mortality was higher in wards with higher population densities and lower socioeconomic levels, such as those in the industrial northern part of the city (Battles Reference Battles2008). Additionally, Herring and Korol's (Reference Herring, Korol, Fahrni and Jones2012) study of 1918 influenza in Hamilton revealed significant differences in influenza mortality in northern versus southern wards of the city. Attention to local social and cultural contexts and finer scales of analysis is thus important in the effort to test our existing perceptions and generalizations and to better understand the production of differing patterns of infectious disease mortality.
Considering information gained from polio studies in which antibody levels could be measured directly, such as the work of Joseph Melnick and colleagues (e.g., Melnick and Ledinko Reference Melnick and Ledinko1951; Melnick et al. Reference Melnick, Paul and Walton1955; Walton and Melnick Reference Walton and Melnick1955), adds another dimension to the understanding of the results to be presented here and patterns noted elsewhere. In their work on the 1948 North Carolina polio epidemic, for example, Melnick and Ledinko (Reference Melnick and Ledinko1953) found a difference in polio antibody levels between upper and lower economic groups, but no differences between economic groups for influenza and mumps viruses, which they note are spread by respiratory pathways.Footnote 1 They determined that during the epidemic, polio antibodies (especially type 1) increased more in lower economic groups than in the upper economic groups. They compared poliovirus antibodies to Coxsackie virus antibodies, and found that in contrast, Coxsackie virus antibodies increased to the same extent in both economic groups. Therefore, the poliovirus behaved quite differently from many other common viral infections in that lower economic groups were exposed and infected to a greater extent.
To understand how greater poliovirus infection resulted in a smaller proportion of polio deaths among lower SES groups, age must be considered. The polio literature on age and SES for the most part shows higher SES correlated with older age at polio illness, with some exceptions. Fales and Taback (Reference Fales and Taback1952) studied the 1950 Baltimore polio epidemic and showed that the overall attack rates in the lower and upper SES groups were similar; however, the lower SES group was infected instead at younger ages and the upper at older ages. Fales and Taback (ibid.: 50) described this as “evidence of an infectious process which eventually reaches an entire population group.” Among paralytic cases, bulbar cases were much more likely to occur over age five compared to the 0–4 age group. The results of a 1935–36 family survey showed a similar pattern; Collins (Reference Collins1946) found that the per capita incidence of polio was higher in the lower income groups, but that the age distribution differed; the polio rates for children under five years old decreased as income increased.
Similar to Fales and Taback, Collins (Reference Collins1946: 347) said that the high rates of polio at the youngest ages is “presumably due to more contact in the crowded areas of the city”—in other words, greater population density (and population density and crowding would tend to correlate with SES). Collins (Reference Collins1946) looked at various income levels, including those on relief and found that case rates varied by age and income level; rates were highest in the 0–4 age group in the lowest income levels, in the 5–9 age group at a moderate income level, and in the 10–14 age group at the higher income levels. However, the peak overall attack rates were not much different across age groups and income levels. The association of increased age with increased risk of severe polio would explain why upper SES groups, first infected at a higher age than lower SES groups, would be more affected by severe polio infections—including death.
Nielsen and colleagues (Reference Nielsen, Aaby, Wohlfahrt, Mølbak and Melbye2002), however, found very different results in their examination of polio patterns in Copenhagen, Denmark, from 1940 to 1953. They found that in children hospitalized with polio, those in the higher social classes did not have a higher mean age at illness onset than those in the lower classes (ibid.: 184). When they adjusted for age, gender, and time period, Nielsen and colleagues (Reference Nielsen, Aaby, Wohlfahrt, Mølbak and Melbye2002) found no difference between the higher and lower social classes in terms of risk of death from paralytic polio. Instead, they suggest family size (crowding) and birth order played a role. Similarly, Bernkopf and colleagues’ (Reference Bernkopf, Medalie and Yekutiel1957) study of children in an immigrant community in Israel found that it was cleanliness and family size, rather than economic status that were associated with the frequency of antibodies against the three types of poliovirus. They also found a correlation between family size and cleanliness. It may be that in the case of polio, the influence of SES varies according to particular local, historical contexts and circumstances.
Methods
Data for this sample of individuals whose deaths were attributed to polio were collected from a number of archival sources. The first among these was the Registered Death Records of the Province of Ontario (Archives of Ontario, Series MS935, Reels 95–601). Additional sources for the Province of Ontario included the Registered Birth Records (Archives of Ontario, Series MS929, Reels 1–249) and Registered Marriage Records (Archives of Ontario, Series MS932, Reels 1–833, 850–880). These death, birth, and marriage records were all publicly available from the Archives of Ontario on microfilm, or digitally for paid subscribers of Ancestry.ca, a genealogy website. Individual and household data from the 1891, 1901, 1911, and 1921 national censuses were also utilized when possible (Library and Archives Canada 2004, 2007, 2009, 2013). Data collection was constrained by the availability of the various sources. During the period of data collection for this study, the Registered Death Records for the Province of Ontario were available up to and including the year 1937. Registered Birth Records were available to 1914 and Registered Marriages to 1927.
Names and other personal information (e.g., date of birth) were then used to locate additional records for each polio victim. These searches were mostly conducted through the basic and advanced search functions on Ancestry.ca; city directories and newspapers (Hamilton Spectator, Hamilton Daily Times, Toronto Globe, and Toronto Star) were searched separately. These additional records provided information on religion, occupation, previous residences, and to a limited degree the number, sexes, and ages of siblings. These details were included in the Excel database file and digital copies of the records were retained. In the absence of a specified religion from one of the archival records, where possible, religion was inferred either from the category of “Race” (in the cases of individuals recorded as “Hebrew”) or from burial in a cemetery restricted to members of a particular religious group.
Status Score Coding
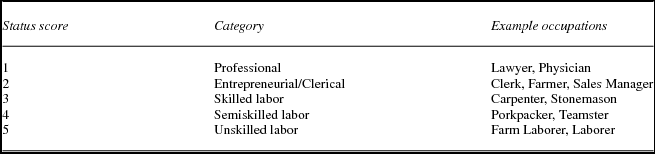
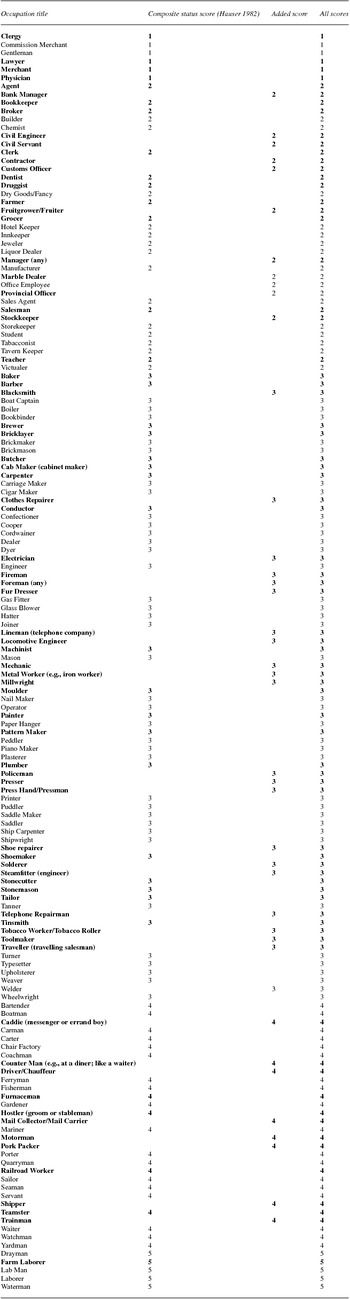
Socioeconomic class was coded using the five-point composite score scale from Hauser (Reference Hauser1982) (see table 1). Status score one, then, represents the highest SES and status score five the lowest. These numerical values were assigned to individual polio victims based on father's occupation or, in the absence of data on father's occupation, on the occupation of the adult male victim or adult female victim's husband if married. For victims whose fathers had multiple known occupations over time, the occupation in which the father was engaged for the majority of the victim's early childhood period was selected for scoring, as could best be determined on an individual basis. This was done to best reflect childhood SES, with relevance to exposure to and susceptibility to polio. It would have been preferable to have separate scores for occupation at birth and at death; however, birth records were unavailable for most of the study period.
Status scores with associated occupational categories and occupations, after Hauser (Reference Hauser1982)

Note: See appendix for full list of occupations and their assigned status scores.
There are 112 occupation titles listed in Hauser (Reference Hauser1982), 38 of which were found in this sample. Occupations in the sample that were not on Hauser's list (n = 42) were scored as close as possible to comparable occupations on the list (see Appendix 1), or not assigned a status score due to conflicting information or ambiguity. For example, in one case occupation was recorded only as “oil business.” Other unclassified occupations were “mixer” and “engineer” (of unspecified type). The occupation of “soldier” (scored in Hauser Reference Hauser1982 as status score four) was not used to assign a status score, as, first, in this period it was a common wartime occupation (World War I) and not reflective of individuals’ usual occupations, and second, it was also not found to be accurately reflective of SES in other cases (such as one individual's father who was a career soldier, rising to the rank of major, and heir to an estate overseas). In some cases, status scores were not assigned due to the parents’ separation or divorce, or the death of the father early in the individual's life. For example, one individual's father was listed as a general warehouseman, but these parents separated during the individual's childhood, and so no status score was assigned. In another case, the individual's father had worked as an insurance agent (which would be status score two), but was deceased, and the individual, age 27, was working as a driver (status score four) at the time of his death in 1937. For another individual who died during the 1937 polio epidemic at age nine, her father was recorded as a cement worker, but he had died four years previously and so a status score was not assigned as he had been deceased for approximately half of her life span. Due to the variety and detail of the information available, these decisions related to conflicting or potentially ambiguous data were often best made on an individual basis.
For analysis by population, data from the 1921 Census was used. As in the polio sample, the occupations listed were coded according to Hauser's (Reference Hauser1982) five-point scale. However, for the purposes of comparison with the census categories, it was necessary to combine merchants and dealers into one occupational category classified at status score two for these particular analyses only. Data sets included the 1921 Ontario male population more than 10 years of age (Canada, Dominion Bureau of Statistics 1925, Table 2), 1921 families by male head of household for Hamilton and Toronto (ibid., Table 41), 1921 child population by male head of household for Hamilton and Toronto (ibid.), and 1921 religious denominations by counties and subdivisions (Canada, Dominion Bureau of Statistics, 1924, Table 38). It was possible to assign status scores to 86.4–87.7 percent of these census data sets.
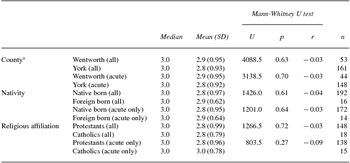
Comparison of median and mean status scores between groups of polio deaths by nativity and religious affiliation

a County in which death occurred and was recorded.
Sample
The study sample consisted of a total of 337 individuals whose deaths occurred in Wentworth or York counties and who had polio or “infantile paralysis” listed as a direct or contributing cause of death. Of these, 168 were male and 149 female. Sixty-six were recorded in Wentworth County and 271 in York County. Only 16 out of the 337 resided in neither county. Of the total 337 deaths, 29 were chronic cases (either described as “chronic” or as having had polio more than six months before death); 27 were either described as “acute” in the cause of death or as having had polio for six months or less at the time of death (thus combining the acute and convalescent stages); and 81 cases could not be determined as specifically acute or chronic due to lack of information, though were most likely acute cases as they occurred during polio epidemic season. These were combined for total of 308 “acute” cases for analyses of age at death. Age at death ranged from a low of 4 days to 78 years. The highest age at death for an acute case was 66.9 years. For the chronic cases, the mean length of time between the initial acute polio illness and death was 9.1 years (SD = 13.3) and the median was 5.0 years; the longest was approximately 66 years, in a man aged 66 years, 10 months who was recorded as having had infantile paralysis “since babyhood.”
There was no difference in the median and mean SES scores between Wentworth and York counties (see table 2).
Information on birthplace was available for 326 of the 337 individuals, or 96.7 percent of the overall polio sample (both chronic and acute deaths). Of these, 295 were born in Canada and 31 were foreign born. Of these, 192 of the native born (65.1 percent) and 16 of the foreign born (51.6 percent) were assigned status scores. Status scores were similar for native- and foreign-born individuals in the sample (see table 2).
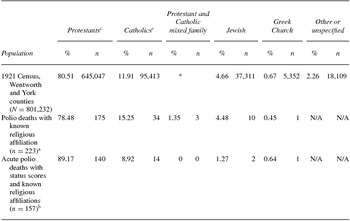
The distribution of polio deaths by religious affiliation broadly reflects that of the wider population, as measured by the 1921 Census (table 3). Only Protestants and Catholics had expected values high enough for reliable chi-square tests, which did not show evidence of a difference between the relative proportions of Protestants versus Catholics in the polio death sample compared to the 1921 Census population (see notes under table 3). These numbers must be approached with caution, as religious affiliation was known for only 66.2 percent of the total sample of polio deaths and 81.8 percent of the sample of acute polio deaths with status scores (as noted under table 3), and it is possible that some groups were more likely to be buried in nondenominational cemeteries and thus be less likely to be included in the religion analyses. However, there was no evidence of a difference in status scores between Protestants and Catholics in this sample (see table 2). There were only one Greek Orthodox and two Jewish individuals with status scores; all three were in status score three and were designated as an acute deaths. There were two individuals designated as from mixed Protestant/Catholic families, one at status score two and one at status score four; both were chronic polio deaths.
Comparison of proportion of population by religious affiliation in the 1921 Census and polio deaths

Source: Census of Canada 1921 (Canada, Dominion Bureau of Statistics 1924, Table 38).
* Data not available.
a 66.2 percent of all acute and chronic polio deaths (n = 337).
b 81.8 percent of all acute polio deaths with status scores (n = 192).
c A chi-square test found no difference between the relative proportions of Protestants vs. Catholics in the polio death sample compared to the 1921 Census population, for neither all polio deaths with known religious affiliations (χ2 (1, n = 209) = 2.12, p = .15, φ = .10) nor for acute polio deaths with status scores and known religious affiliations (χ2 (1, n = 154) = 1.98, p = .16, φ = .11).
Status scores were assigned for 117 males and 97 females. Males and females did not differ in their median status scores (3.0 for both) or mean status scores (male mean = 2.8, SD = .96; female mean = 2.8, SD = .91). As discussed in the preceding text, family size may or may not be correlated with SES, and even if it is, it may exert an independent influence on poliovirus exposure patterns, particularly in combination with birth order (see Nielsen et al. Reference Nielsen, Aaby, Wohlfahrt, Mølbak and Melbye2002). Unfortunately, data on family size (sibship size) for individuals in this sample are limited and fragmentary for much of this period. Future release of additional birth records and census manuscripts may be able to provide sufficient data for analysis.
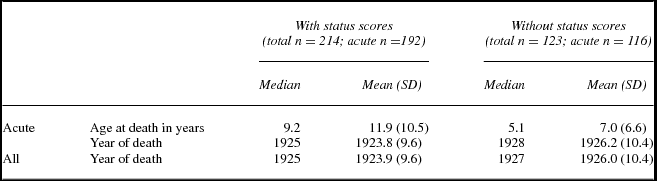
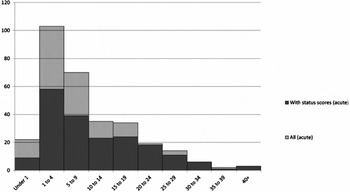
The group without assigned status scores (n = 123) was compared to the sample with status scores (n = 214) for evidence of potential biases. The group without status scores had a slightly higher proportion of foreign-born individuals (n = 15, 12.7 percent of those with known origins) compared to those with status scores (n = 16, 7.7 percent of those with known origins). However as noted in the preceding text, median and mean status scores were the same between the foreign born and native born in the sample. Those without status scores were also more often from later in the study period and younger (see table 4). This makes sense as these individuals born later were less likely to be captured in the available records described in the preceding text. A younger age at death also meant fewer years accumulating potential records and less likelihood of being captured in a decennial census. While it is possible that individuals of low SES were less likely to have information available for assignment of a status score, there is no direct evidence of this in the database. Of those with some occupation information but who were not assigned status scores, these ranged across the possible status scores, as seen in the examples in the previous section. Thus so far as could be determined, there does not seem to be substantial bias in any particular status score compared to the others. However, given the difference in overall ages, direct comparison of age at death with studies elsewhere should use the total sample (n = 338) rather than the group with status scores. Figure 1 shows the distribution of acute deaths with status scores by age group compared to all acute deaths in the sample.
Descriptive statistics comparing those with and without assigned status scores

Distribution of acute deaths with status scores by age group against all acute deaths.

Statistical Methods
To obtain a more precise age at death than the reported age in years, birth and death dates were used to calculate the exact number of days lived, which was then divided by 365.25 days to give an age in years. Because of Microsoft Excel's difficulty in handling pre-twentieth-century dates, the calculation of number of days between birthdate and date of death was done individually using Time and Date AS's online date duration calculator (http://www.timeanddate.com/date/duration.html). Many death registrations included exact ages in years, months, and days; this information was used when birthdate was not available. If birthdate was not available and the age was only reported in whole years or years and months, the midpoint of the year or month, respectively, was used. Median and mean ages at death and standard deviations were then calculated in Microsoft Excel.
Analyses of variance (ANOVAs) were performed on natural log transformations of age at death to address lack of normal distribution. Post hoc testing was done with Hochberg's GT2 test due to variation in sample sizes between groups, with the Tukey and Bonferroni tests for comparison (specific results not reported). The nonparametric Kruskal-Wallis test was also used, along with Jonckheere's test for ordered patterns in age at death by status score. The Mann-Whitney U test was used to compare status scores between Protestants and Catholics as well as age at death within each status score over two time periods. These analyses were conducted using IBM's SPSS Statistics 22 software. Effect sizes (Cohen's d and Cohen's r) were calculated in Excel.
GraphPad's QuickCalc online software (http://www.graphpad.com/quickcalcs) was used for chi-square tests. Effect sizes (Phi φ and Cramer's V) were calculated in Excel.
Statistical significance was set at p < .05. In the results that follow, specific p values are reported to p = .001 and subsequently reported as either p < .001 (for values between .001 and .0001) or as p <.0001.
Results
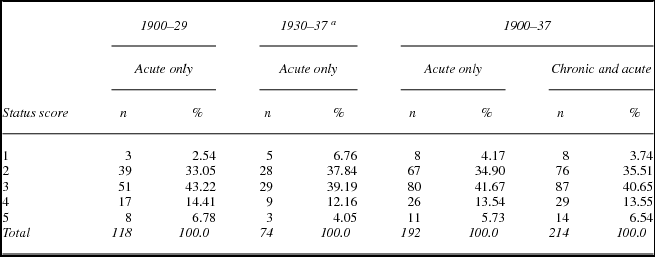
There were 214 polio deaths for whom sufficient information was available for assignment of a status score (63.5 percent of the overall sample of 337).Footnote 2 Of these 214 individuals with status scores, 22 are classified as chronic polio cases and are excluded from analyses of age at death for the purposes of this article, leaving 192 acute polio deaths. The breakdown of deaths by status score is shown in table 5. For both all deaths and acute deaths only, status score three had the highest number of deaths, followed (in descending order) by status scores two, four, five, and one.
Proportions of acute polio deaths by status score over time

a A chi-square test found no evidence of a real difference between the proportions of deaths by status score for the 1930–37 period compared to those of the 1900–29 period (χ2 (4, n = 74) = 7.04, p = .13, V = .15).
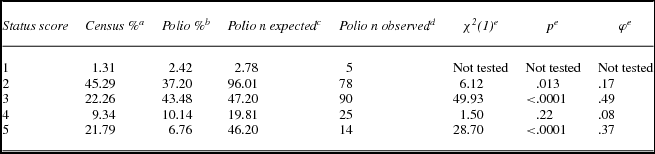
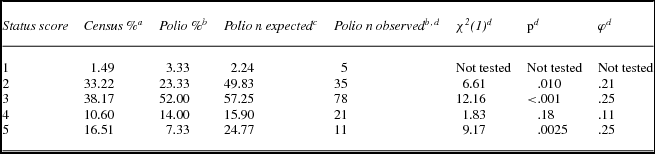
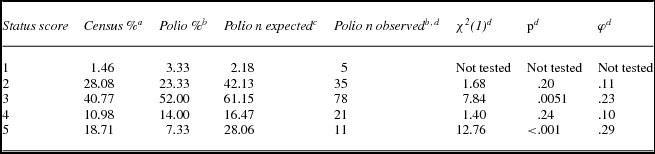
The observed polio deaths in each status score were compared with the number expected based on the distribution of the 1921 Census population (tables 6, 7, and 8). As the expected value for status score one fell below five, violating an assumption of the chi-square test, some comparisons were tested using only status scores two through five. The results showed evidence of a real difference for the Ontario group with a large effect size (table 6), and for Toronto and Hamilton families (table 7) and children (table 8), both with medium effect sizes. As expected, status score five is underrepresented in polio deaths compared to its proportion in the Ontario population (table 6) as well as in the Toronto and Hamilton family (table 7) and child (table 8) populations. There is no evidence of a difference in expected versus observed deaths for status score four based on any of the three populations (tables 6, 7, and 8). Conversely, status score three shows more deaths than expected based on its proportions in each of the three populations (tables 6, 7 and 8). Status score two shows fewer deaths than expected based on the Ontario (table 6) and Toronto and Hamilton family (table 7) populations, but no difference when compared to the Toronto and Hamilton child population (table 8).
Proportion of Ontario population in each status score according to the 1921 Census (male population >10 years old in all occupations) compared to proportions of polio deaths, 1900–37

Source: Census of Canada 1921 (Canada, Dominion Bureau of Statistics 1925, Table 2).
a The number of individuals in the census whose occupations were assigned status scores (n = 797,655) over the total number of individuals with occupations reported in the census tables (n = 923,413) is 86.4 percent.
b Of the 214 polio deaths assigned status scores, two were excluded from this analysis as non-Ontario residents.
c Based on census %, out of a total of 212 polio deaths.
d A chi-square test found evidence of a real difference between the observed polio deaths versus the expected number of deaths based on the census distribution for status scores two through five, χ2(3, n = 207) = 65.59, p <.0001, V = .32.
e This status score vs. sum of remaining status scores. Two-tailed p-values reported. Status score one not tested due to its small sample size.
Proportion of population in each status score according to the 1921 Census (Toronto and Hamilton family population, by male head) compared to proportions of polio deaths in Toronto and Hamilton combined, 1900–37

Source: Census of Canada 1921 (Canada, Dominion Bureau of Statistics 1925, Table 41).
a The number of families in the census whose male heads’ occupations were assigned status scores (n = 83,592) over the total number of families with occupations reported in the census tables (n = 95,549) is 87.5 percent.
b Number of polio deaths included in this analysis (n = 150) over the total number of polio deaths (Toronto and Hamilton residents) assigned status scores (n = 157) is 95.5 percent. Excluded are the children of farmers who later moved to the city (n = 7), elsewhere classified as status score 2, as “farmer” was not an occupation included among the cities’ census categories.
c Based on census %, out of a total of 150 polio deaths.
d A chi-square test found evidence of a real difference between the observed polio deaths vs. the expected number of deaths based on the census distribution for status scores two through five, χ2(3, n = 145) = 21.57, p <.0001, V = .22).
e This status score vs. sum of remaining status scores. Two-tailed p-values reported. Status score one not tested due to its small sample size.
Proportion of population in each status score according to the 1921 Census (Toronto and Hamilton child population, by male head) compared to proportions of polio deaths in Toronto and Hamilton combined, 1900–37

Source: Census of Canada 1921 (Canada, Dominion Bureau of Statistics 1925, Table 41).
a The number of children of all ages in the census whose male heads’ occupations were assigned status scores (n = 143,296) over the total number of children of all ages with male heads’ occupations reported in the census tables (n = 164,772) is 87.0 percent.
b Number of polio deaths included in this analysis (n = 150) over the total number of polio deaths (Toronto and Hamilton residents) assigned status scores (n = 157) is 95.5 percent. Excluded are the children of farmers who later moved to the city (n = 7), elsewhere classified as status score 2, as “farmer” was not an occupation included among the cities’ census categories.
c Based on census %, out of a total of 150 polio deaths.
d A-chi square test found evidence of a real difference between the observed polio deaths vs. the expected number of deaths based on the census distribution for status scores two through five, χ2(3, n = 145) = 17.75, p <.001, V = .22.
e This status score vs. sum of remaining status scores. Two-tailed p-values reported. Status score one not tested due to its small sample size.
Status Scores and Age
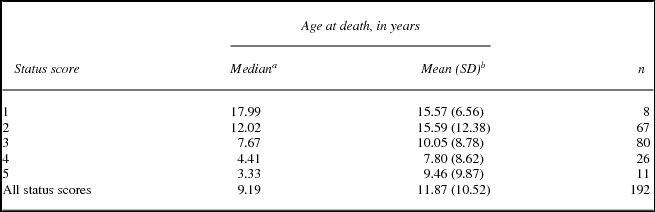
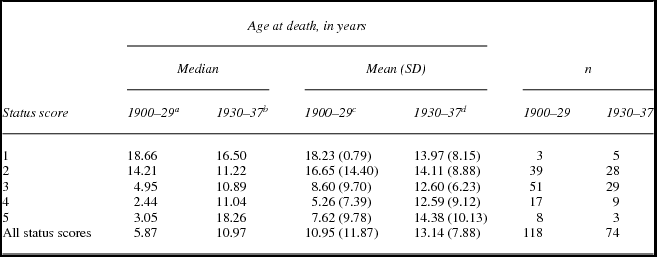
Age at death by status score was analyzed for the 1900–37 period and for the pre-Depression (1900–29) versus Depression (1930–37) periods. Median and untransformed mean ages at death by status score are displayed in table 9 (1900–37) and table 10 (1900–29 and 1930–37).
Median and untransformed mean age by status score for acute polio deaths, 1900–37

a Kruskal-Wallis test rejected the null hypothesis that age at death was the same across the status scores, H(4) = 19.21, p = .001. Jonckheere's test demonstrated a trend of decreasing median age over the status scores, J = 4474, z = −4.32, p = .000, r = −.31.
b A General Linear Model (GLM) univariate ANOVA on log transformed age rejected the null hypothesis that age at death was the same across the status scores, F(4, 187) = 4.59, p = .001, r = .30.
Median and untransformed mean ages by status score for acute polio deaths in the pre-Depression (1900–29) and Depression (1930–37) periods

a A Kruskal-Wallis test rejected the null hypothesis that age at death was the same across the status scores for the 1900–29 period, H(4) = 19.89, p < .001. Jonckheere's test demonstrated a trend of decreasing median age over the status scores, J = 1498, z = −4.28, p = .000, r = −.39.
b A Kruskal-Wallis test found no difference in age at death across the status scores for the 1930–37 period, H(4) = .30, p = .99.
c A GLM univariate ANOVA on log transformed age rejected the null hypothesis that age at death was the same across the status scores for the 1900–29 period, F(4, 113) = 4.80, p = .001, r =.38.
d A GLM univariate ANOVA on log transformed age found no difference in age at death across the status scores for the 1930–37 period, F(4, 69) = 4.59, p = .001, r = .30.
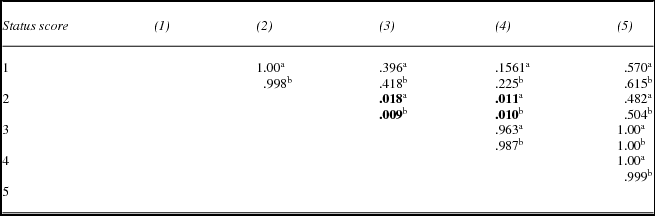
Mean age at death was found to differ between the status scores in the 1900–37 period overall (see table 9). However, when divided into the two time periods, mean age at death differed only in the earlier period (see table 10). For both the entire 1900–37 period and for 1900–29, post hoc Hochberg's GT2 pairwise comparisons showed evidence for a real difference only between status scores two and three and between status scores two and four (see table 11). Results from Tukey and Bonferroni tests showed very similar results. The nonparametric Kruskal-Wallis and Jonckheere's tests also showed that age at death differed across the status scores for the 1900–37 and 1900–29 periods, but not for 1930–37 (see tables 9 and 10). It should be noted that small sample sizes in status scores one and five in particular made statistical comparisons for those groups problematic.
Results of pairwise comparisons using Hochberg's GT2 test following GLM univariate ANOVA on log transformed age for acute polio deaths

P-values < .05 in bold.
a 1900–37. F(4, 187) = 4.59, p = .001, r = .30.
b 1900–29. F(4, 113) = 4.80, p = .001, r =.38.
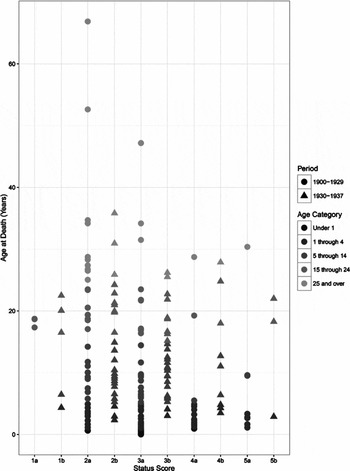
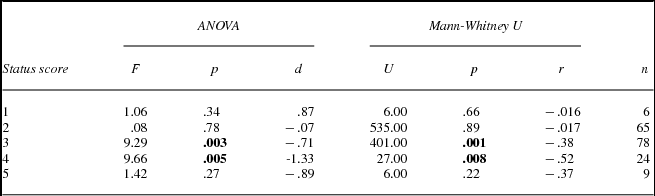
Comparison of the pre-Depression (1900–29) and Depression (1930–37) periods within each status score indicates that age at death increased substantially in the status scores representing the skilled and semiskilled manual workers. The distribution of deaths by age and status score in each time period is illustrated in figure 2. An ANOVA test, with the status scores split into their respective groups for analysis, shows evidence of a real difference in mean age at death between the two periods for status score three, and status score four, and not in status score one, status score two, or status score five (table 12). Comparison of the age distributions between the two time periods using Mann-Whitney U tests similarly showed evidence of a real difference for status scores three and four, but not status scores one, two, or five (table 12).
Plot of acute polio deaths in Wentworth and York Counties (n = 180) by age and status score, 1900–29 vs. 1900–37.

Comparison of age distributions for the pre-Depression (1900–29) and Depression (1930–37) periods within each status score

P-values < .05 in bold.
The lack of statistical evidence for a real difference in status score five despite differences in status scores three and four might be due to small sample size. Another possibility is that there was little increase in the age at death in status score five because these families of unskilled workers lagged behind their higher SES counterparts in terms of living conditions (e.g., crowding) and access to similar standards of hygiene and sanitation. More studies with larger sample sizes would be needed to explore this further.
According to the hygiene model in which risk of death increases with age at infection, we would expect that an increase in age at death in a status score would be associated with an increase in the percentage of polio deaths in that status score. However, the increase in age at death over time in children assigned to the lower status scores does not appear to have resulted in any major change in the relative distribution of deaths (see table 5).
Discussion
These results show that in Wentworth and York counties before World War II, status score three (skilled manual laborers and their families) were especially hard hit by polio. Most building trades workers lived at or below the poverty line between 1901 and 1920, and their economic position declined in that time (Piva Reference Piva1979: 49). Using the 1921 census data on occupations, Piva (Reference Piva1979: 58) found that “with the exception of the running trades on steam railways, average incomes for blue-collar workers fell substantially below even a conservative estimate of a poverty line.” Furthermore, manufacturing jobs declined between the 1921 and 1931 censuses, and blue collar workers in southern Ontario were more severely impacted by the Depression than white collar workers (Hiebert Reference Hiebert1995).
Examining the income of wage earners in Canada's 1901 Census, Sager (Reference Sager, Sager and Baskerville2007) found that in the family cycle, per-person earnings were at their lowest in families with young children. Older adolescents could take on jobs to contribute to the family income (ibid.). In Hamilton in the early twentieth century, the majority of working-class children entered paid employment by the age of 14 (Synge Reference Synge and Ishwaran1979). At this time, children could leave school at age 14; they could leave at age 12 if their parents could show proof their earnings were needed (ibid.). The period of the family cycle in which unmarried children in their teens and twenties were contributing to the household income was often the only time of relative prosperity for working-class households (ibid.). In a sample of six Canadian cities, Baskerville and Sager (Reference Baskerville and Sager1998) also found that nearly one-third of families with children under age 15 could not survive on the pooled earnings of their wage earners alone and needed to supplement with resources from the informal economy through such means as bartering or taking on lodgers. In the year 1931, 23.2 percent of households in Toronto and 20.7 percent of those in Hamilton had one or more lodgers (Harris Reference Harris1996: 117, Table 5.1).
The Report on Poliomyelitis in Ontario, 1937 found that polio morbidity was more prevalent in overcrowded homes (Ontario Department of Health 1938: 56). Investigators examined the number of persons per household and number of rooms in the households of polio cases relative to the 1931 Census data for Ontario (ibid.: 18). They found that households with polio cases in 1937 had more persons per household than the general population and fewer rooms per person (table 13).
Comparison of number of persons per household and rooms per house in 1937 Ontario polio cases and 1931 Ontario Census population

Source: Ontario Department of Health 1938: 18.
This information on morbidity, taken together with the mortality data presented in this study, suggests that prior to World War II, polio in southern Ontario was not concentrated among the highest status scores. Nielsen and colleagues (Reference Nielsen, Aaby, Wohlfahrt, Pedersen, Melbye and Mølbak2001, Reference Nielsen, Aaby, Wohlfahrt, Mølbak and Melbye2002) have demonstrated that crowding increases the risk for intensive exposure to the poliovirus, with higher doses of the virus linked to increased polio severity; this indicates that higher SES (associated with increased age at infection) was not the only risk factor for polio death, but that lower SES (associated with crowding) likely also conferred another set of risks. Cockburn (Reference Cockburn2005: 260) describes this idea of mixed high and low risk in his memoir of polio in Ireland, noting that “in poor and unhygienic households you were more likely to be protected against the virus but you were also more likely to meet it.”
Furthermore, at least by the 1930s, the middle and working classes were experiencing more similar living conditions. First, as a result of the housing boom of the 1920s, there was an oversupply of good quality houses with water and sewage connections, and much of the working class (those who still had employment) were able to benefit from these cheap rental opportunities, such as occurred in the eastern edge of Hamilton (Doucet and Weaver Reference Doucet and Weaver1991). Thus many of them were able to enjoy a higher standard of living during the Depression, in terms of housing quality and sanitation. However, Bordessa and Cameron (Reference Bordessa, Cameron and Barrett1980) note that water quality in Toronto declined between 1912 and 1945, as population growth outstripped the capacity of the sewage works. The authors of a 1939 report to the City of Toronto on the state of its sewage treatment system remarked that “the present contamination of the water supply and the bathing beach waters is serious, and Toronto has been fortunate not to have suffered severely from outbreaks of water-borne diseases” (Berry et al. Reference Berry1939: 1–2, cited in Bordessa and Cameron Reference Bordessa, Cameron and Barrett1980: 131).Footnote 3 Filtering and chlorination reduced the risk of waterborne disease, but Bordessa and Cameron (Reference Bordessa, Cameron and Barrett1980: 132) also credit medical advances with preventing serious consequences from contaminated drinking water. Such contamination (e.g., with poliovirus) would have affected everyone receiving drinking water from the municipal supply. Thus, as the working class gained greater access to amenities such as running water, they would have unwittingly increased their exposure to contamination from such sources (though they may have been at risk before as well, from wells contaminated by nearby privies). These changes do not address the consistency in the proportion of polio deaths at each status score over time, but they may help to explain the upward age shift in the lower status scores over time to match that of the upper status scores (discussed further in the following text).
Rural residence had its own polio severity risks, and farmers are classified as status score two. Thus the inclusion of farmers and their children (rural residents, or those who grew up in a rural setting) can muddy the picture of SES patterns in the cities. If farmers and their children are excluded from status score analysis in Toronto and Hamilton, status score three becomes even more prominent, making up more than half (52.0 percent) of urban polio deaths compared to only 38.2 percent of families and 40.8 percent of children in the combined Hamilton/Toronto 1921 Census population (tables 6 and 7). Thus in urban southern Ontario before World War II, it seems that skilled blue collar workers and their families were particularly vulnerable to death from polio.
Hilda Bull's (Reference Bull1939) investigation of the 1937–38 polio epidemic in Melbourne, Australia, also did not find that those of higher SES were more affected. Rather, of the 174 paralytic cases recorded in the City of Melbourne proper, 77 (44.3 percent) were identified as living in “very poor circumstances, either on sustenance or casual labor” and 68 (39.1 percent) were “for the most part economically insecure, through uncertainty of employment and accumulation of debts” (ibid.: 30). A further six paralytic cases were in institutions, and only 23 (13.2 percent) occurred in “comparatively comfortable circumstances” (ibid.). Bull (Reference Bull1939: 31) also mentions that polio cases resulted in the more hardship for low SES families; while quarantine did not necessarily apply to adults in the affected household, they were often “unwelcome” in their places of employment, or subject to public boycott of their own businesses. Furthermore, families often depended on the wages of older adolescents—who were subject to quarantine. Thus among polio-affected households, those of low SES were disproportionately impacted both during the initial illness and in the weeks, months, and years afterward. The care required by survivors could be costly and time consuming, and government and charitable assistance was variable.
The pattern of increasing age at death with increasing SES, as associated with the hygiene model, is partially evident in the results of this study. There is a substantial difference in age at death between status scores three and two prior to the 1930s. However, isolating the 1930–37 period, this pattern of increasing age correlated with increasing status score is no longer evident. Instead, every status score had a comparatively high median and mean age at death (medians between 10–16 years and means 12.0–15.2 years). This is explained solely by the increase in the average age at death among polio deaths assigned to status scores three through five. The already higher median and mean ages at death in status scores one and two did not increase, and actually declined slightly.
The timing of this epidemiological shift (around the end of the 1920s and early 1930s) is part of a larger pattern (see Battles Reference Battles2013). By the 1930s, the majority of polio deaths were no longer occurring in those under five years of age. When the disappearance of differences in ages at death between status scores is added to the picture, one obvious interpretation for the epidemiological shift is that improvements to public sanitation and hygiene had sufficient stability and reach to alter polio infection patterns across all social classes.Footnote 4 As Velasquez-Manoff (Reference Velasquez-Manoff2012: 295) has argued, “[R]oughly around mid-century, the lower classes in developed nations passed through the epidemiological transition that the upper classes had initiated in the previous century.” Sanitary improvements had an especially notable impact on children born after World War I, as indicated by the decline in IMR at this time. Yet, this increase in the ages at which people assigned to the lower status scores died from polio was not combined with any increase in the proportions of the polio deaths found in these categories. If anything the relative proportion of acute polio deaths at the lower status scores appears to have declined slightly (see table 2).
What the results presented here indicate is that the socioeconomic discrepancy in age at death for acute polio in southern Ontario had apparently disappeared by the 1930s. This contrasts with the studies that show that polio cases still displayed a pattern of increasing age with increasing SES in the 1930s and 1940s. This discrepancy does not appear to have been a matter of a difference between patterns in Ontario versus elsewhere in North America. The authors of the Report on Poliomyelitis in Ontario, 1937 found that increased economic status was still associated with increase in age in that major epidemic (Ontario Department of Health 1938). Therefore, it might be a pattern in deaths but not in overall cases.
Other aspects of crowding, such as family size, should be considered. In the wider population, family size generally varied with SES, decreasing as SES increased, except for farm families that were much larger than others at status score two (Gossage and Gauvreau Reference Gossage, Gauvreau, Sager and Baskerville2007). Average family sizes were also shrinking during the study period, as birth rates declined. Another crowding-related avenue for further investigation is the possible role of changing personal circumstances placing individuals and families at risk of severe polio infection. For instance, this could be examined in the cases in which individuals with reduced exposure to the poliovirus earlier in their lives due to their high SES or rural residence later faced poorer living conditions or moved to an urban area. Such otherwise advantageous earlier living conditions could have set the stage for greater likelihood of a severe case of polio if their living conditions later worsened—such as was the case for many families during the Depression years. Future work could look more at how the move from farms to cities impacted risk of severe polio, as these youths moved from low-density, more isolated settings to more crowded households in dense urban areas, working in lower SES occupations (e.g., as drivers or laborers).
Conclusion
The medical literature of the mid-twentieth century developed a model for polio centered on age at infection. In this model, crowding and larger family size were associated with earlier age at infection and reduced risk of severe polio; these factors varied with SES. Conversely, the intensive-exposure hypothesis proposed by Nielsen and colleagues (Reference Nielsen, Aaby, Wohlfahrt, Pedersen, Melbye and Mølbak2001, Reference Nielsen, Aaby, Wohlfahrt, Mølbak and Melbye2002) suggests that larger family size and crowding increased the risk of severe infection.
The results presented here for Wentworth and York counties provide support for the intensive-exposure hypothesis as an addition to the traditional polio model. Status scores as a measure of SES follow certain expected patterns, such as increased age at death with increased SES during the 1900–29 period. However, rather than a pattern of increased deaths concomitant with increased SES, polio deaths seem to have been disproportionately prevalent among the skilled blue collar group, status score three. By the 1930s, people from families living in lower socioeconomic circumstances were dying of polio at similar ages to those from more affluent families. Yet, the overall proportions of polio deaths at the various SES levels did not change. This analysis of polio mortality provides a more nuanced picture of the disease and its relation to SES in a time of rapidly changing socioecological conditions.
Appendix
List of occupations and associated status scores. Includes all occupations listed by Hauser (Reference Hauser1982) as well as additional ones found in the polio sample. The occupations in bold are those used in to assign status scores for this analysis