



The first model of the US economy was created by the Dutch socialist Jan Tinbergen at the League of Nations and published in 1939.Footnote 1 Tinbergen's models were a new kind of mathematical object, a bricolage of empirical, statistical data and theoretical, abstract speculation. The models were systems of equations that he described as simplified representations of reality. Economics since then has become, above all, a discipline of modeling. Models are economists’ “working objects,” as Mary Morgan has written.Footnote 2 They are indispensable in business and government. Few academic articles are published without one. Economists use models to teach, to argue, and to think. This article concerns the origins of modeling as a scientific practice in economics.
Modeling was a methodological innovation that developed in response to a political problem, that of reconciling national autonomy in economic affairs with international cooperation and governance. In the middle of the twentieth century, when modeling first became the basic technique of economic inquiry, models were used to provide expert advice to a nation's leaders and voters on the likely effects of proposed interventions. Perhaps above all, the ability to construct models of economic systems implied the ability to reconstruct the systems themselves. Tinbergen's objective was “insight into the economic machinery of today, which anyone who wants to rebuild must get to know better” (Fig. 1).Footnote 3 Models seemed to answer the demands of a variety of actors—economists and statisticians, politicians and diplomats, imperialists and anticolonialists, organized labor and business interests—that the nation-state assume responsibility for economic policy.
Rebuilding the economic machine. This design was proposed as a dust jacket for Tinbergen's Statistical Testing of Business-Cycle Theories. Copyright United Nations Archives at Geneva.
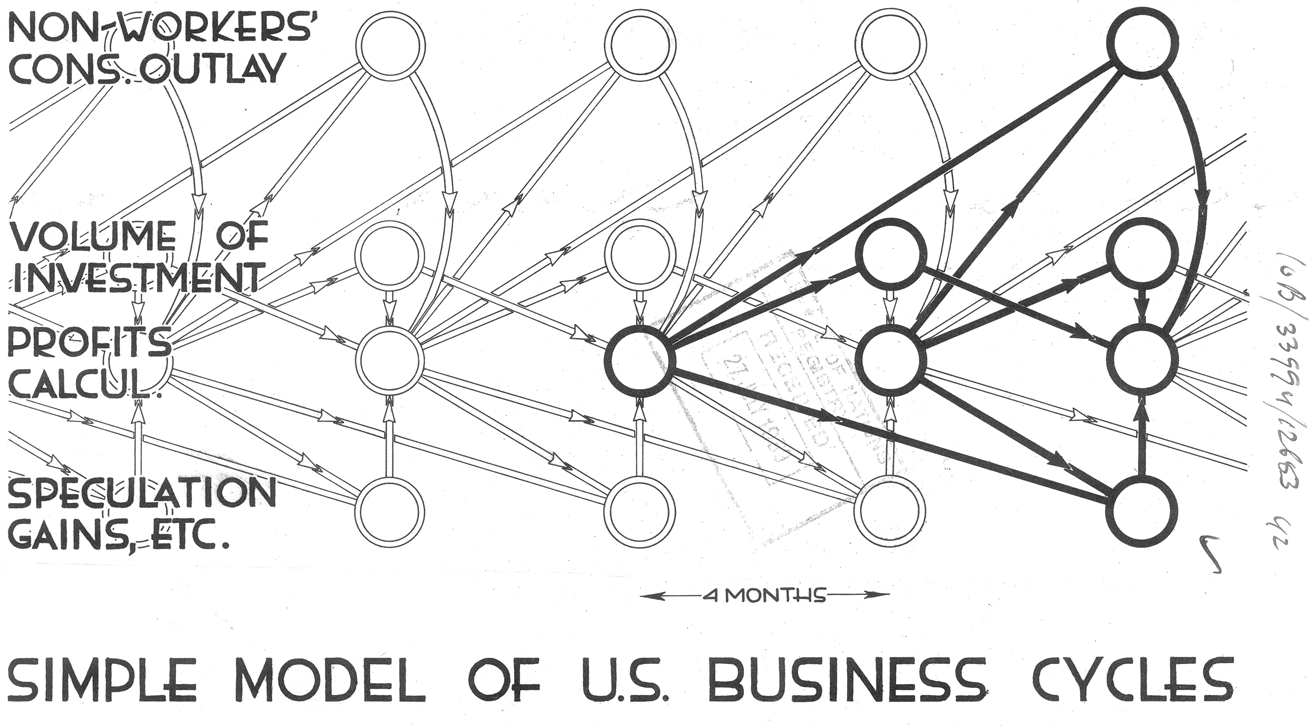
On the other hand, many of these same actors were internationalists for whom global cooperation was essential. They believed that social science could resolve disagreements over economic affairs, and they hoped to form a common policy based on a scientific worldview. “We have in front of us the foremost economists of the whole world,” said a British delegate to the League in 1930. None, she complained, had “anything like a scientific analysis” of the Great Depression's causes.Footnote 4 Models incorporated scientific intuitions and theoretical claims about the mechanism of modern economic life. Models appealed to both nationalist and internationalist sympathies due to their ambiguous, composite character, combining fact and theory, the particular and the general, the local and the global. The economic profession's adoption of modeling was a response to the nation-state's ascendance as a legitimate arbiter of economic policy, situated uneasily within a regime of international norms and institutions.
In 1969, Tinbergen shared the inaugural Nobel memorial award in economic sciences. But when his US model was initially published thirty years earlier, his colleagues reacted with bewilderment and dismay. At the time, economists understood their discipline in terms not of models but of scientific laws. Laws and models might be superficially similar. Both may be expressed as mathematical equations. To Tinbergen and his contemporaries, however, they presented very different kinds of claims about social phenomena. In contrast to models, which are intended to analyze characteristic economic problems or to describe economic conditions in a particular time and place, laws were understood as truths for all times and places. The concept of law defined economists’ understanding of their subject, and of themselves as scientists, in the period of the discipline's professionalization and modernization in the late nineteenth and early twentieth centuries.
It was not that economists believed that laws were really attainable in their field. Rather, precisely because economic laws seemed uniquely difficult to discover, the problem of induction, of generalizing from evidence to theory, distinguished economics as a separate kind of science. Natural scientists could generalize confidently from their observations by reproducing them in the controlled conditions of laboratories around the world (or so economists assumed). Due to the lack of controlled experimentation in economics, its applicability depended on national context. Great circumspection was required to use economic theory in any particular case, to put the science of economics into practice. “The economist has to be specially careful to make this clear; because there is much misunderstanding as to the scope of his science; and undue claims to authority on practical matters have often been put forward on its behalf,” Alfred Marshall said.Footnote 5 Tinbergen was accused of ignoring this caution. His models seemed to fuse theory and practice, promising a pragmatic expertise based on general principles.
The shift from laws to models was contentious because it implicated economists’ sense of their public role and professional identity, which had become ingrained through decades of controversy concerning international economic relations. These debates, which began in the nineteenth century, concerned both the epistemological and the juridical aspects of the concept of law. Universal laws of economics would not only hold good throughout time and space. They would also unite nations into one community, under a regime of economic governance that would enjoy legitimacy in every nation on earth. Because any justification of free trade and empire had to be sought in universal law, the question of the relativity of economic science became one of the essential problems of nineteenth-century political economy.Footnote 6
During the interwar period, the vision of a world government based on universal science continued to animate liberal internationalists. Madeleine Lynch Dungy quotes a French diplomat's proposal for an agreement on international trade, a multilateral convention that “abstracts from the specific economic conditions of each one of the parties.”Footnote 7 Abstraction ensured formal equality and fair play among the League's members by excluding variable and contingent circumstances that might otherwise excuse differential treatment. It was the task of science to discover the laws of economics. The task of international cooperation was to prepare the ground for their fulfillment, to establish conditions in which those laws would be true, not just in the abstract, but in reality.
The laws of economics did not discriminate. Ludwig von Mises, who taught in Geneva, praised “the universally valid laws of human action, i.e., laws that claim validity without respect to the place, time, race, nationality, or class of the actor.”Footnote 8 Likewise, Lionel Robbins wrote that “the laws of Economics” were not “limited to certain conditions of time and space” but possessed “universal applicability.”Footnote 9 Robbins was among those internationalists who called for the restriction of national sovereignty, especially in economic matters, by a world government.Footnote 10 These thinkers looked to the League of Nations to enforce a new system of global governance, modifying or repurposing older forms of imperial control.Footnote 11 Their aspirations were based on an epistemological assumption, that of universal law. For only a universal science could guarantee the legitimacy of a universal sovereign.
This ideal of an international order based on universal scientific laws was displaced in the middle of the twentieth century by a new understanding of the sovereign nation-state's responsibilities and capabilities in the economic domain. Scientific laws cannot be modified, but models sometimes imply the possibility of transforming the systems they represent. There were no “economic laws—sacred, inviolable, unchangeable,” declared Franklin D. Roosevelt in his speech at the Democratic National Convention in 1932. “Economic laws are not made by nature, they are made by human beings.” The use of models corresponded to this optimistic humanism. States could make and remake economies according to their own ends.
The mid-century transformation of economics into a modeling science was a consequence of specific, contingent circumstances, almost a historical accident. To fight the First World War, Europe's empires had compromised with their subaltern subjects, extending the franchise, empowering trade unions, and granting greater autonomy to colonial populations.Footnote 12 Because of these concessions, the anticolonial and labor movements had sympathetic representatives in Geneva at the beginning of the Great Depression who advocated for new methods in economic research, and the League became a major site of innovation in the field.Footnote 13 In response to the vague but widespread feeling that some new kind of social science was urgently necessary, the League's cautious secretariat—the permanent staff of civil servants who lived and worked in Geneva—offered Tinbergen the institutional and financial support to experiment with new statistical methods. But neither he nor anyone else really understood the implications of the modeling technique he developed.
That the League was one of the origins of the practice of modeling is typical of liberal internationalism's paradoxical relationship with national sovereignty.Footnote 14 The institutions of economic and financial governance established between the wars were not mere pawns of European and anglophone powers. Effective nationalist opposition forced these institutions to accommodate an understanding of sovereignty as freedom from foreign interference.Footnote 15 Consequently, as Glenda Sluga writes, “the League of Nations provided a crucial site for vocal criticism of the very powers and world order it had been expected to defend.”Footnote 16 These critics sought to reimagine the place of the nation within the international system, and, in particular, to articulate new modes of national economic control.
* * *
As a student in physics at the University of Leiden, Tinbergen joined a socialist youth organization which imposed a puritanical discipline on its members. They were required to dress plainly and to refrain from drinking, smoking, or using degraded speech, whether bourgeois or proletarian.Footnote 17 He remained abstemious in his personal habits throughout his life. He never drank, and his students shared stories about the rare occasions on which he would indulge in a sweet. The American economist Paul Samuelson called him a “humanist saint.”Footnote 18 Some had the impression that a kind of spiritual calling, a rationalist faith, informed Tinbergen's political commitments, his scientific agenda, and his unusual persona. He was convinced that a better world was possible, and that human beings had both the scientific capability and a profound duty to bring it about.
It is difficult to be sure, however, because Tinbergen did not speak publicly about his religious beliefs. He belonged to the Remonstrant Brotherhood, for whom faith was a private matter between the believer and God. In 1925, when the Dutch government was drafting young men to defend its imperial possessions in the East Indies, Tinbergen, then twenty-two years old, refused to help his case as a conscientious objector by declaring himself opposed on religious grounds. Instead, he chose to state a political argument against colonialism. Already, he had begun to elaborate his own answers to the questions of empire, economic governance, and international order that would occupy him throughout his career. In lieu of military service, he served a stint as a clerk in a prison. Through his father's connections, he was then transferred to the Central Bureau of Statistics in The Hague.Footnote 19 Tinbergen spent several formative years at the agency, reading the literature on economic statistics, familiarizing himself with the intricacies of the Dutch economy, and working out his distinctive practice of modeling.
There had been precursors to Tinbergen's work. The use of statistics in discourses on political economy dates to the early modern period.Footnote 20 With the beginnings of neoclassical economics in the late nineteenth century, economists started to employ calculus as well, applying the formalisms of thermodynamics to economic problems.Footnote 21 Physicists, who also became interested in these applications, had a tradition of reasoning with models. Tinbergen's adviser at Leiden, Paul Ehrenfest, was among those physicists who believed that to explain a phenomenon was to represent it with a mechanical model.Footnote 22 From this point of view, reasoning by analogy, applying knowledge from one domain in another, was not inimical but indispensable to scientific understanding. Like his friend Albert Einstein, Ehrenfest prized scientific work that permitted intuitive and immediate comprehension, a certain intimacy with the phenomena under investigation. Germanophone physicists called this virtue Anschaulichkeit. Ehrenfest hoped that the neoclassical concept of equilibrium could enable a scientific account of economic processes that possessed this quality. He encouraged Tinbergen to work on the problem.Footnote 23
But Tinbergen began to reject neoclassical equilibrium even before he completed his dissertation. At The Hague, he studied the Dutch potato flour industry, in which the neoclassical assumption of perfect competition was abundantly violated. The Netherlands produced more than three-quarters of the world's exports of potato flour, and one large agricultural cooperative accounted for the majority of Dutch output.Footnote 24 Likewise, a study of the shipbuilding industry showed the importance of businessmen's mistaken forecasts of demand for cargo. Time, error, and uncertainty were factors that neoclassicism neglected.Footnote 25 In the process, Tinbergen also abandoned the physical analogies that rendered neoclassical economics intuitive. His work became increasingly impenetrable. In a few years, another student of Ehrenfest's would complain that Tinbergen's research lacked the Anschaulichkeit that their mentor had esteemed.Footnote 26
Neoclassicism was not yet a predominant paradigm in economics, and Tinbergen's skepticism of an equilibrium concept modeled on a physical analogy was shared by much of the profession. Economists did not use the term “model” to refer to the products of their research, nor did objects resembling models enter general use, until after the Great Depression.Footnote 27 Irrefragable epistemic and professional norms restricted political economists’ acceptance of the methods of natural science. Marshall was among the most influential neoclassical economists who introduced physical analogies to economic reasoning. But he insisted that physical analogies were for pedagogical purposes only.Footnote 28 And he was famously ambivalent about mathematics.Footnote 29 He developed the schematic, two-dimensional diagrams of supply and demand that have since become ubiquitous in the field. Historians sometimes describe these diagrams as models. And they were indeed models in the generic sense in which the term is used by economists today to refer to simple mathematical objects used to formalize theories and intuitions. Yet these diagrams did not simultaneously represent empirical data and theoretical principles.Footnote 30 This was a defining feature of the models of the interwar years. Models that might have facilitated practical applications of economic theory would have contradicted Marshall's understanding of the economist's professional identity and proper role as a scientist in public life.
These norms remained in force in the early twentieth century, a period of innovation and rapid expansion in quantitative economic research. At The Hague, Tinbergen concentrated on the business cycle, then the principal topic in quantitative economics. The cycle had been recognized as a distinct object of study since the late nineteenth century, and business cycle researchers constituted a numerous, well-funded community.Footnote 31 The field was most developed in the United States, where business cycle studies had originated. The future president, Herbert Hoover, was an influential patron.Footnote 32 Researchers compiled economic data of all kinds, charting interest rates, price indices, bank clearings, wages, taxes, the volume of pig iron production, the number of empty railcars, the length of US Steel's list of unfilled orders, and the like. The production of these numbers was laborious and costly. As a result, while other topics of economic research could be pursued by the lonely academic, business cycle research was often conducted in specialized institutes. The word “laboratory” was sometimes used to describe these institutes, a conflation of natural and social science that annoyed more orthodox economists.Footnote 33 The laboratories circulated their data to businessmen, who could also subscribe to dozens of more or less scientific commercial forecasts and almanacs.Footnote 34 Tinbergen's agency received funding from the Rockefeller Foundation, which sponsored the effort to prevent industrial depressions and the class conflicts they engendered. Thanks in part to Rockefeller money, business cycle research became an international endeavor.Footnote 35
Business cycle researchers offered various diagnoses of and remedies for the cycle. Economists’ ideas about finance and the business cycle were heterogeneous and inconsistent.Footnote 36 Nonetheless, it is possible to categorize business cycle researchers based on how strictly they adhered to the liberal orthodoxy that predominated among interwar statesmen and financiers. According to the orthodoxy, depressions were to be alleviated through reductions of workers’ wages. Reduced wages would stimulate employment. The orthodox French economist Jacques Rueff exhibited no interest in the business cycle as an object of scientific inquiry. Industrial fluctuations were no more than the economy's movements about an equilibrium. There was nothing more for science to explain, and any intervention by the state would obstruct the necessary, deflationary adjustment to equilibrium.Footnote 37 The orthodoxy did not necessarily imply that global markets were self-equilibrating. The mechanism of the gold standard was not perfect or automatic. Yet any interference with it—for example, a reduction in the central bank's rate of interest during a crisis—was likely to prove counterproductive.Footnote 38 This was the position of the Austrian Institute of Business Cycle Research in Vienna, founded by Mises and directed by his students Friedrich Hayek and Oskar Morgenstern.
Less orthodox investigators advocated countercyclical fiscal policy. A. Cecil Pigou in Cambridge, Bertil Ohlin in Stockholm, and Ernst Wagemann in Berlin, among others, called for compulsory unemployment insurance, or for timing public works to coincide with recessions.Footnote 39 American researchers expected that businessmen could themselves avert the business cycle through rational, foresighted management based on timely and accurate data. But this theory did not necessarily imply a limited role for government in economic affairs. The state had to acquire and disseminate the data. Ignoring orthodoxy, Hoover attempted to accelerate spending on public works during the Depression, and reached agreements with organized labor to prevent reductions in wages.Footnote 40
Another intermediate position was occupied by monetarists such as R. G. Hawtrey, who argued that an expansion of credit during the crisis would be effective, but public spending would not.Footnote 41 Central banks could not expand credit, however, without a reform of the gold standard. The American neoclassical economist Irving Fisher argued for replacing the dollar, backed by gold, with a new currency based on a commodity price index.Footnote 42 The idea was popular in the Netherlands.Footnote 43 By 1934, Tinbergen had begun to work out his own theory of the business cycle. The neoclassical functions of supply and demand were only the proximate factors in the formation of prices, he argued. Demand was a function of purchasing power, increasing with wages in the course of the business cycle. At the same time, higher wages removed the conditions for profitability and thus limited supply, a constraint compounded by a deceleration in technological progress as the cycle advanced.Footnote 44 As a result, demand would exceed supply until a crisis began the process over again.
In an influential revisionist survey, David Laidler has denied that an orthodoxy existed at all in economic thought during the early twentieth century. No coherent body of thought approximating an orthodoxy was formulated until after the depression, and it was never endorsed by more than a minority of academic economists. According to Laidler, economic thought was transformed between the world wars, not by a revolutionary shift in doctrine, but rather by a new model, IS-LM. This model was a synthesis of previously existing ideas worked out by J. Maynard Keynes and his students, and it excluded the most radical contentions of Keynes himself.Footnote 45 Yet it would be difficult to forgo the concept of orthodoxy entirely in writing interwar economic history. Orthodox economists may well have been a minority in the academy, but academic economists were not an influential group at this time. As “a creed of bankers, businessmen, civil servants, and politicians, not of academic economists,” the orthodoxy prevailed among those whose opinions carried weight.Footnote 46 Not only capital, but labor, too, upheld the orthodoxy, believing that inflation would reduce standards of living, and distrusting any aggrandizement of the state's economic power. The term “orthodoxy,” or some synonym for it, is a useful one to describe what counted as prudent and respectable common sense in economic reasoning.
In any case, this article is primarily concerned not with how the IS-LM model came to be, but with how there came to be such things as models at all, and what the consequences of this new practice were for the representation of economic phenomena in social science and in politics. What unified business cycle research, above all, was an understanding of the field's basic epistemological problem, that of the relationship between fact and theory.Footnote 47 The goal of business cycle research was to erect “the very bridge between theory and reality that, in the domain of economic knowledge, has been under construction for generations,” wrote a German economist in 1926.Footnote 48 This was a daunting task. Business cycle researchers dealt in data, which did not speak for itself. Measurements of economic processes were variable and unreliable. Factors specific to a particular time and place influenced these observations. Prior to the Great Depression, quantitative economics remained divided into empirical and theoretical fields. Business cycle research was statistical, inductive, and empirical. Neoclassical economics was understood as a deductive and mathematical, rather than statistical, inquiry concerning the generally valid principles of economic phenomena.Footnote 49
If economic science had fundamental, universal principles, then statistics did not disclose them. “A quantitative study is bound to the existence of certain figures and numbers; these are limited in time and space; it is concrete, historical material,” wrote Oskar Morgenstern, later director of the Austrian Institute for Business Cycle Research. The problem was how to produce “a generalization from this historically unique, special material.”Footnote 50 As Morgenstern argued, business cycle research was inherently international. The available statistical evidence concerned economic conditions in particular countries. In order to generalize about the cycle, research had to be comparative.Footnote 51 To investigate the business cycle was to inquire into the geographical scope of economic theories, the universality of economic science, and, by extension, the legitimacy of the rules governing the world economy.
Consequently, although many orthodox economists did take up business cycle research, the field as a whole tended toward heresy, and developed something of a dubious reputation, particularly in the European academy. Regardless of the specific remedies offered by business cycle researchers, the objective that many of them shared was a synthesis of fact and theory, a natural science of economics, a kind of theoretical knowledge applicable to specific practical problems. The methods of business-cycle research suggested that, some day, the nation-state might possess both the capacity and the responsibility to intervene in the cycle, with uncertain ramifications throughout the international economic order. The revolution in economic doctrine associated with Keynesianism and the revolution in econometric methods, including modeling, were consequential for different reasons.Footnote 52 Tinbergen was a founding member of the Econometric Society, established in 1930. It was not a coincidence that the society's most active and innovative members sympathized with the left.Footnote 53
Tinbergen—who was, after all, not an economist by training—appears to have been unacquainted with the methodological debates that preoccupied his peers such as Hayek and Morgenstern. Instead, he wanted practical solutions to the problems of poverty and unemployment, the issues that had motivated him to study economic questions originally.Footnote 54 “To avoid the accusation of not being concrete, we have thus set up a model in which one can already investigate a whole series of important problems of business cycle elucidation and business cycle policy,” he wrote.Footnote 55 His pragmatism was a response to Europe's decay. The success of fascist parties after the Great Depression forced liberal and socialist politicians to develop concrete plans for economic recovery and expansion. These planning exercises required new applications of economic science.
An example was the Plan of Labor in the Netherlands, published in 1935. The plan included Tinbergen's first complete model, a model of the Dutch economy. In a separately published analysis of the model, Tinbergen advocated devaluation of the guilder as the most effective policy for mitigating the depression.Footnote 56 For orthodox Marxists, this conceded too much to bourgeois political economy. The depression was a consequence not of a deficient supply of money, but of immanent contradictions in the relations of production.Footnote 57 (The plan itself contemplated neither devaluation nor fiscal deficits, which were unpopular among workers.)Footnote 58 Devaluation would also reduce the purchasing power of workers’ wages, increasing the price of food and other foreign imports.
Tinbergen was a socialist, not a Marxist, and he repeatedly distanced himself from the Social Democratic Labor Party's policies and doctrines. As a student, he had written a journalistic article on the prohibitive cost of dues collected by the party, of which he was a member.Footnote 59 His advocacy of devaluation was consistent with his skepticism of trade unionism. Tinbergen argued that strikes could only increase wages for some workers at the expense of unemployment for others—at least in the Netherlands, a globally integrated economy in which imports accounted for a large share of consumption, and manufacturers were subject to constant competition from abroad.Footnote 60 A strong currency had an equivalent effect. Throughout his new biography of Tinbergen, Dekker shows how expertise can become an undemocratic mode of economic governance. Tinbergen's ambivalence toward Dutch labor could be adduced as an example.
Constructed with Dutch data, forecasting the trajectories of Dutch variables, Tinbergen's model appeared to prioritize Dutch economic interests above all. Devaluation would have had a deflationary effect on neighboring countries. The very method of econometric modeling seemed to undermine international order. One critic pointed out that the model appeared to justify a tariff, too, which would have had similar consequences.Footnote 61 This was not Tinbergen's intention. He was an ardent internationalist, and he tried to use the model to demonstrate the urgency of international coordination. On its own, the Dutch government could not insulate the small country from fluctuations on a global scale.Footnote 62 Geneva, imperfect as it was, was where the hope of international cooperation endured. Tinbergen moved there the next year, in 1936 (Fig. 2).
A new assignment. Tinbergen in his office at the League of Nations. Private collection. Used by permission.

* * *
The mission of the League of Nations was to keep the peace of the world. That the League failed in its mission does not mean that it was impotent. Careful revisionist scholarship in recent decades has refined historians’ appreciation of this institution.Footnote 63 For example, under the League's auspices, hostile nations cooperated to monitor infectious diseases even after the Second World War had begun in Europe. Protocols for reporting disease established by the League persisted under the World Health Organization.Footnote 64 In epidemiology as in other domains—such as nutrition, veterinary medicine, illegal drugs, human trafficking, and cultural heritage—the League's personnel continued working after its demise under the United Nations or other postwar agencies, relying on procedures and principles worked out in Geneva.Footnote 65 It would be difficult to make sense of the practicalities of postwar global governance without reference to the League's history. Even though major great-power diplomacy was not conducted under the League's aegis, foreign ministers and heads of state attended the Assembly's annual sessions. Geneva became a venue for informal conversations among leading statesmen and a forum for lesser potentates to make their grievances known. And, for a while, intelligent observers of the international scene believed that this system, imperfect as it was, could succeed. “This was not an age of illusions; it was a time of hope,” writes Zara Steiner. “Illusions are built upon nothing; hopes may have real foundations, however fragile or temporary.”Footnote 66
In the realm of finance, the League exercised real power through conditional loans to sovereign debtors. In 1922, the body coordinated an international loan to Austria. In exchange for credit, the Austrian government surrendered some functions of fiscal sovereignty to the League's representative in Vienna. He was empowered to supervise Austrian customs, and he had to approve any use of the funds raised through the loan, as well as any additional borrowing by the Austrian government.Footnote 67 The League replicated the Austrian arrangement in several of the financially insecure successor states of Eastern Europe, establishing a precedent for the International Monetary Fund's postwar interventions.Footnote 68 The fact that the United States was not a member weakened the League in many respects, but less so in financial affairs. This was because formal intergovernmental relationships were less important in international finance, which was largely the domain of central bankers, private investors, and academic experts.Footnote 69 Only representatives of the US government were absent from Geneva. Access to American capital meant contacts in New York, not Washington. In part through these contacts, the League's secretariat could implement a financial policy that was independent of the individual states members and their national interests.Footnote 70 The League was less successful in the domain of international trade, in which states retained greater sovereignty.Footnote 71 Sanctions on trade imposed by the League arguably deterred certain heads of state from military adventurism. But sanctions had incalculable effects on global markets, and might have exacerbated conflict among the great powers.Footnote 72
At first, the League pursued an orthodox economic policy of free trade and sound finance, intended to restore the globalized world economy that the First World War had destroyed. Credits like the Austrian loan enabled states to maintain exchange rates fixed in gold. Fixed exchange rates would provide a basis for meaningful negotiations to reduce tariffs according to the principle of the most favored nation, which required the League's members to treat all importers equally, regardless of nationality.Footnote 73 The League also published the first regular, timely, and comprehensive statistics on the world economy.Footnote 74 Louis Pauly has characterized these statistical publications as a form of “multilateral surveillance,” monitoring deficits that could endanger the fragile effort to restore the gold standard.Footnote 75
The supervisor of these statistical publications was Alexander Loveday, who later became director of the League's Economic and Financial Organization and recruited Tinbergen to Geneva. A graduate of Cambridge born in Scotland, Loveday had lectured on political economy at Leipzig before entering wartime civil service (Fig. 3). In most respects, his worldview was typically orthodox. He wrote in 1931 that unemployment insurance, which enabled workers to refuse reduced wages, was not just a primary cause of the depression's severity, but also a sign of the eclipse of liberalism. “The choice lies to-day, not between socialism and capitalism, but between Planwirtschaft—whatever the plan—and liberty,” he wrote.Footnote 76
Alexander Loveday. Copyright United Nations Archives at Geneva.

British diplomats had already begun to challenge this orthodoxy in 1928, when they initiated a dialogue in Geneva about the gold standard. The Labour government of Prime Minister Ramsay MacDonald was seeking to ease London's financial obligations. The resumption of the pound sterling's prewar parity with gold in 1925 had overvalued the currency. Credit and liquidity were limited, and unemployment was severe. In Geneva, a commission called the “Gold Delegation” was formed to statistically examine the global distribution of gold and its purchasing power in different countries. But French and British experts on the commission could not agree, reflecting their countries’ contrasting financial positions and opposing economic interests.Footnote 77 At the end of 1928, France possessed about one-tenth of the world's reserves of gold, or $1.3 billion. Over the next two years, France would import another $800 million.Footnote 78 The country enjoyed ample liquidity amid a worldwide shortage. The depression was milder there. More than 16 percent of British workers were unemployed by 1930, when the rate in France was less than 2 percent.Footnote 79 Meanwhile, the United States had accumulated an extraordinary quantity of gold—about two-fifths of worldwide reserves in 1928. Although Loveday was himself British, he was loyal to the international community and its monetary norms. He attributed Britain's woes not to French or American banking policy, but to British workers’ refusal of reduced wages, and “to a simple and general failure to compete.”Footnote 80
The project that eventually culminated in Tinbergen's model can also be understood as part of the British effort to use the prestige and scientific authority of the League to reexamine the gold standard. The project began with a resolution calling for an investigation of the business cycle introduced at the League's Assembly in 1930. The resolution's sponsor was a delegate of India, the economist J. C. Coyajee, a knight who had studied under Marshall at Cambridge.Footnote 81 In a show of intra-imperial solidarity, the motion received enthusiastic support from the delegates representing the British Empire and the dominions. The delegation of Japan's liberal government also supported the proposal. Japan's financial condition was analogous to Britain's. Both countries had overvalued their currencies, resulting in withdrawals of gold and acute economic dysfunction.Footnote 82
Other delegates criticized the proposed research by questioning the universality of the science on which it was based, and thus its appropriateness for the League as a parliament of all humankind. Czechoslovakia had just been emancipated from Austro-Hungarian rule and had not yet satisfied the empirical conditions presupposed by a liberal economic science, said Stephen Osuský, the country's ambassador. “Scientific theories based on economic conditions and matured under the sunshine of freedom may contain factors calculated to arrest the growth of a plant which germinated and sprang up when freedom was in shadow,” he said “Formulas and theories are of neither more nor less value than the ideal and the cause that they claim to serve.” He insisted on Czechoslovakia's right to “economic independence.”Footnote 83 Together with delegates of other new states in Eastern Europe, Osuský asked the League to take immediate action by supporting a protective customs union for cereals on the Continent. A customs union, however, would eliminate one of the most important markets for grain grown in the British dominions.
For Osuský, business cycle research was an implement of British hegemony, but for Loveday it was an attempt to subvert the international economic regime. Loveday privately dismissed the project's supporters as malcontents of the liberal order, “labour governments” and “extra-European countries,” as well as nations with severe unemployment. This motley alliance between the left at home and nationalist movements overseas lacked a firm grasp of economic theory, he argued. “It seems to me obvious that if you want to deal with a depression you have got to deal with it before it starts and not after,” he wrote, adding that the proposed research lacked academic rigor.Footnote 84 After the Second World War, Loveday continued to deny that non-Europeans deserved an equal say in world affairs, complaining that newly independent postcolonial states enjoyed equal voting power in the UN General Assembly.Footnote 85 Nonetheless, it fell to Loveday to supervise the new project. Without disguising his opinion, he delicately arranged for Ohlin, the Swedish economist and future Nobel laureate, to be seconded to the League to make an initial report.
Just as French experts opposed British interests on the Gold Delegation, they tried to circumscribe the business cycle project, which they could not suppress entirely. Coyajee's motion was approved after a French effort to divert it failed, and Loveday duly convened a committee of experts, which met several times in Geneva the following year. French rhetoric in these meetings invoked the responsibility of the League, as an international body, to produce scientific knowledge of universal validity. Lucien March, the director of a business cycle research institute at the University of Paris, insisted that the League avoid “the construction of new theories.” Any theory constructed on the basis of statistical data would be vulnerable to the objection that it lacked universal validity, and thus favored some countries’ interests over others. The secretary general of the National Economic Council of France reiterated this argument. “He believed that an interpretation of facts proposed by the League of Nations would be an official international interpretation, and he knew what was at stake. He did not believe that any state would ever consent to the official interpretation of economic facts with which it was well acquainted,” the minutes state.Footnote 86 Contemporaries debated the limits of national sovereignty in epistemological terms.
Meanwhile, Loveday was warming to the idea of business cycle research. He himself introduced the idea of putting together a staff in Geneva to study the business cycle. He claimed that this was not his own idea, and that “the Assembly itself seemed to hint” at it, according to the minutes.Footnote 87 In fact, Coyajee's vaguely worded resolution, which the Assembly had passed, provided no definite mandate. Loveday's orthodoxy did not prevent him from recognizing that the attempt to restore the old economic order was misguided, based on “a picture” of life before the war that was “largely imaginary,” and that regulation by governments was necessary, in particular to restrain monopolies.Footnote 88 Further, he was prepared at least to entertain a reform of the gold standard. The standard was established not by international treaties, but by national statutes. These laws and their interpretation depended ultimately on a mentalité, consisting of financial practices and commercial rules of thumb connected to cultural understandings of peace, progress, and modernity.Footnote 89 “Currency legislation to-day is largely the outcome of a slowly accumulating body of tradition and convention,” Loveday wrote. “What convention has created, convention can modify.”Footnote 90
Loveday personified the intellectual transformation of the League. Because interwar liberal orthodoxy was a versatile and heterogeneous collection of doctrines, Loveday and his colleagues at the League never had to reject it decisively. Rather, they gradually incorporated new policies and new worldviews into this orthodoxy. As Laidler argues, many of the premises of the postwar Keynesian synthesis can be identified in the orthodoxy of the early twentieth century. Admittedly, according to the strictest interpretation of that orthodoxy, any intervention, including lowering interest rates, would only prolong a depression. Deflation was the only escape. This position rapidly became untenable, however. Orthodox economists found that they could rationalize looser rates by arguing that inflation and deflation achieved the same practical result, that of reducing real wages.Footnote 91 Even Mises was willing to suggest that a reduction in interest rates might be effective in some circumstances.Footnote 92
With this concession granted, it was possible to conclude that the real problem was the gold standard, which constrained central banks’ ability to adjust interest rates. An understanding of the rules of global finance as conventions subject to revision, shared by Loveday and other experts, suggested that this constraint could be relaxed. Devaluation of the currency permitted the government to borrow. Fiscal and monetary policy could be interpreted as alternative means to the same end, that of increasing prices. Finally, if the deflationary effects of a devaluation on a country's trading partners could be excused, then tariffs might be forgiven as well. By the Second World War, the League had shifted from orthodoxy to a full-employment agenda, encompassing devaluation, fiscal deficits, and, in some cases, tariffs.Footnote 93 This is an approximate reconstruction of the logical space that Loveday, his colleagues in Geneva, and many other economists traversed after the Great Depression. At the time, however, none of this logic seemed incontrovertible. Each antecedent implied several possible consequents, and each inference was hotly contested.
* * *
As Loveday readied the League's statistical apparatus for the task of investigating the causes of the Great Depression, he designed an agenda for business cycle research in Geneva that was responsive to current debates about the universality of social science. He planned an investigation in three phases. Ohlin's report, published in 1931, constituted the first phase, a strictly empirical investigation of the facts of the depression. Conversely, the second phase would be theoretical. A logical and analytic treatment of current theories of the business cycle would prepare them for the third phase, a synthesis of the facts and the theories. “Every country affected by a depression is, it is true, different from every other, every age different from the age preceding it, every depression different in many details from every other,” Loveday wrote. Nonetheless, the fact that so many depressions followed a similar pattern suggested that they might have a single scientific explanation.Footnote 94 His agenda—fact, theory, and synthesis—reflected conventional methodological divisions in quantitative economics. This plan for the research can be regarded as an effort to compromise between demands for national autonomy in formulating economic theory and the desire for a scientific account of the depression validated by the League's prestige and authority, a theory that could unify the international community.
As the business cycle project came into being, economists debated its implications for the question of national sovereignty and international order in terms of the differences between the natural and social sciences, between scientific methods that produced generalizable knowledge and those that did not. Loveday and Ohlin hoped to establish a “laboratory” for business cycle research in Geneva.Footnote 95 Yet calculating machines and computational labor were expensive.Footnote 96 After a hiatus due to the depression's effect on the League's budget, Loveday solicited the Rockefeller Foundation. The organization sponsored business cycle research at fourteen European institutions during the depression, including the League.Footnote 97
Loveday assigned the second, theoretical phase of the research to the Austrian economist Gottfried Haberler. The League published his results in 1936 in a volume entitled Prosperity and Depression, which proved commercially successful as a textbook.Footnote 98 Haberler began by acknowledging the essential difficulty of business cycle research, the geographical and historical specificity of economic statistics. The scope of business cycle theories was limited in time and space, Haberler wrote. Those that were true in industrialized countries might not be true in “New Zealand or Roumania.”Footnote 99 Haberler argued it was possible to develop a general theory of the business cycle, valid in many countries and periods, but not a universal one. His account assumed the existence of a free market and monetary exchange. These assumptions were reasonably general but not, he conceded, satisfied everywhere.Footnote 100
Perhaps Loveday should have anticipated some opposition to his decision to place Tinbergen in charge of the project's third phase in 1936. He was not an obvious candidate for the job. He was charismatic—“handsome,” Keynes wrote—but young and unproven.Footnote 101 When Loveday asked Robbins for his recommendation on Tinbergen, Robbins gamely replied that Tinbergen was “a very good man” and “certainly a very charming person,” but wondered “whether he is not rather light artillery for your job.”Footnote 102 He added that Tinbergen did not always appreciate the differences between the natural and the social sciences. Tinbergen's expertise was in physics and statistics, not in economics.
Economics was not yet thought of as a primarily quantitative discipline, and mathematics was subordinate to economics in Loveday's laboratory. He hired Tinbergen, but with the caveat that he would work under the respected British economist Dennis H. Robertson as a kind of supervising consultant. Loveday explained that the project “needs something more than specialised mathematical work. It needs to be watched and directed by a really competent economist.”Footnote 103 Tinbergen's compatriots Jacques J. Polak and Tjalling Koopmans, who later won a Nobel of his own, worked with him on the third phase. So did two mathematicians, Dorothy P. Etlinger and Mlle S. Godard. Despite their credentials, these women were “paid 2/3 of men's rates,” Etlinger complained.Footnote 104 Etlinger was a member of the Council of the Royal Statistical Society, while Loveday called Godard a “highly qualified mathematician.”Footnote 105 Although they had other responsibilities, these women seem to have been tasked with some of Tinbergen's calculations. Godard was paid out of the Rockefeller grant.Footnote 106 Under this group, in addition, there were a number of male and female computers.Footnote 107 Mathematics and statistics were regarded as ancillary and inferior disciplines, hardly more sophisticated than rote calculation.
One reason why calculation was deprecated in interwar social science was, again, that statistical and quantitative research could only yield locally valid data, while economists sought a science of universal laws. Suppose, wrote Robbins, that a statistician estimated the elasticity of the demand for herrings in the years 1907 and 1908 at one-third. “What reason is there to suppose that he was unearthing a constant law?” Robbins asked. Any number of contingent factors could influence the elasticity of the demand for herrings. “The ephemeral results of an Eat British Herrings campaign” might skew the numbers. So could a shift in consumers’ “theological views.”Footnote 108 Business cycle research was preoccupied with trivial calculations of this kind, Robbins wrote.
This example illustrated what economists regarded as one of the essential differences between natural and social science. In the natural sciences, physical constants were truly constant, assumed invariant throughout not only human history but the entire cosmos. In econometric models, the constants (such as the elasticity of the demand for herrings) might conceivably vary with all of the social and political factors that influenced economic life. These included institutions of credit and finance, systems of taxation and revenue, the strength of organized labor, the presence of industrial cartels, and, above all, the psychology of investors and consumers, which was partly a matter of national character.Footnote 109 The meaning of Tinbergen's constants was the theme that unified the diverse criticisms of his work. Whether his models really satisfied the international community's need for a universal social science depended on the interpretation of the constants.
J. Maynard Keynes, who read Tinbergen's proofs over the summer of 1938, insisted that economics was a “moral science,” essentially different from “chemistry and physics and other natural sciences.” In those disciplines, “the object of experiment” was to measure physical constants. But human societies were volatile, and could not be described with constants. Tinbergen's model seemed to exclude variations in “the state of confidence, inventions, labour troubles, political measures, wars and so forth,” Keynes wrote, accusing Tinbergen of ascribing “general validity” to his coefficients. To assign constant values to the coefficients in an economic model was “to destroy its usefulness as an instrument of thought.”Footnote 110 When Keynes's letter arrived in Geneva, Loveday seconded these objections.Footnote 111 Much later, Tinbergen would recall a meeting with Keynes in 1946. “I told him that we had done quite a bit of research on the price elasticity of exports and that we had really found that the elasticity is about 2, the figure that he uses in his famous book,” Tinbergen said, referring to The Economic Consequences of the Peace. “But he only said: ‘How nice for you that you found the right figure.’”Footnote 112 Keynes never saw the point of estimating coefficients. The values were likely to change anyway.
Keynes did not object to models as such, but he argued that the lack of true mathematical constants implied that multiple models might be applicable in any given situation. Choosing among them required “introspection and judgments of value,” informed by “intimate and messy acquaintance with the facts,” Keynes wrote. These qualities constituted a “habit of mind which is most important for an economist proper,” a way of thinking “directly counter” to that encouraged by “the pseudo-analogy with the physical sciences.”Footnote 113 The choice of models was not ultimately scientific at all. “Economics is a science of thinking in terms of models joined to the art of choosing models which are relevant to the contemporary world,” he wrote.Footnote 114 Keynes's letters, which reflect considered opinions about the use of models in the social sciences, show that modeling had become a topic of conversation among economists by this time. Still, there was no agreement about what models were. Across the Atlantic, Joseph Schumpeter wrote that models consisted only of definitions of economic concepts and analytical relationships among them, excluding both statistical evidence and theoretical hypotheses.Footnote 115 This understanding of a model contrasts with both Keynes's and Tinbergen's.
Tinbergen did not regard the coefficients in his models as universal constants. They could be modified by means of policy. “The question on which everything turns is thus: How shall one determine or, as the case may be, modify the elementary coefficients so that the economic process reacts as favorably as possible?” he wrote.Footnote 116 Tinbergen used the model of the US business cycle he had created in Geneva to show how the federal government could modify the country's economic structure to reduce the severity of depressions. Reduced taxes and increased spending on public works would alleviate a depression, as would an overall reduction in income inequality. Tinbergen also represented weakened unions by increasing the elasticity of wages. This was the kind of structural reform favored by orthodox economists at the time. But Tinbergen did not think that a more elastic economy was more resilient. Unions, cartels, and planners could agree to maintain the stability of employment and prices. He used his model to confirm this argument.Footnote 117
Among the more controversial coefficients in Tinbergen's model was the marginal propensity to consume. According to Keynes and his students, this value decreased with the inequality of income, implying that maintaining full employment would be more difficult in unequal societies. Further, the marginal propensity to consume was thought to fluctuate, amplifying the business cycle. Robertson, Loveday's consultant, was under the impression that Tinbergen assumed a constant marginal propensity to consume. Just before the model's publication, Robertson asked that his name be removed from the preface.Footnote 118 “The coefficients arrived at are apparently assumed to be constant for 10 years or a larger period,” Keynes wrote. “Yet surely we know that they are not constant. There is no reason at all why they should not be different every year.”Footnote 119 Tinbergen's rejoinder is instructive. “There may exist certain definite reasons that cause coefficients to change every year—coefficients changing just by chance would, of course, render this method as well as the whole of quantitative economic science impossible. E.g. the marginal propensity to consume may diminish when the distribution of income becomes less even,” he wrote.Footnote 120 Tinbergen believed that coefficients could be changed to fashion a more rational, more egalitarian economy that was less susceptible to crisis.
The question was whether Tinbergen's coefficients represented historically observed correlations of no enduring significance, or described a more permanent causal structure. The problem was that there was no single statistical procedure that could reliably identify the relevant causal relationships. In his publications at this time, Tinbergen typically placed quotation marks around the words “explain” and “explanation.” Presumably, his intention was to clarify that his models could not provide causal explanations, only “explanations” in the statistical sense, then still novel, of revealing correlations in the data.
Tinbergen's approach was experimental and ad hoc. He began with a few intuitions, and added or threw out variables depending on the performance of the model under construction. “One cannot know a priori what variables are necessary and what can be neglected in the explanation of the central phenomena that are under consideration,” he wrote.Footnote 121 But the models could not simply be evaluated according to the coefficient of correlation, the fit between the observed data and the model. Tinbergen provided the following example. A researcher estimating the demand for butter would need data, first of all, on the price of butter. But the price of margarine might be important as well, since consumers could substitute cheaper margarine for butter. Unfortunately, margarine and butter prices were likely to be correlated both with the demand for butter and with each other. That is, the two prices are “collinear.” Incorporating into the model the price of both margarine and butter might generate a better correlation. But collinearity can generate meaningless results in multivariate regressions, rendering the model useless for practical purposes.Footnote 122
To test for collinearity, Tinbergen used “bunch maps.” Like many of his techniques, these maps were devised by the Norwegian economist Ragnar Frisch, with whom Tinbergen later shared the Nobel citation. The map was an array of small plots, each containing a “bunch” of vectors (Fig. 4). If adding a variable shifted the vectors closer together, then the degree of unexplained variation had been reduced. If the researcher introduced a collinear variable, the bunch “exploded.” A typical map took thirteen hours to draw.Footnote 123 Frisch and Tinbergen regarded this labor as unavoidable, because the modeler could not depend on economic theory to determine, in advance, which variables to include in the model.Footnote 124 A problem with this method was that variables might be both collinear and economically significant. For example, eliminating the price of margarine from a model might yield a more accurate estimate of the elasticity of the demand for butter. But margarine prices were nonetheless important for the statesman contemplating a butter subsidy, and the model would be of no use in predicting their effects.
Building a model with bunch maps. Tinbergen used these maps to experiment sequentially with different combinations of variables. Here, the bunches that include the vector numbered “2,” representing profits, appear more compact. This was evidence of the explanatory value of profits, which he argued drove the business cycle by providing firms with funds to invest and improving businessmen's confidence. Copyright United Nations Archives at Geneva.

Frisch stated the issue clearly. He distinguished between the structure, which might include superficial statistical correlations, and the more basic, more permanent causal nexus that determined them, formed of relations he termed “autonomous.”Footnote 125 For example, monitoring the performance of an automobile engine during repeated speed tests might yield very precise correlations. But these were not relationships of the kind that an engineer would need to understand in order to predict the engine's performance in traffic, or to fix the car if it broke down.Footnote 126 Frisch argued that Tinbergen's model could not distinguish between the two kinds of relationship. In contrast to Tinbergen's other detractors, Frisch shared Tinbergen's understanding of the model's purpose—not to discover universal economic laws, but to modify the structure of the economy. Precisely for this purpose, however, assumptions about permanent causal mechanisms were indispensable.
To use the models to predict and evaluate the effects of policies, Tinbergen had to assume that the coefficients remained constant before and after a given policy was introduced. He might have been uninterested in universal law, but the quantitative relationships constituting the model would have to remain valid—if not for all time, then at least for some time after the data had been collected. Tinbergen attempted to quantify the effect of the New Deal by holding the model's coefficients unchanged for the periods before and after Roosevelt's inauguration in 1933. This exercise yielded a contradictory result. The US economy's observed performance was worse than the model would have predicted, suggesting that the New Deal had prolonged the depression.Footnote 127 Tinbergen was reluctant to find fault either with Roosevelt or with his own model. Instead, he hypothesized that businessmen simply did not understand the president's policies, resulting in a failure of confidence. An American economist in Geneva, who might well have read Tinbergen's draft, offered a more persuasive interpretation. The catastrophic banking crisis of 1931 and 1932 in the United States had altered the structure of the US economy. A model that was valid for previous years would cease to be valid afterward.Footnote 128 The coefficients would have to be changed. To avoid offending Washington, the League never released Tinbergen's analysis of the period after Roosevelt's inauguration. When the model was published 1939, the results were already seven years out of date.
Ohlin called himself “one hundred per cent. sceptical” of econometrics during a conference at the League in December 1938. “There are very many different circumstances which vary from one country to another,” he said. In other cases, statistical evidence showed discrepancies in the constants for different countries, when economic intuition suggested that the constants ought to be the same. To “base practical conclusions” on econometric evidence was misguided. Tinbergen's models consisted of “a limited number of equations” that “highly simplified” economic reality, Ohlin said. “On the basis of those simplifications we cannot draw any conclusions that are valid for the whole world.”Footnote 129 Tinbergen was absent, having already submitted his proofs and returned to The Hague. Instead, Ohlin harangued Tinbergen's assistant Koopmans throughout the conference, which went on for four days. Koopmans complained to Loveday about Ohlin's treatment of him afterward. Loveday was unsympathetic.Footnote 130
Tinbergen and Koopmans could not provide an explanation of their methods that was acceptable to other economists. When Ohlin asked Koopmans to clarify one equation in “commonsense terminology,” Koopmans could only refer somewhat vaguely to the structure of the model.Footnote 131 Keynes could not make “head or tail” of the model.Footnote 132 Tinbergen was “incapable of arguing in a normally logical manner from premises to a conclusion,” Loveday complained to Robertson. “Do you think he can ever do it?”Footnote 133 Frisch insisted that only a model of autonomous relations would qualify as “a real explanation.”Footnote 134 Koopmans tried to argue that Tinbergen's usage of quotation marks showed that his explanations were merely statistical, not theoretical, meaning perhaps that Tinbergen's models truly identified only correlations, not causal relationships. The purpose of econometrics was not “the production of a new theory in competition with existing work,” Koopmans wrote. “It may be that some misconception in this connection is due to Tinbergen's use of the word ‘explanation’ in inverted commas at the top of his graphs,” Koopmans wrote, “though the inverted commas should prevent the above inference being made.”Footnote 135 Tinbergen's colleagues found such “explanations” incomprehensible.
By 1939, international unity in economic affairs seemed more important than ever, and national autonomy more dangerous. Loveday conceded that expansionary measures could be beneficial, but these benefits required that national governments coordinate their responses.Footnote 136 National governments had tried to provide relief for the unemployed during the depression, and were then forced to impose tariffs and devalue their currencies to finance these costly programs. These policies worsened the situation in other countries, according to a report the League published in 1945. “It would have been morally impossible for the governments to have stood idly by,” yet these actions “inevitably contributed to the fractionalization of the world economic system.”Footnote 137 In principle, national governments need not have been at cross-purposes. Coordinated monetary expansion was possible. Yet there had been “no agreed opinion,” no “common view” or “doctrine” regarding how to combat the depression. Cooperation was impossible “in default of a common philosophy.”Footnote 138 Tinbergen's mathematical models describing the economic structure of a nation using national statistics might well justify a national policy in response to the depression, but contemporary observers hoped for an international solution based on a shared worldview. The kind of general theory required for an effective international response to the depression would have required constant coefficients, valid throughout the whole world.
* * *
Despite economists’ initial skepticism, Tinbergen's research became the impetus for the transformation of economics into a modeling science. Modeling was, in part, a response to a dilemma peculiar to the League. The idea of universal law in social science justified internationalist ideals, which were paramount during the depression. A solution to the economic crisis was inconceivable without orderly cooperation among states. But any international, collective response would have to respect the autonomy and sovereignty of the states members of the League. Econometrics, which promised to combine mathematics and statistics, theory and observation, the global and the local, seemed to be a way out.
Econometric models were among the quantitative techniques that enabled new representations and conceptualizations of the economic domain in the middle of the twentieth century. It was at this time that the familiar English phrase “the economy” entered common use. Timothy Mitchell was among the first scholars to observe the historical novelty of this term, and he suggested that Tinbergen's models were decisive for a new economic worldview.Footnote 139 Tinbergen was probably the first to produce what he called “a model of the economy” (ein Modell der Wirtschaft).Footnote 140 Yet Mitchell's reading of the economy as a domain putatively independent of cultural and political life, as “a singular and self-contained totality” and “a machine whose internal mechanisms and exchanges separate it from other social processes,” does not correspond to Tinbergen's conception of modeling.Footnote 141 For him and many of his contemporaries, the purpose of models was precisely to subject economic arrangements to scientific scrutiny and political control.
For these reasons, the concept of the economy was initially associated with the political left's projects of economic planning by the sovereign nation-state. At the Cowles Commission in the United States, the socialist émigrés Jacob Marschak and Oskar Lange and the American communist Lawrence Klein were responsible for the continuing influence of Tinbergen's work, which became the paradigm for decades of elaborate and computationally intensive model construction.Footnote 142 For Mises, however, the newfangled phrase “the economy” was nothing more than the familiar German word Volkswirtschaft in translation. It meant “a sovereign nation's total complex of economic activities directed and controlled by the government. It is socialism realized within the political frontiers of each nation.”Footnote 143 The idea of the economy was predicated on the ideas of sovereignty and national identity. The economy was imagined as located spatially within national borders, subject to the control of national governments, a symbol of the success or failure of national development.Footnote 144 It was initially difficult to reconcile the idea of the economy with the neoliberal understanding of world order.Footnote 145 As Martin argues, postwar international institutions were reluctant to grant economic sovereignty to states too weak to seize it for themselves.Footnote 146 Nonetheless, there was a shift in how the space of the world economy was conceived. Models corresponded to a new sense of the capacities of the nation-state to reengineer the economic domain.
Meanwhile, economists gradually abandoned the discourse of universal law. The idea of a universal law was incoherent, wrote the Cowles Commission's Trygve Haavelmo in a seminal 1944 publication on probability. The claim that “[i]n economic life there are no constant laws” was equally “meaningless.”Footnote 147 No proposition in science was meaningful without a specification of the conditions in which it would hold—or, as he wrote, the experimental design that would confirm the claim. Once the experimental design had been specified, all other factors—what previous economists had thought of as geographical and historical variability—could be summarized in terms of random error. The debate about the universality of economic science that had begun more than a century earlier was coming to an end. Instead of general laws, economists would reason about models. Philosophers of science who are interested in causality continue to cite mid-century econometric debates about modeling.Footnote 148 For example, Haavelmo's argument resembles Nancy Cartwright's account of models as “nomological machines.”Footnote 149 There are no universal laws until the conditions in which regularities can be observed are manufactured.
Models are representations of counterfactual worlds, which several philosophers regard as essential to reasoning about causality. Social scientists attribute causal significance to some factor by imagining its presence or absence in an irreal world.Footnote 150 These worlds, however, are not mere logical constructions. They must be different from our own, yet sufficiently similar to ours to be interesting. The use of models as scientific objects is a narrative and imaginative skill. The term that economists themselves use to describe the interpretation of a model is a “story,” a narrative explanation of the phenomenon under investigation in terms of identifiable motivations and expectations.Footnote 151 That is, scientific accounts on the basis of models must include persuasive characters. They must have a certain logic and coherence. Models are fictions, idealizations that contain scientific truth, not in virtue of their verisimilitude, but precisely because they deviate from reality.Footnote 152 Modeling is a matter of storytelling, of world-making.
The fictions that models produce form a genre that might best be described as utopian. The counterfactual worlds contained in models are images of how the real world might be. James Woodward writes that a causal explanation in science is an answer to a question of the form, “What if things were different?”Footnote 153 In economics, such ordinary questions always have political consequences. Using models, economists tell stories about how the real world works, and how it might be reconfigured and reconstructed. As Tinbergen wrote to Haberler, the goal of econometrics was “to change the structure of society” to eliminate business cycles entirely.Footnote 154 In Frisch's words, “I conceive of the possibility that the structure may have been different from what it actually is.”Footnote 155 Later economists did not share Frisch's and Tinbergen's socialism. But they did share a conception of models as “artificial worlds”—and a revolutionary ambition to reengineer economic relationships according to scientific principles.Footnote 156 Postwar economic science has been unified by a continual effort to reform, regulate, and restructure the economic domain, as represented in econometric models. The polychromatic light of an extinguished utopianism still touches that curious object of postwar social science, the economy.
Acknowledgments
The author thanks Jacques Oberson and the supremely expert staff of the United Nations Archives at Geneva. In addition, Erik Baker, Marcel Boumans, Erwin Dekker, William Deringer, Peter Galison, Rebecca Lemov, Harro Maas, Stephen Marglin, Emma Rothschild, and many others provided helpful suggestions and thoughtful criticism. Research in Geneva was conducted with the financial support of the Center for History and Economics, Harvard University.



