

The traditional links made by many sociologists and late twentieth-century observers between large cities and higher levels of lethal violence have recently been challenged by a number of historians. After collating research on recorded homicide rates across seven centuries and most parts of Europe, Manual Eisner, for example, put forward precisely the opposite thesis that ‘homicide rates were negatively correlated with urbanization and industrialization’, and this is rapidly becoming the new consensus among historians.Footnote 1 By exploring the often neglected spatial dimension of this issue for one area undergoing rapid urbanization and industrialization – England and Wales between the late eighteenth century and the mid-nineteenth – this article challenges that new consensus and re-assesses the relationship between recorded homicide rates and both modernization and urbanization. This period has been identified by Eisner as a key moment of differentiation. ‘By the beginning of the nineteenth century’, he concluded, ‘the impact of different long-term trajectories in the evolution of serious interpersonal violence since the Middle Ages had created a pattern of large-scale regional differences within Europe.’Footnote 2 Yet no research has yet been done on regional variations within Europe's first industrializing nation and an exploration of those variations therefore forms the kernel of this study. After exploring the two opposing views outlined above, and discussing the methodological problems homicide statistics create, this article focuses mainly on the first two decades for which detailed centrally collected county rates are available – the 1830s and 1840s – as well as looking at the more limited late eighteenth-century and early nineteenth-century evidence. This data raises fundamental questions about the links historians have recently made between urbanization and low homicide rates, since in most counties the very opposite appears to be the case. Potential explanations for the systematic and large variations in recorded murder rates between urban and rural areas are then explored.
I
The relationship between homicide rates and urbanization has produced two starkly contrasting analyses amongst historians and criminologists. The most popular and, until recently, the dominant view equates cities with higher levels of lethal interpersonal violence and there is much recent evidence to support this hypothesis. In the final third of the twentieth century, the largest cities in both Britain and the United States experienced murder rates that were very much higher than the national averages for those countries. In the two decades before they started to decline in the 1990s, New York's recorded homicide rates were triple the United States average,Footnote 3 and in the 1970s there was a systematic relationship between city size and recorded homicide rates in America (once an urban area reached a population of 100,000). The homicide rate in cities with over one million inhabitants averaged 23·2 per 100,000 and that of cities between half a million and a million was 20·3, compared to a rural rate of 6·4. In Britain the differences were less stark, but equally clear. In the 1990s London's homicide rate was over 60 per cent higher than that of England. Glasgow's was more than two and half times the Scottish average.Footnote 4 Not surprisingly these patterns – and parallel differences in continental European countries – have reinforced the negative views of the city developed both by early sociologists such as Emile Durkheim and by the Chicago School in the 1920s.Footnote 5 These analyses assumed that large cities inevitably create higher levels of crime and violence because they attract many poor migrants into an alienating environment that encourages anonymity, because they erode informal community-based sources of control, and because they contain areas that suffer from large-scale social disorganization. Rural areas, by contrast, are largely portrayed in this model as tranquil, law-abiding, and less violent – a view also advanced by Adam Smith in the eighteenth century.Footnote 6 However, several historians have recently argued strongly against this idea that cities tend to have higher homicide rates.
Three strands of research have come together to reinforce this very different view. The first centres on several studies of American homicide rates in the later nineteenth and twentieth centuries, which have emphasized the untypicality of the final third of the twentieth century. Eric Monkkonen's discovery that New York homicide rates were lower than the national average from the late nineteenth century until the 1950s, led him to argue that ‘the rogue tidal wave of violence in the last quarter of the twentieth century’ had created a potent, but entirely unfounded, myth that ‘cities are cauldrons of murder’.Footnote 7 Roger Lane's research on Philadelphia, a rapidly growing industrial city, also revealed that homicide rates fell steadily after 1850, and continued to drop well into the twentieth century, leading him to conclude that ‘as the urban industrial revolution finally took off in the United States, the most dramatic single index of this change … was a substantial drop in the homicide rate’ and that ‘through most of American (and English) history cities were generally more peaceful than the countryside’.Footnote 8
This view has been reinforced by the conclusions Eric Johnson and Howard Zehr drew from their quantitative research on crime in nineteenth-century France and Germany.Footnote 9 Although these authors mainly focused on property crimes and based their conclusions about violent crime principally on the statistics for assault – an index which (as I have argued elsewhere) is immensely problematic,Footnote 10 they also worked on homicide. The problematic nature of that research and the conflicting results it produced did not, however, prevent Zehr from confidently asserting that ‘no connection between homicide and the process of urbanization is apparent’, or Johnson from arguing that ‘urban-rural differences … had very little impact’ on murder rates.Footnote 11
These two strands of research came together in a book edited by Johnson and Monkkonen which began by asserting that there is ‘no justification for blaming cities and city populations for violence, as more often rural areas were associated with violence than urban ones’. This conclusion was then reinforced by drawing on a third strand of research – on the decline of homicide rates since the middle ages.Footnote 12 The massive and rarely interrupted long-term decline in English recorded homicide rates from a medieval average of 20 per 100,000 to around 1 per 100,000 in the mid-twentieth century led these authors to ask: how could cities be blamed when ‘the predominantly rural societies of the distant past were far more violent than the predominantly urban societies of the recent past?’Footnote 13 This perspective has been further reinforced by Eisner's parallel work on European homicide rates across the same period which indicates that, between the fifteenth and the twentieth centuries, homicide rates fell by a factor of between 10 and 50 in almost every major Continental country.Footnote 14
Eisner has also begun to explore the geography of homicide. Initially he confined his analysis to the timing of the decline. Homicide rates first began to fall substantially, he observed, in England and the Netherlands/Belgium area. The Scandinavian countries and the German-speaking areas then followed, while Italy's rates remained very high well into the nineteenth century. The decline of violence, Eisner argued, therefore began with ‘the pioneers of the modernization process’ before slowly encompassing other regions. In later articles, he confirmed this core finding that the decline ‘started earliest in the North-West of Europe and then … gradually diffused to the more peripheral regions of the Continent’.Footnote 15 He then moved from timing to spatial structure, using a map for the first time to show how homicide rates varied between European states around 1880. This appears to show a clear pattern of ‘low homicide rates across the highly industrialized nations of Northern Europe’ – such as Britain, France, Netherlands, Belgium, Sweden, and Germany – and higher rates in the more rural southern and eastern rim of the Continent. Finally, Eisner suggested that within these separate countries regional differences also followed a similar pattern. In France and Italy, for example, homicide levels were higher in the south than in the prosperous and urbanized north. ‘Homicide was low in the centres of modernization characterized by high urbanization, industrialization’, he concluded, and ‘elevated levels of violence, in turn were found throughout the peripheral areas with … a predominantly rural population’.Footnote 16 Surprisingly, Eisner made no reference to Britain at this point, but before testing his fascinating hypothesis against the English and Welsh evidence, it is important to look critically at the processes that lay behind the creation of these homicide statistics.
II
Historians of crime have long argued that the public anger and fear generated by murder is so great that the prosecution of offenders is extremely likely.Footnote 17 Given that the state also employed paid officials – coroners – to investigate any deaths which were not satisfactorily explained and to make preliminary judgements (with the help of a local jury) about whether such deaths were caused by lethal violence, the proportion of murders that remained unprosecuted would clearly have been smaller than the huge ‘dark figure’ of unrecorded crime for other offences, such as theft or assault.Footnote 18 There were, however, many reasons why a homicide might fail either to be reported or to result in a prosecution, and why recorded homicides cannot, therefore, be read as automatically reflecting real levels of lethal violence.
First, many bodies were never discovered. In 1845, for example, the home secretary quoted a Norfolk case in which a murderer had been able to dispose of the bodies of twenty victims without a single inquest being held. Other murders were not identified as such even when the corpse was found, because the victim had been secretly poisoned. Although this method of killing almost certainly represented only a small proportion of all homicidal acts, it was much more difficult to identify. Thorough post-mortem examinations were rare and, in 1838, the registrar general reported that many cases of poisoning ‘escape undetected by coroners and juries who can be expected to know little of the symptoms either of poisons or of disease’. The most recent historian of poisoning in the Victorian period has therefore argued cogently that ‘a large proportion of deaths from poisoning were never recognised as such’.Footnote 19
Other murders remained undiscovered because the victims' bodies were not found until they had decomposed. Coroners' juries frequently had to return open verdicts on bodies found in canals, rivers and the sea for this reason. Even when bodies could be identified, the circumstances of their deaths were often impossible to reconstruct. In East London between 1819 and 1838, about fifty verdicts per year recorded death by drowning in a ‘manner unknown’ and, in such cases, where a body had simply been found in a river or dock and no witnesses were available, the deaths were routinely recorded as accidental. Some of these drownings, Thomas Forbes has concluded, ‘must have been homicides’ and, even if only one each year was the result of interpersonal violence, the number of murders identified as such in the coroners' records would have been nearly 20 per cent too low.Footnote 20 Drownings played a similar role within coroners' caseloads in other sea- and river-dominated counties, such as Cheshire and, as John Archer's recent article on ‘missing homicides’ indicates, this continued to be a problem throughout the nineteenth century.Footnote 21
Even when the body offered clear evidence that the victim had died in suspicious circumstances, the authorities were not always informed of its existence. The attitudes of the victim's family, neighbours, and local community were crucial, and certain types of homicide were particularly unlikely to be reported. The most widely studied of these is infanticide – an offence which also attracted great sympathy from trial juries – but other types of murder also fell into this category. Stephen Banks has identified more than 400 fatalities in English duels between 1780 and 1845, only 26 of which resulted in criminal trials.Footnote 22 Even if a suspicious death was reported, the officials involved – coroners, magistrates, and the police – had wide discretionary powers and were under pressure to minimize expenses. Coroners sometimes failed to initiate an investigation, or might only perform a minimal one. After analysing over 500 London inquests 1800–2, Mary Beth Emmerichs concluded that many homicides remained unrecognized. Lacking medical expertise, coroners often guessed at the cause of death and, even after 1836, when medical experts could be granted expenses for their court appearances, investigations often remained minimal. ‘If there were no witnesses, no obvious signs of violence and no obvious suspects, if the victims were poor, unknown, unimportant’, the coroner's attitude, she concludes, was ‘why bother with an expensive investigation’, the central working principle being that a death was accidental until proved otherwise.Footnote 23 Recent research on the later nineteenth century has suggested that many suspicious deaths were not subjected to systematic investigation even in this later period – a conclusion shared (in a rare moment of honesty) by the official commentary on the 1899 Judicial statistics, which suggested that ‘Coroner's juries return as deaths by accidents or misadventures many cases which are really homicide.’Footnote 24
This lack of investigation was not necessarily the coroners' fault. Until they were granted fixed salaries by parliament in 1860, coroners' activities were heavily influenced by the local magistrates, who had the power to withhold payment for any inquest they deemed unnecessary. The magistrates' role in undermining the likelihood that a homicide would be identified by the coroner should not be underestimated, especially in the period between the 1836 Births and Deaths Registration Act and the 1860 Coroners Act (which granted fixed salaries to the county coroners for the first time). As the growing burden of county rates became an increasingly contentious issue from the 1830s, some county benches began to look critically at coroners' expenses. When the 1837 Inquest Act both increased the costs payable and transferred them fully on to the county rates only a year after the Registration Act had increased the number of suspicious deaths being referred to coroners, some county benches mounted a sustained attack on coroners' expenses while others did not – an issue that will be revisited later in this article when potential reasons for spatial variations in homicides are explored.Footnote 25 After the introduction of fully paid and professional police forces, magistrates also influenced recorded homicide rates by issuing tight guidelines restricting the kinds of suspicious deaths the police were allowed to refer to coroners, and children were made especially vulnerable by these practices. In 1860, coroners from Middlesex and Hampshire claimed that the bodies of many children who could have been murdered were never subjected to an inquest because ‘the police dispose of them’.Footnote 26
The magistrates themselves also sometimes diverted murder cases involving children away from the major courts. Research on the London Refuge for the Destitute between 1817 and 1822 has uncovered three cases of murder, or attempted murder, that were dealt with summarily – a pattern also found in mid-nineteenth-century Philadelphia. In 1822, for example, Elizabeth Simmons, a young girl left in charge of two children, killed one of the children with a knife, but she was never indicted. ‘The Magistrates of Guildford were of the opinion that she should either be committed under Lord Ellenboro's Act or discharged. The latter was preferred and she is now in the Workhouse.’Footnote 27 Even when a full investigation was undertaken by the coroner, the magistrates or the police, it would not necessarily result in the identification of a suspect, and when a suspect was identified, it was not always possible to gather sufficient evidence for a prosecution. Moreover, suspects against whom the evidence was fairly watertight often ran away before they could be arrested. In Cornwall, about four murderers a decade disappeared at this point. In 1788, for example, two men accused of a murder twelve years earlier were described as ‘having run away and not been heard of since’. Others were arrested, but then died or committed suicide before they could be tried, as the alleged perpetrator of the infamous Ratcliffe murders did in 1811.Footnote 28
Finally, even after the perpetrators had been arrested and tried, some murders remained unrecorded in the official statistics because of the counting strategies adopted by the Home Office. Those who create criminal statistics have to decide whether to count offences or offenders and nineteenth-century statistics are a count of ‘persons committed for trial’. Thus the murder of one person by a perpetrator and three accomplices will be recorded as four homicides, but a murderer who killed several people will be counted as only one – an approach which avoids the problems seen in recent English murder statistics which reached a new peak simply on account of the Harold Shipman murders.Footnote 29 Although the Home Office's rules almost certainly created few significant distortions, they added yet another level and set of actors to the process that created the homicide statistics. County-based variations in homicide rates were not created by murderers alone, but were also influenced by the policies of police, coroners, magistrates, and clerks, as well as by local people's varying perceptions of which deaths justified involving an official. The potential impact of regional variations in the ways these filters worked therefore needs to be evaluated when potential explanations for rural/urban differences in recorded murder rates are discussed later in this article.
III
The main evidence used in this article is derived from the parliamentary returns and relates to prosecutions for homicide, rather than coroners' verdicts, because no systematic data is available on the latter.Footnote 30 From 1810 onwards, the returns included one annual figure on murder and another on manslaughter for England and Wales and data on one sub-area (London). More importantly, after 1834 they offered annual returns about every major category of crime for each county. Before 1810 the evidence is less consistent and much less accessible, being hidden in the assizes records whose survival varies greatly between circuits. This analysis of pre-1810 indictments rates is confined to two groups of counties within which record survival was consistent, and where the relationship between murder rates and levels of urbanization can be explicitly investigated. It is also confined to murder and manslaughter, the two being combined together because, as other historians of homicide have shown,Footnote 31 the borderline between them was unclear and could vary over time. Infanticide indictments, which formed only a small proportion of indictments for lethal violence in this period, have been excluded at this point.Footnote 32
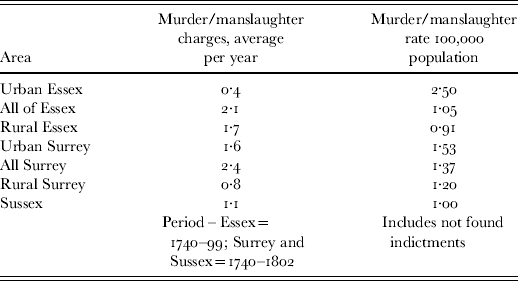
The first group of counties – Essex, Surrey, and Sussex – come from the south-eastern circuit, where the indictments ‘not found’ by the grand jury survived systematically by this period. John Beattie's research on Surrey and Sussex between 1660 and 1800 indicates that, throughout those years, the more urban county, Surrey, had much higher murder indictment rates than Sussex. Recorded murder rates declined massively in the late seventeenth and eighteenth centuries. Between 1660 and 1679, the rate per 100,000 was 6·2 in Surrey and 2·6 in Sussex. Between 1760 and 1779, the figures were 1·4 and 0·5. The spatial differences were becoming less marked. The figures for 1780–1805 were 0·9 in Surrey and 0·6 in Sussex, and for the first time murder rates in rural Surrey (which were considerably lower between 1660 and 1779) were the same as those in urban Surrey.Footnote 33 My research on the Essex and London records, which also include ‘not found’ indictments, has produced a murder rate of 0·8 for Essex 1780–99 and 1·1 for London and Middlesex 1791–1805.Footnote 34 Among these four counties therefore, murder rates rose systematically as a particular area became more involved in metropolitan life. Rural Sussex (which was situated well away from the metropolis) had the lowest levels and Essex, which adjoined the capital but had a smaller neo-metropolitan area than Surrey, was third. Surrey was second, while London and Middlesex had much the highest, its murder indictment rate being nearly double that of Sussex. Equally, within Essex between 1780 and 1799 the hundred nearest to London – Becontree (which included the rapidly growing urban areas of West Ham, East Ham, and Wanstead) had a murder rate more than twice that for the rest of the county. The absolute numbers involved are very small but comparing these two sub-areas over a longer period (1740–99) and combining them with Beattie's Surrey and Sussex findings 1740–1802 confirms that areas nearest to London had considerably higher recorded murder rates (Table 1). The Essex evidence also suggests that it was only large cities that produced this effect. The seven main towns in Essex that were not near the metropolis (all with populations of between 2,500 and 10,000) had a murder rate of 0·92 between 1740 and 1800, which was almost exactly the same as that of rural Essex.Footnote 35
Murder/manslaughter indictment rates per 100,000 population selected counties/sub-areas, south-eastern circuit, 1740–1800
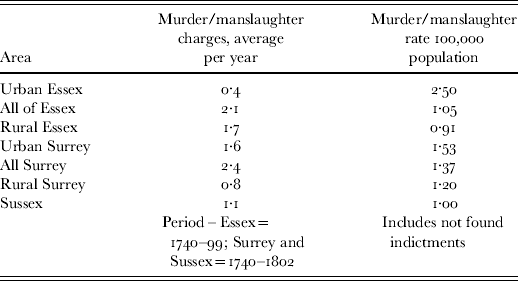
Sources and population: see nn. 32–5.
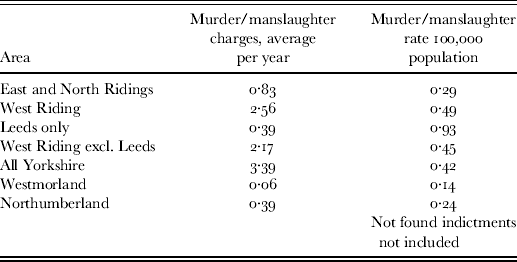
Comparing these murder rates to those of other counties is difficult since the records of most counties do not contain ‘not found’ indictments.Footnote 36 However, by comparing either sub-regions within counties, or counties within the same circuit, these problems can be largely avoided. This therefore forms the basis of the analysis of the Northern Circuit murder/manslaughter rates 1781–99 in Table 2. Although these rates are generally lower because they are based on ‘found’ indictments alone, the pattern is similar to Table 1. The West Riding, which contained the main areas experiencing rapid urbanization, had a much higher murder indictment rate (0·49) than the rest of Yorkshire (0·29). It also had more than double the rates experienced in Westmorland (0·14) and Northumberland (0·24). Moreover, Yorkshire's largest city – Leeds – had a rate more than twice the county average (0·93).Footnote 37 Once again, the absolute numbers are small, but nevertheless a clear pattern emerges and that pattern is also found in Lancashire. Between 1801 and 1805 Lancashire's largest city –Manchester – had a homicide rate more than three times that of rural Lancashire. Liverpool's rate was twice as high, and the rate for the rest of industrial Lancashire was two thirds greater than the rural rate.Footnote 38
Murder/manslaughter indictment rates per 100,000 population on the northern circuit including selected sub-areas of Yorkshire 1781–99
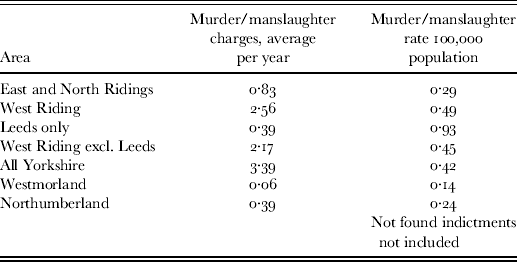
Sources: see n. 37.
Interpreting this pre-1810 data is difficult and the precise timing of the great eighteenth-century decline in murder indictments rates also varied significantly between counties. In Cornwall, for example, attitudes to violence seem to have changed rather later, and the final collapse of homicide rates occurred in the early nineteenth century.Footnote 39 Detailed studies of other counties or periods may eventually uncover other patterns, but in all the areas studied here, sub-regions with rapidly growing urban/industrial profiles, and those near to very large and growing metropolitan areas, had the highest rates. Predominantly rural areas had the lowest. This raises problems for the theories Eisner and others have advanced but the more comprehensive evidence available after 1834 is even more challenging.
IV
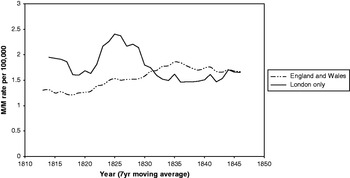
The homicide indictment rates for England and Wales and for London 1810–48 in Figure 1 and the map of those rates for every county 1834–48 (Figure 2) are based on the amalgamation of the separate murder and manslaughter figures published in the parliamentary statistics.Footnote 40 Those statistics also included a separate count of accusations of ‘concealing the birth of an infant’ – the most common charge used against infanticide suspects following the 1803 Act – but concealment has not been included in the ‘murder’ rates analysed here.Footnote 41 Since full accusations of infanticide were treated in the parliamentary returns simply as murders and were not counted separately until 1878, those full accusations are included in the data on which Figures 1 and 2 are based.Footnote 42 In this period, however, they were relatively few in number and represented less than 6 per cent of London's murder indictments. Since more than 95 per cent of infanticide accusations were brought against women, their inclusion did slightly increase the proportion of murderers who were female, but those accused of ‘murder’ or ‘manslaughter’ were still overwhelmingly male. In England and Wales in 1834, nine out of ten were men.Footnote 43
Murder/manslaughter rates, 1810–49, England and Wales or London only.

By 1810, the great eighteenth-century decline in murder/manslaughter indictment rates was definitely over (Figure 1).Footnote 44 After a period of stability at 1·2 or 1·3 per 100,000 in the 1810s, national murder rates rose to a peak of 1·9 in the mid-1830s before stabilizing for a further third of a century and then undergoing fifty years of steep decline to 1914. Historians have largely overlooked this exceptional 1815–35 increase, even though it was of similar proportions to that experienced between the 1960s and the early 1990s.Footnote 45 Detailed discussion of the causes of this early nineteenth-century rise is beyond this article's remit, but a complex group of factors was clearly involved. It may, for example, have been partly connected to short-term factors such as the return of so many young demobilized soldiers after 1815, or to the growing social tensions of these years of radical demonstrations and widespread demands for electoral reform. It also coincided with a particularly rapid stage in the urbanization process in the new industrial areas (the population of both Liverpool and Manchester rose two and half fold between 1811 and 1841). However, it was also a function of changing definitions of, and sensitivities towards, certain forms of homicide. Increasing attention was undoubtedly being paid to the different gradations of violent behaviour during this period and as early as the1820s penalties for manslaughter were increasing. Martin Wiener is therefore almost certainly correct in arguing that ‘more kinds of killing came to be prosecuted as manslaughter’ during this period, which means that the two thirds increase in recorded homicide rates 1815–35 may well have reflected expanding definitions of what constituted a prosecutable homicide, as well as short term economic, social, and political factors and the impact of urban and industrial growth.Footnote 46
More interesting for this study is the relationship between the national and metropolitan patterns (Figure 1). Throughout the 1810s and 1820s, the London rate was about 30 per cent higher than the national rate, and in the mid-1820s it was briefly over 50 per cent greater. Metropolitan rates then declined rapidly while national murder rates gradually rose, which meant that London murder rates were below the national average from the early 1830s until they recovered in the mid-1840s. Thus, the first period for which data is available (1834–48) coincided with a trough in metropolitan recorded murder rates, and a period of relative stability in England and Wales as a whole. However, behind these national murder rates there were very large regional variations (Figure 2).
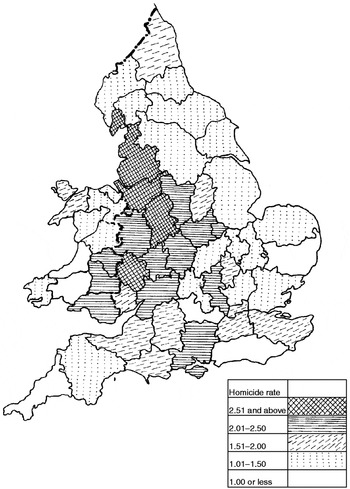
Homicide indictments per 100,000 of population, by county, England and Wales, 1834–48.

The murder/manslaughter indictment rates per 100,000 population in Figure 2 require careful interpretation. They are based on the administrative unit of the county but variations within counties could be substantial, as the late eighteenth-century data has shown. In very large counties like Yorkshire, which included both rapidly growing industrial cities and extensive remote rural areas, rural/urban differences can be difficult to isolate. Very small counties can also pose a problem since, even over a fifteen-year period, a handful of murders, or one murder committed by several accused, could severely distort the overall rate. A few very small counties, such as Rutland, have therefore been amalgamated into a neighbouring one with a similar economic profile.Footnote 47
Despite these difficulties, three clear themes are immediately identifiable. First, there were immense variations between counties. The highest murder rate for an individual county was more than eight times the lowest figure and the three counties with the lowest rates averaged only 0·55 compared to the mean of 3·0 found in the three highest. Secondly, the areas with very low recorded murder rates were predominantly rural, the four main sub-regions being East Anglia, the south-western peninsula, the western counties of Wales and a belt of northern rural counties (Figure 2). Three of the five counties with the lowest murder rates were on the remote western edges in Carmarthenshire, Cardiganshire, and Cornwall, while the other two were rural/agricultural counties in the south and east – Sussex and Suffolk. Cornwall was exceptional because it was a remote county, but contained a large mining industry accompanied by an essentially proto-industrial society.Footnote 48 However, all the other four counties and all the four sub-regions with low recorded murder rates were predominantly rural. In 1851, west Wales and almost every part of East Anglia had more than 50 per cent of its population employed in agriculture, whilst Devon, Sussex, Cumberland, and Westmorland had between 30 and 40 per cent. Lancashire had less than 10 per cent and the swathe of high murder rate counties from Lancashire to Warwickshire had only between 10 and 19 per cent – which is the reverse of what might be expected from Eisner's hypothesis that homicide rates were highest in peripheral areas with predominantly rural populations.Footnote 49
Thirdly, the main belt of high murder rates stretched across the north-west industrial area and the mixed industrial, metal-working, and engineering areas of the midlands. The core of very high rates can be found in a tranche from Lancashire through Cheshire to Staffordshire – all counties that contained rapidly developing industrial and urban centres. The broader area of high rates around this core included other counties with major industrial developments also taking place within them such as Nottinghamshire, Shropshire, and Warwickshire, as well as areas with more mixed industrial/agricultural economies such as Leicestershire and Worcestershire. Glamorgan – the most important industrial and rapidly urbanizing county in Wales – also experienced relatively high rates. Maps of the percentage of each county's population employed in manufacturing in 1851 look very similar to Figure 2, the only major exception being the industrial West Riding for which no separate homicide figures are available. Moreover, these high murder rate counties were also, London apart, the most urbanized areas in England and Wales by the 1840s, and the counties containing the largest numbers of rapidly growing urban centres 1811–61.Footnote 50 A strong, if by no means invariable, relationship between higher levels of industrialization/urbanization and higher homicide rates is therefore clearly in evidence.
Not every county followed this pattern. Four counties had higher than average murder rates, but predominantly rural economies. These were Herefordshire, and the combined unit of Radnorshire and Breconshire, which both had some of the smallest populations of any of the units used,Footnote 51 and two relatively rural English counties – Buckinghamshire and Hampshire. London was exceptional in a different way. Despite its rapid decline in the half decade before 1834, the capital's murder rate remained much higher than those of most remote rural counties but was much lower than those found in the industrial north-west. In 1831 London's population was still eight times larger than any other English or Welsh city but, until the later nineteenth century, its economy underwent none of the fundamental changes experienced elsewhere. London was the ‘shock city’ of the sixteenth and early seventeenth centuries. In the early nineteenth century, Manchester had laid claim to that role and the capital's population was expanding at less than half the speed of Manchester and Liverpool, and at only a quarter of the pace of Cardiff and Merthyr Tydfil.Footnote 52 However London's experience was also exceptional for other reasons. The attack on coroners' fees was at its strongest in London, and it was also the only substantial area where a professional police force was in operation throughout the period 1834–48.
V
Although the fact that most urbanizing and industrializing areas had very much higher murder rates than their rural counterparts suggests that economic and social factors had a systematic impact on recorded homicides, any analysis of the geography of murder must also address the possibility that there were significant spatial variations in the proportion of murders that were eventually prosecuted. Acts of lethal violence that never reached the attention of the authorities did not, by definition, create systematic records and the evidence is therefore thin, but the impact of both institutional/political factors and of local customary practices requires exploration.
By the 1850s magistrates in many counties were curtailing the investigatory roles of the local coroners by confining fee payments to cases ‘palpably open to suspicion’, but this practice was only beginning in the 1840s and attitudes varied widely.Footnote 53 As late as 1843–9, 45 per cent of county benches never refused payment, while another 35 per cent very rarely did so. Occasional refusals might, of course, influence the coroners' behaviour, since they were naturally reluctant to undertake inquests for which they might not get paid. However, in the four provincial counties (Norfolk, Devon, Carmarthenshire, and Staffordshire) where magistrates definitely made significant pre-1848 cutbacks, no reductions in murder rates seem to have resulted.Footnote 54 The complex factors which influenced a coroner's impact on homicide prosecution levels are difficult to untangle. In 1839, for example, the Middlesex magistrates instigated a period of close scrutiny over coroners' expenses, but since 1839 also witnessed the election of a new highly active coroner, Thomas Wakley, who immediately demanded that he be informed of all sudden deaths, the effects of this crackdown are difficult to measureFootnote 55 and homicide rates actually changed very little. Further research is needed, but variations in coroner payment policies rarely seem to have had a significant impact on the geography of recorded homicide.Footnote 56
The impact of the new police is also difficult to assess but in London it may have been considerable. Some historians have assumed that the introduction of the new police increased the proportion of homicides investigated because they would be better at identifying deaths from unnatural causes,Footnote 57 but this was not necessarily the case. The establishment of a reformed police force enabled the magistrates to curtail the number of suspicious deaths referred to coroners, and the police themselves also had good reasons to keep recorded homicide numbers down. After 1880 – when the costs were transferred to the Treasury – central financial controls may have forced them to do so,Footnote 58 but, as Archer's analysis of mid-nineteenth-century police practices in the north-west has indicated, they were quietly ‘cuffing’ (i.e. hiding) a considerable number of homicides well before 1880. Only two-thirds of the murders indentified in the Liverpool coroner's report in 1863 were also listed as ‘known to the police’. The head constable was omitting murders from the annual returns if he thought the police would have difficulty in securing a conviction, and he clearly believed he had the right to do so. Nor was this practice confined to Liverpool. Nationwide in 1862 (and 1857–9), the number of homicide trials was greater than the number recorded as ‘known to the police’, even though many murders officially acknowledged by the police never came to court.Footnote 59
Did the establishment of the Metropolitan Police lead to similar practices? In the seven years before 1829, London's murder rate averaged 2·4 per 100,000. Between 1830 and 1836, it was more than a third lower at 1·5. In the same period, the murder rate for England and Wales, where no major policing reforms took place,Footnote 60 rose from 1·5 to 1·8. The precise reasons for this change are unclear, but J. D. J. Harvard has suggested that coroner/police relations in London grew increasingly fraught after 1829 and that, by 1860, ‘the justice's interference with the notification of coroners by the police had been so effective that only one per cent of coroners’ cases in Middlesex were received from the police'.Footnote 61 The continued existence of various parallel policing bodies in Middlesex 1829–39, and of separate policing arrangements in the City, adds further complexities, as does the changing nature of detective policing in the capital. However, London's police clearly could not have had a deterrent effect of this magnitude, indeed it is unlikely that most murderers' behaviour in this period was significantly affected by policing practices.Footnote 62 A combination of magistrates' attitudes and new policing procedures in relation to the investigation of suspicious deaths may therefore have been key factors behind the post-1829 decline in London murder rates.
The introduction of the new police may also have had the same dampening effect in Lancashire, which contained the nation's second and third largest cities in 1841. The introduction of professional policing was not made compulsory until 1856, but the most important turning point in Lancashire came in 1839–41.Footnote 63 Lancashire was among the first counties to adopt the permissive 1839 Act, and since this period also coincided with major municipal police reforms in Manchester and elsewhere, the impact of police reform on the county's murder rates is extremely interesting.Footnote 64 Murder indictment rates fell by nearly a third in Lancashire following this change, but a similar decline did not occur elsewhere. In the 16 other English and Welsh counties that introduced professional police forces in all divisions 1839–41 their arrival made virtually no impact. If the period 1834–9 is compared with 1842–8, murder rates only fell on average by 0·1 per 100,000,Footnote 65 which is precisely the same decline as that found in those areas that did not adopt the new police 1839–41. In Lancashire, however, it fell from 3·0 to 2·1, in precisely the area where Archer's work has shown that the police were deliberately under-recording the incidence of murder. Thus in the two counties containing the nation's largest urban areas (Middlesex and Lancashire) the introduction of the new police was immediately followed by major declines in recorded murder rates, but elsewhere in England and Wales the introduction of the new police seems, on aggregate, to have had almost no effect.
The fact that recorded murder rates fell by over a third both in London during a period of widespread reform agitation in the capital (1829–34) and in Lancashire during the Chartists' most active years highlights the fact that there was very little correlation between higher murder rates and major movements of social unrest. The Rebecca riots in rural Wales (1839–44), for example, mainly occurred in Cardiganshire, Carmarthenshire and Pembrokeshire – all of which had very low homicide rates in this period – and those rates were also very low in Suffolk which was a centre of violent covert protests such as arson and animal maiming.Footnote 66 This is not necessarily surprising. Unlike some rural movements in nineteenth-century Ireland, none of these protest movements used murder as a weapon of intimidation. Nor were their demonstrations usually sufficiently violent to result in the death of those who policed them.Footnote 67 The military did occasionally kill some of those involved in the unrest, but the authorities usually ensured that a verdict of justifiable homicide was brought by the coroner, thus preventing these killings from appearing in the official statistics. In 1839, for example, no homicide trials are recorded for Monmouthshire in the parliamentary statistics, but twenty-two Chartists were killed by soldiers who fired indiscriminately on them during the Newport Rising.Footnote 68
Apart from these rare moments, the precise impact of the actions of the authorities on the geography of homicide remains difficult to gauge and analysing non-institutional factors is even more challenging. However, attitudes towards the formal prosecution of certain types of lethal violence may also have had their own geography. Without railways linking them to national communication systemsFootnote 69 many rural communities in West Wales, Cornwall, Westmorland and elsewhere remained deeply embedded in their own local customary cultures in the 1830s and 1840s and their inhabitants made remarkably little use of the courts. Indictment rates for all types of crime in Westmorland were less than a tenth of their London equivalent in 1805–7, whilst no cases at all were recorded in Merioneth or Cardiganshire in some years. In rural Wales, traditions of direct retribution, of compensation rather than prosecution and/or of informal community punishment, such as banishment, harassment, and ostracism, remained very strong. ‘A species of clanship … renders the Welshman particularly averse to give evidence against a neighbour’, one chief constable observed in 1842Footnote 70 and this mistrust was reinforced by the fact that court business was conducted in English – a language many Welshmen could not understand.
Several commentators in the 1830s and 1840s certainly believed that some adult homicides were still being concealed from the authorities and dealt with informally, and when the victim was a child this may well have been the norm. In Cardiganshire, R. W. Ireland has argued, infant death rarely crossed ‘from the communal world of shame into the legal world of guilt’. The 1839 police commissioners quoted both a Llanllwchairn case in which several witnesses had lied to prevent the indictment of a man who had accidentally killed someone in a fight, and another case in which the community deliberately delayed reporting a poisoning, enabling the two perpetrators to escape. It may not be just coincidence that the area of very low Welsh homicide rates (Figure 2) aligns so well with the predominantly Welsh-speaking area where traditions about avoiding formal court hearings were particularly strong.Footnote 71 The low homicide rates found in West Wales may, alternatively, mainly reflect real differences in the incidence of homicide. Wales had a reputation for being relatively safe from serious violence. Many contemporaries believed that ‘Murders are rare in Wales’ and several Welsh historians have argued convincingly that ‘there were great tracts of Mid Wales where murder and manslaughter were almost unknown’.Footnote 72 However, the very low murder indictment rates found in some remote rural areas of England and Wales may also, in part at least, have been a reflection of the deep localism and dislike of outside interference that characterized many rural communities in the mid-nineteenth century.Footnote 73 When a body was discovered in suspicious circumstances those communities may sometimes have made key decisions that prevented a murder from being reported or prosecuted, and if such traditions were less widespread in urban contexts, these informal community practices could have resulted in a smaller proportion of rural murders being reported. However, the relative anonymity of many urban areas, and the ease with which bodies could be disposed of in large urban rivers and canals – where the cause of death would quickly become impossible to ascertain – meant that in other circumstances certain types of urban homicide may have been relatively poorly reported compared to their rural equivalents. Moreover, as we have seen, the introduction of the new police in at least two urban areas also seems to have reduced the proportion of homicides reaching the official statistics. Overall, therefore, it is equally possible that a lower proportion of urban as opposed to rural murders resulted in prosecutions.
If the differences between urban and rural murder rates had proved to be small this uncertainty would have made it difficult to assess the possible impact of urbanization and industrialization on homicide. However, the fact that homicide rates were many times higher in most rapidly growing urban areas than in remote rural ones suggests very strongly that these were important influences. The fact that Lancashire's recorded homicide rate was six and a half times greater than that of Cardiganshire – despite the fact that the introduction of professional police forces in Lancashire produced (or at least coincided with) a considerable fall in such rates – cannot be dismissed as merely the result of differences in the proportion of homicides that were reported. Nor can the fact that the Staffordshire rate was seven and a half times higher than that in Cardiganshire. While the official murder statistics undoubtedly underestimate the absolute number of homicides that occurred in this period there is no evidence that spatial variations in the proportion of murders that were eventually prosecuted had sufficient systematic impact to explain the massive urban/rural differences seen in Figure 2, and this becomes even clearer when we analyse some of the key economic, social, and demographic factors that could have influenced actual levels of homicide in different contexts and places.
VI
This is not an easy task. Observing a statistical/spatial relationship between two variables does not necessarily imply that this was a causal relationship. Moreover, while modern criminologists have identified many structural factors that can influence homicide rates such as poverty, inequality of opportunity, social disorganization, population turnover, demographic structures, connections between masculine identity and violent behaviour, and the development of specific cultures of violence,Footnote 74 making concrete links between these factors and the higher homicide rates found in particular regions is extremely difficult. Nor are the writings of nineteenth-century commentators especially helpful, being largely confined to general observations about the extent to which the crowded, insanitary, and poverty-stricken conditions experienced by the labouring poor in rapidly growing cities such as Manchester undermined their morals and encouraged all manner of vices. Although violence, and the need to control it, were major themes within contemporary discourse, little attention was paid to homicide rates in the early nineteenth century. Murders constituted only a tiny element of recorded crime, and homicide rates were largely static by the late 1830s, which was the key point at which a group of statisticians began to investigate crime rates in different areas. The broader category of ‘crimes of violence’ was sometimes discussed, but the huge variety of violent acts included in this group was rightly perceived as unhelpful, and few attempts were made to divide it into more focused sub-categories. As a result, most writers virtually ignored murder until well after 1850.Footnote 75 Given the widely varying contexts in which murders occur and the complex economic, social, and cultural forces that can increase or decrease the number of occasions when those contexts develop (and the ways individuals then react to them), detailed research is needed before full explanations of these spatial variations can be constructed. Some important, if partial, explanations of the geography of murder in this period can, however, be explored by looking at two related characteristics of the offenders themselves – their ages and their migration histories.
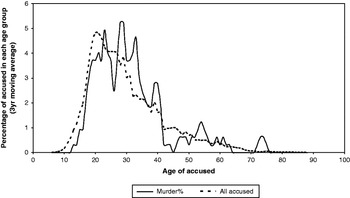
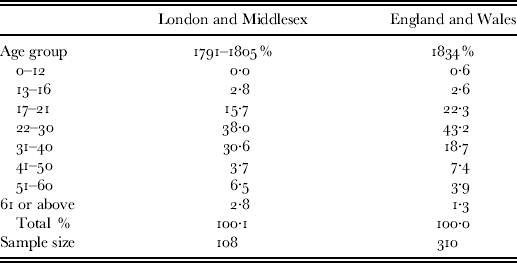
Those prosecuted for homicide have a slightly different age profile than those accused of property crimes. As the Old Bailey data in Figure 3 indicates those accused of murder or manslaughter in London 1791–1804 tended to be older than those accused of property crimes – the peak being 19 to 35. In 1834, when the national crime statistics also give some age data for the first time, the pattern is fairly similar (see Table 3). The large contribution made by those in their twenties and thirties comes out particularly clearly in this data. About 69 per cent of those accused of murder in London 1791–1804 (Table 3) and 62 per cent of murderers nationwide in 1834 were between 22 and 40, and the majority were in their twenties or early thirties.Footnote 76
Ages of accused, murder and all crimes, Old Bailey, 1791–1804.

Murder/manslaughter accused: age structure, London, 1791–1805, and England and Wales, 1834
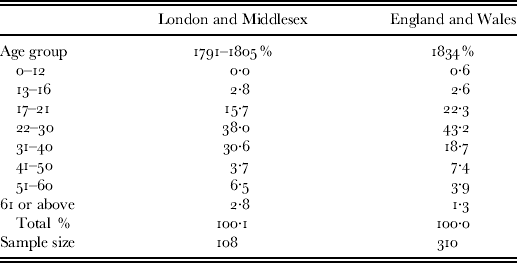
Sources: see n. 76.
Did the higher homicide rates found in industrial/urban areas partly reflect the different age structures of their populations? The 1851 census suggests that this was an important contributory factor. Maps of the proportion of each county's population aged 15–44 (the age range of 90 per cent of the murder accused) show a pattern very similar to that in Figure 2.Footnote 77 The swathe of high murder rate industrial counties from Lancashire down to Warwickshire have the highest proportions, along with Glamorgan.Footnote 78 West Wales and Cornwall are in the lowest category and East Anglia also has very low percentages. In England and Wales, 24·3 per cent of the male population were aged 20 to 34 in 1841. In Cornwall (21·3), Cardiganshire (21·2) and Carmarthenshire (21·3) these figures were much lower whilst in Lancashire (26·5), the figures were considerably higher than the national average, and in both Cheshire (24·7) and Staffordshire (25·3) they were above it. This cannot, in itself, explain why recorded murder rates in these three industrializing and urbanizing counties were about four and a half times higher on average than those of the three peripheral ones. It does, however, suggest that the patterns in Figure 2 were partly a reflection of actual differences in lethally violent behaviour on the ground. 90 per cent of murderers were male. 90 per cent were young adults. In urban contexts, then as now, male on male violence between non-relatives in public contexts played a central role in the background to homicide. At the Old Bailey 1780–94, for example, around 70 per cent of all murders were male on male events and 40 per cent arose from fights in pubs or public spaces. These urban/industrial areas not only contained many more young adult males, they also forced them to live in crowded lodging houses and in much closer proximity to each other.Footnote 79 It is not therefore especially surprising that murder rates tended to be higher in such areas, especially since high murder rate areas such as Lancashire, the west midlands and Glamorgan, were all areas of high net in-migration.
Although internal migration was mainly short-distance in character in this period and long-distance rural-to-urban movements were a relatively small component of total migration, urban centres in industrial areas attracted very considerable numbers of migrants – especially young and single ones. As late as 1851, 55 per cent of Manchester's population and 58 per cent of Liverpool's had been born in a different county and intermittent pulses of in-migration continued to play a vital role in urban population growth.Footnote 80 The mushrooming urban areas of Glamorgan, for example, attracted large numbers of young adult migrants from the depressed agricultural counties further west. The county's largest town, Merthyr, even had separate streets dominated by migrants from Cardiganshire, Carmarthenshire, and Pembroke, and its incredibly rapid growth from 7,700 inhabitants in 1801 to 43,300 in 1851 created a predominantly young migrant-dominated population living in a ‘frontier town’ environment. It is not surprising therefore that it gained a reputation for violence, and that its murder/manslaughter cases were dominated by young men beaten unconscious in pub-related fights. The town also contained a significant Irish population which was held responsible for half of its assault prosecutions, despite constituting only a tenth of the population.Footnote 81 Given that many of the more adventurous young adults born in Cardiganshire and Carmarthenshire had migrated, and that few young migrants, Irish or otherwise, were coming into those counties, it not that surprising that their murder rate was several times lower than Glamorgan's.
Maps of the percentage of each county's 1851 population that were migrantsFootnote 82 are fairly similar to those charting their percentages of young adults, and therefore follow much the same pattern as the murder rates found in Figure 2, the percentages born outside each county being highest in industrial areas such as south Lancashire and lowest in rural ones. Lacking detailed studies, it is difficult to establish precisely which migrant sub-groups had the most influence on homicide rates. However, the group that created the largest migration flows from the economic periphery to the new industrial areas, the Irish, have been studied, and they clearly made a disproportionate impact. Between 1834 and 1848 – a time of crisis and eventually of full-blown famine in Ireland when Irish migration into Britain's cities reached new heights – they were massively over-represented amongst those accused of violent offences.Footnote 83 Moreover this over-representation predated the coming of the new police – whose prejudicial attitudes have been blamed by some historians for this phenomenon. Between 1791 and 1805, at least 14 per cent of murder accusations at the Old Bailey (and possibly as many as 20 per cent overall) involved Irish-born offenders, although they represented only between 2 and 3 per cent of the London population.Footnote 84 Contemporaries certainly made a link between the Irish and lethal violence. ‘Inquests are common in this locality. Many persons die by violence’, Thomas Beames wrote of one of London's Irish rookeries in 1850. Thirty years earlier, a London-based magistrate complained ‘The Irish poor are worse than the English …We hardly ever hear of a riot, or a murder … in which some of these poor creatures are not implicated.’ The absolute numbers involved in the 1791–1805 sample are relatively small, but Carolyn Conley's research has also revealed that the Irish constituted about 23 per cent of homicide defendants in Glasgow, 1867–1892Footnote 85 and they were equally over-represented elsewhere. In 1836, the Liverpool superintendent of Police observed that ‘there are perhaps from 4 to 6 cases of manslaughter among the Irish in a year’, before adding that ‘deliberate murders are very rare among them’. Given that the four urban areas in which the Irish constituted more than 10 per cent of the 1851 population – Liverpool, Manchester, Merthyr, and Stockport – were all situated in counties with high murder rates (Figure 2), the potential impact of the Irish in some rapidly urbanizing areas was clearly important.Footnote 86
The causes of this Irish over-representation remain the subject of much debate. Prejudice, policing practices, and poverty all probably played a part, but many Irish migrants also brought with them what John Carter Wood has described as a more ‘customary’ attitude to violence – which legitimated direct physical confrontation rather than stressing self-restraint.Footnote 87 The Irish faction fight, a ritualized brawl involving large numbers and any weapons that were to hand, was a regular feature of many Irish migrant communities in England, just as it was in rural Ireland,Footnote 88 but its transmission to England placed it within crowded urban contexts in which communal solidarities were weaker and less likely to prevent prosecution.Footnote 89 London magistrates were well aware that ‘dreadful affrays were they half murder each other’ were a feature of the Irish community, and reported regular weekend fights involving three or four hundred drunken Irishmen with shelelas. Clashes with the English might prove equally lethal and the Irish were especially prone to attacking the police. In 1799, ten Irish men and women were indicted for murdering a Bow Street patrol man who had tried to arrest them and this one case doubled the London murder rate that year.Footnote 90 Although the Irish formed an important sub-group among early and mid-nineteenth-century migrants, they were, however, untypical because they travelled much longer distances, and brought a more distinctive cultural and linguistic inheritance with them. Since two-thirds of the 117 men and women accused of murder in London 1791–1805 were born outside the capital, other migrant groups may also have had a significant effect on recorded murder rates in large urban areas. However, in the absence of detailed studies of the impact of different types of migrants on patterns of lethal violence, it is too early to draw conclusions, and given the emphasis Welsh historians have put on the lack of violence in rural Wales in this period, it cannot be assumed that all rural migrants were as prone to violence as the Irish were thought to be.Footnote 91
VII
The two factors we have focused on here do not, of course, wholly explain the much higher recorded homicide rates found in rapidly expanding urban areas. The impact of regional differences in the proportions of homicides that were actually prosecuted clearly requires further research, for example, and a full analysis will only be possible when we have detailed studies of the contribution that various types of lethal violence – stranger violence, domestic violence, robbery-related violence – made to recorded homicides in different places and times.Footnote 92 Overall, however, there seems to have been a clear correlation between certain types of urban development and higher rates of lethal violence. Not all urban areas created this effect. Small towns not in areas undergoing rapid industrialization showed little tendency towards higher murder rates. Moreover, the very highest rates were usually found not just in big cities, but also in urban areas that were experiencing especially rapid growth and therefore attracting large numbers of migrants both from the countryside and from other towns.
Research on other places undergoing rapid industrialization and on later periods may reveal different patterns. However, during the first half of the nineteenth century, Scottish homicides seem to have exhibited a very similar geography to that seen in England and Wales. Preliminary research on Scotland suggests homicide rates were lowest in the Highlands and outer islands, and highest in the central belt, which included the most rapidly industrializing areas and the key urban centres, such as Glasgow and Edinburgh.Footnote 93 It could be argued that this British data accords well with Louise Shelley's 1981 hypothesis that violent crime rates were highest in cities during the early transitional stages of industrialization and that ‘the mature years’ that followed were characterized by a decline in homicide.Footnote 94 However, such views cannot be tested until detailed research has been done both on the post-1850 geography of British homicide, and on the many regions of Europe that underwent rapid industrial and urban transitions in that period. Since most European countries had started to collect detailed data on murder and manslaughter by the 1880s, and were widening the net to include both police statistics and mortality records (based on coroners' verdicts or their equivalent), this will eventually be possible.Footnote 95 Moreover, if the maps of European homicide rates produced by Enrico Ferri in 1895 (covering the brief period 1880–4) are any guide, this work will help us to understand some of the factors that were unimportant in England and Wales, but could be crucial elsewhere. The towering homicide rates Ferri found in areas like Corsica and Sicily remind us, for example, that feuding and blood revenge traditions, and the survival of banditry which is often associated with them, can massively affect recorded murder rates.Footnote 96
A full understanding of urbanization's impact on homicide rates awaits the completion of detailed research on the European statistics across longer periods. However, there can be no doubt that, between 1780 and 1850, in many different regions of England and Wales the broader links Eisner and others have made between urbanization/industrialization and lower levels of recorded homicide simply cannot be identified. Indeed, in many parts of England and Wales, the pattern is best explained by reversing that relationship. The main areas experiencing an industrial transformation, and the rapid urbanization that accompanied it, had recorded homicide rates that were often several times higher than those of the more peripheral rural areas, differences that were partly caused by the large-scale migration of young adults into the cities.
By looking at variations across space as well as time, the research presented here has revealed a fundamental paradox at the heart of the history of recorded murder rates. While the broader processes of modernity in Western Europe, within which urbanization played such an important part, were undoubtedly accompanied by a large long-term decline in recorded homicide rates, in Britain, at least, a cross-sectional look at particular key transitional points in that process reveals that much higher homicides rates were still found in almost every region undergoing rapid urban and industrial growth.