Introduction
The island of South Georgia lies to the south of the Polar Front in the South Atlantic Ocean. The island is narrow, c. 190 km long but never more than 35 km wide, characterized by steep mountainous terrain rising to 2934 m. Offshore a wide continental shelf extends 30–100 km from the coast. The island constitutes part of the Scotia Ridge, a mainly submarine arc that divides the Scotia Sea Plate from the American Plate. This ridge continues to the north-west of South Georgia to another block of continental shelf around the small islands of Shag and Black rocks some 240 km away. Beyond the continental shelf the continental slope drops to the abyssal plain, which has a maximum depth in this region of 4750 m. The island lies in the eastward flowing Antarctic Circumpolar Current (ACC), with the southern edge of the continental shelf bounding the Southern Antarctic Circumpolar Current Front. The main flow of the ACC is deflected sharply northwards by the continental shelf west of Shag Rocks, although some of the flow is directed through the channel between Shag Rocks and South Georgia.
A requirement for high-resolution bathymetric data in the area has been identified across a range of scientific disciplines. These include the development of high resolution oceanographic models for the South Georgia region, assessing the extent of Quaternary ice (Graham et al. Reference Graham, Fretwell, Larter, Hodgson, Wilson, Tate and Morris2008), and investigations of the structural geology of the island. Detailed bathymetric information of South Georgia is also required to assist with the identification of seabed habitats that are threatened by fishing, and for marine habitat identification and fisheries management. Previous estimates of seabed depths have been conducted from nautical charts (Everson & Campbell Reference Everson and Campbell1991), which for many areas of the South Georgia maritime region are known to be unreliable as they rely on limited soundings data.
Although bathymetric data have been collected in the area for many years, no high-resolution grid of the whole area has previously been compiled.
Previous gridded datasets of the area have been at resolutions too low to be useful in an area as small as South Georgia. The General Bathymetric Chart of the Oceans (IOC et al. 2003) has, until now, been the best publicly available dataset of the whole region. GEBCO is a global dataset, so is necessarily generalized; it is sampled at one minute of arc (1.35 km by 2.2 km at this latitude). It shows little of the detail of the new 150 m resolution grid.
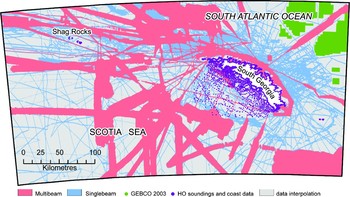
The new South Georgia Bathymetric Dataset (SGBD) introduced in this paper is a high-resolution gridded raster sampled at 150 m resolution. Its geographical extent stretches between 34–44°W and 53–56°S. Figure 1 shows areas of interest within the grid. The grid includes the area contained within the Commission for the Conservation of Antarctic Marine Living Resources sub-area 48.3.
Datasets used and respective coverage and places named in the text.

Methodology
The data
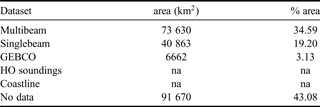
Several bathymetric data sources were used to compile the new grid. Figure 1 identifies the coverage of relevant data sources and Table I shows the relative amounts of data used. We used a nested hierarchy for the data with more accurate datasets given priority over poorer quality data.
Comparative coverage of the datasets used
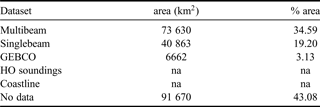
na = not available
Multibeam
Multibeam swath bathymetry data have been collected by RRS James Clark Ross (JCR) since 2000 when a Kongsberg EM120 system was fitted to the vessel. The EM120 is primarily a deep-water echo sounder operating at 12 KHz and returns 191 beams per ping. Multibeam acquisition occurs on both scientific cruises and opportunistically during passage legs. There are 16 JCR cruise legs that have contributed to the South Georgia bathymetric compilation and these have been post-processed in a variety of ways. Earlier data have been processed using Kongsberg's Neptune software while more recent cruises have been processed using MB-System (Caress & Chayes 2006, http://www.ldeo.columbia.edu/res/pi/MB-System). Hour files processed by Neptune typically have a min/max filter applied, determined by the local conditions to get rid of outliers. An average surface is then calculated using Neptune's BinStat program and points more than 3 standard deviations away from this surface are removed. The remaining edits are done manually using a graphical interface. Hour files processed by MB-System also have a min/max filter applied but the remainder of the edits are manual. The ratio between manual and automated cleaning is approximately 70/30 for Neptune processing and 90/10 for MB-System processing.
In addition to the JCR data there is a limited amount of multibeam data collected by HMS Endurance. A shallow-water (<1000 m) Kongsberg EM710 echo sounder was fitted to the vessel in 2005. Cleaned xyz data from a circumnavigation around the South Georgia shelf has been provided by the UK Hydrographic Office (UKHO) and incorporated into the grid. The UKHO data comply with the International Hydrographic Office S44 standard for hydrographic surveys (Wells & Monahan Reference Wells and Monahan2002).
Singlebeam
The bathymetric chart includes singlebeam data collected by the JCR, the HMS Endurance, and several fishery vessels including the Fishery Patrol Vessel Dorada. JCR data are acquired by a Kongsberg EA600 echo sounder and have been post-processed using Geosoft Oasis Montaj software. Within Geosoft, the singlebeam data are edited manually. Data from other vessels have been provided as post-processed xyz files.
Hydrographic charts and other datasets
Tertiary data came from soundings and coastlines digitized from Hydrographic Charts (HO charts nos 3596 and 3597) along with a detailed coastline from the BAS (Misc) 12a 1:200 000 map of South Georgia (2004). These were used where no multibeam or single beam swath was available.
Finally, in some areas GEBCO data have been used to supplement the dataset. These data have only been used in the north-east of the region where the single beam coverage is poor and the GEBCO data matches well with the other inputs.
Analysis
The various datasets were brought into a GIS and re-projected into Lambert Conformal Conic (LCC) projection to give a more realistic representation of the shape of features. All swath data were then re-sampled to 150 m (approximately 1/8 of a degree) and converted to points to ensure equal weighting of datasets. The TOPOGRID function based on ANUDEM (Hutchinson Reference Hutchinson1988) in ESRI's ArcGIS was used to convert the final input data to one continuous grid with a cell size of 150 m. The resulting grid contained a number of data spikes, pits and areas of anomalous results. To remove these two processes were employed. The first was an automated analysis based on slope analysis (Burrough Reference Burrough1986): the greatest angle of the continental shelf slope was calculated from reliable multibeam swath on the shelf slope. Any angle of slope greater than this was classed as unreliable and automatically removed from the underlying dataset. This method proved a useful tool in identifying anomalous data and to help in smoothing between datasets. The second method was an iterative process to manually identify and remove disparate measurements, deep holes and edge effects resulting from the outer beams of multibeam swath. This second process is similar to that used in the recently compiled Amundsen Sea grid (Nitsche et al. Reference Nitsche, Jacobs, Larter and Gohl2007).
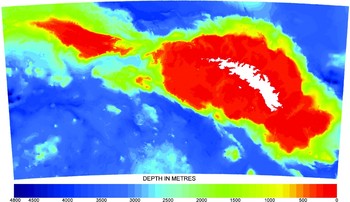
The resulting grid (Fig. 2) is available as an ArcGIS shapefile in LCC projection, or as an xyz ASCI file with lat/long co-ordinates Both grids are available to download from http://www.antarctica.ac.uk/bas_research/data/online_resources/sgbd/
The South Georgia bathymetric dataset.

Conclusion
The new SGDB shows a variety of new and interesting features including detail of drowned glacial valleys and trenches on the shelf north of the island. These give evidence of a large palaeo-ice cap (Graham et al. Reference Graham, Fretwell, Larter, Hodgson, Wilson, Tate and Morris2008). Its volume may have been more than 40–60 000 km3, equivalent to ~12–19 cm of global sea level. Other shelf-edge features such as possible slump scars to the north-west can be observed as well as geological faulting and sea mounts to the south-west of the area. It has also enabled a much more detailed assessment to be made of sea-bed areas (Belchier & Fretwell Reference Belchier and Fretwell2008) in order to refine the management of commercially important demersal fish species at South Georgia.
Acknowledgements
We thank Pete Morris for compiling the collection of single beam data; Phil Leat for overseeing the BAS multibeam acquisition; the officers and crew of the RRS James Clarke Ross, HMS Endurance and Falkland Islands Fisheries vessels who collected the swath data.