Introduction
Maize plays a crucial role in global food security, serving as a staple crop for both human consumption and livestock feed (Erenstein et al., Reference Erenstein, Jaleta, Sonder, Mottaleb and Prasanna2022; Kennett et al., Reference Kennett, Prufer, Culleton, George, Robinson, Trask, Buckley, Moes, Kate, Harper, O’Donnell, Ray, Hill, Alsgaard, Merriman, Meredith, Edgar, Awe and Gutierrez2020). However, maize cultivation faces significant challenges due to pest infestation, primarily from lepidopteran pests (Foba et al., Reference Foba, Shi, An, Liu, Hu, Mams, Liu, Zhao and Wang2023; Li et al., Reference Li, Shi, Huang, Guo, He and Wang2023; Zhao et al., Reference Zhao, Hoffmann, Jiang, Xiao, Tan, Zhou and Bai2022). Among these pests, Ostrinia furnacalis (Guenée) (Lepidoptera: Crambidae) poses a serious threat, as it heavily relies on maize as its primary food source, leading to adverse effects on crop yields (Fang et al., Reference Fang, Zhang, Chen, Cao, Wang, Qi, Wu, Qian, Zhu, Huang and Zhan2021; He et al., Reference He, Wang, Zhou, Wen, Song and Yao2003; Li et al., Reference Li, Liu, Fu, Liu, Zhang, Wang and Rao2021).
For effective pest management, understanding the insect life cycle (fig. 1) and its feeding preference is crucial. Insects at different developmental stages demonstrate distinct food preferences and consumption patterns (Nawaz et al., Reference Nawaz, Ali, Sufyan, Gogi, Arif, Ali, Qasim, Islam, Ali, Bodla, Zaynab, Khan and Ghramh2020; Revadi et al., Reference Revadi, Giannuzzi, Rossi, Hunger, Conchou, Rondoni, Conti, Anderson, Walker, Jacquin-Joly, Koutroumpa and Becher2021). For instance, early instar larvae of O. furnacalis feed on leaves, while third instar larvae feed on tassels, and late (fourth and fifth) instar larvae feed on stems and spikes. Consequently, plant damage sites and intensity also vary starting from leaf damage to stem boring, compromising both the yield and quality of maize (Xu et al., Reference Xu, Ding, Zhao, Luo, Mu and Zhang2016).
Life cycle of Ostrinia furnacalis, showing the stages of egg, larva, pupa, and adult. Source: Collected and illustrated by the authors.

In addition to plant damage associated with the insect developmental stage, pest management strategies also vary according to the developmental stages of the insect. For instance, first and second instar larvae of Helicoverpa armigera show high mortality to insecticides belonging to nucleopolyhedrovirus and Bacillus thuringiensis compared to third instar larvae, demonstrating the importance of targeting specific developmental stages in pest control (Vivan et al., Reference Vivan, Torres and Fernandes2016). Similarly, third instar larvae of Listronotus maculicollis are more susceptible to the insecticides tebufenozide and methoxyfenozide than the fifth instar, emphasising the need for stage-specific interventions (Koppenhöfer et al., Reference Koppenhöfer, McGraw, Kostromytska and Wu2019). In the context of O. furnacalis, accurate identification of larval instars is equally crucial, as it can inform the selection of appropriate control measures, optimising their effectiveness and reducing unnecessary pesticide use.
Furthermore, larval weight contributes to a more detailed understanding of insect growth status at different developmental stages, which helps in the assessment of their potential threat to crops. An instar with increased weight demonstrates higher fitness compared to low-weight instars, with higher mass indicating greater feeding capacity and potential damage to plants. Additionally, larval weight plays a crucial role in the successful transition of larvae into the pupal stage (Fletcher, Reference Fletcher2009), and pupal weight has been found to correlate with adult lifespan and fertility (Barah and Ak, Reference Barah and Ak1991; Greenberg et al., Reference Greenberg, Sappington, Legaspi, Liu and Sétamou2001), influencing pest population dynamics. Consequently, accurate and timely identification of instar and prediction of weight are essential for implementing effective pest management strategies. These strategies can be tailored to mitigate damage to crops and living environments (Johari et al., Reference Johari, Khairunniza-Bejo, Shariff, Husin, Masri and Kamarudin2023; Xu et al., Reference Xu, Feng, Tang, Liu, Ding, Lyu, Yao and Yang2022; Ye et al., Reference Ye, Lu, Bai and Gu2020).
Conventional methods for identifying instar and predicting the mass of pests are not only time-consuming but also labour-intensive (Wu et al., Reference Wu, Appel and Hu2013). These traditional approaches often involve manual examination and measurement, which can be inefficient and prone to errors. This challenge has driven the need for more advanced and efficient methods to improve pest management strategies. With recent progress in machine learning (ML), there has been a growing interest in the utilisation of ML in pest management approaches, such as insect detection (Li et al., Reference Li, Zhou, Wang and Jia2020; Majewski et al., Reference Majewski, Zapotoczny, Lampa, Burduk and Reiner2022), identification (Kirkeby et al., Reference Kirkeby, Rydhmer, Cook, Strand, Torrance, Swain, Prangsma, Johnen, Jensen, Brydegaard and Græsbøll2021), and prediction (Ibrahim et al., Reference Ibrahim, Salifu, Mwalili, Dubois, Collins and Tonnang2022). Additionally, several ML classification algorithms have already been applied for various insect pests for instar identification. For instance, the support vector model has been effective in predicting mangrove crab larvae growth stages with 85% accuracy (Almarinez and Hernandez, Reference Almarinez and Hernandez2019), the random forest model has achieved 85.59% accuracy in identifying for Spodoptera frugiperda (Smith) (Xu et al., Reference Xu, Feng, Tang, Liu, Ding, Lyu, Yao and Yang2022), and the K-nearest model have achieved accuracy rates ranging from 58.33% to 84.67% in studies on Metisa plana (Walker) (Johari et al., Reference Johari, Khairunniza-Bejo, Rashid Mohamed Shariff, Azuan Husin, Mazmira and Kamarudin2022). In contrast, deep learning (DL), a subset of ML, involves more complex algorithms such as convolutional neural networks (CNNs), which can automatically learn features from data. DL methods have demonstrated remarkable success in pest management applications. For instance, the ResNet-Locusr-BN model, based on CNNs, has been used for identifying locust instars (Ye et al., Reference Ye, Lu, Bai and Gu2020). Furthermore, various DL models, including VGG16, ResNet50, ResNet152, and DenseNet201, were used for M. plana instar identification (Johari et al., Reference Johari, Khairunniza-Bejo, Shariff, Husin, Masri and Kamarudin2023). Despite its economic importance as a crop pest, ML and DL models have not yet been employed for identifying the instar and weight prediction of O. furnacalis larvae.
Precise identification of instars and accurate prediction of larval weight are essential for effective pest control. To tackle this challenge, our study focused on employing smartphone-captured images combined with ML technology to develop a model for accurately identifying the instars and predicting the weight of O. furnacalis larvae. This approach – targeted pest management based on developmental stages – optimises the use of chemical pesticides, reducing environmental impact and minimising crop losses. By aligning with Integrated Pest Management principles, this method supports food security through more efficient and sustainable pest control strategies. The outcomes of our study provide insights into the potential application of these models as a novel tool for determining the instar and weight of O. furnacalis and other insects.
Materials and methods
Insect
The larvae of O. furnacalis were obtained from the Conservation Monitoring Base of Jilin Agricultural University (125.40°E, 43.82°N) and were carefully maintained in a semi-natural environment (10 ± 2℃–32 ± 2℃, relative humidity: 40 ± 10%–70 ± 10%). These larvae were reared on an artificial diet comprising brewer’s yeast powder (50 g), wheat germ flour (150 g), nipagin (4 g), sorbic acid (4 g), agar (14 g), sucrose (15 g), vitamin C (4 g), and water (700 ml) (Zhou et al., Reference Zhou, Wang, Liu and Ju1980).
Larval maintenance and observation
A total of 200 larvae were individually placed in a food-grade plastic box (40 ml), covered with wax paper, and provided with ample food. To maintain humidity and air circulation, six round holes (2–3 mm diameter) were incorporated into the plastic box’s top, and approximately 30 holes (0.5 mm diameter) were added to the wax paper (Guangzhou Lechu Trading Co., Ltd., China).
To accurately determine the O. furnacalis larval instar stage (first to fifth), we observed the larvae daily at 14:00 to check if moulting had occurred since the last observation. After moulting for 4–6 h, the larvae were photographed while alive (described below), and their weights were measured daily using an electronic balance (BSA223S, Sartorius, Germany) until the pupation phase.
Data acquisition for larval instar and weight
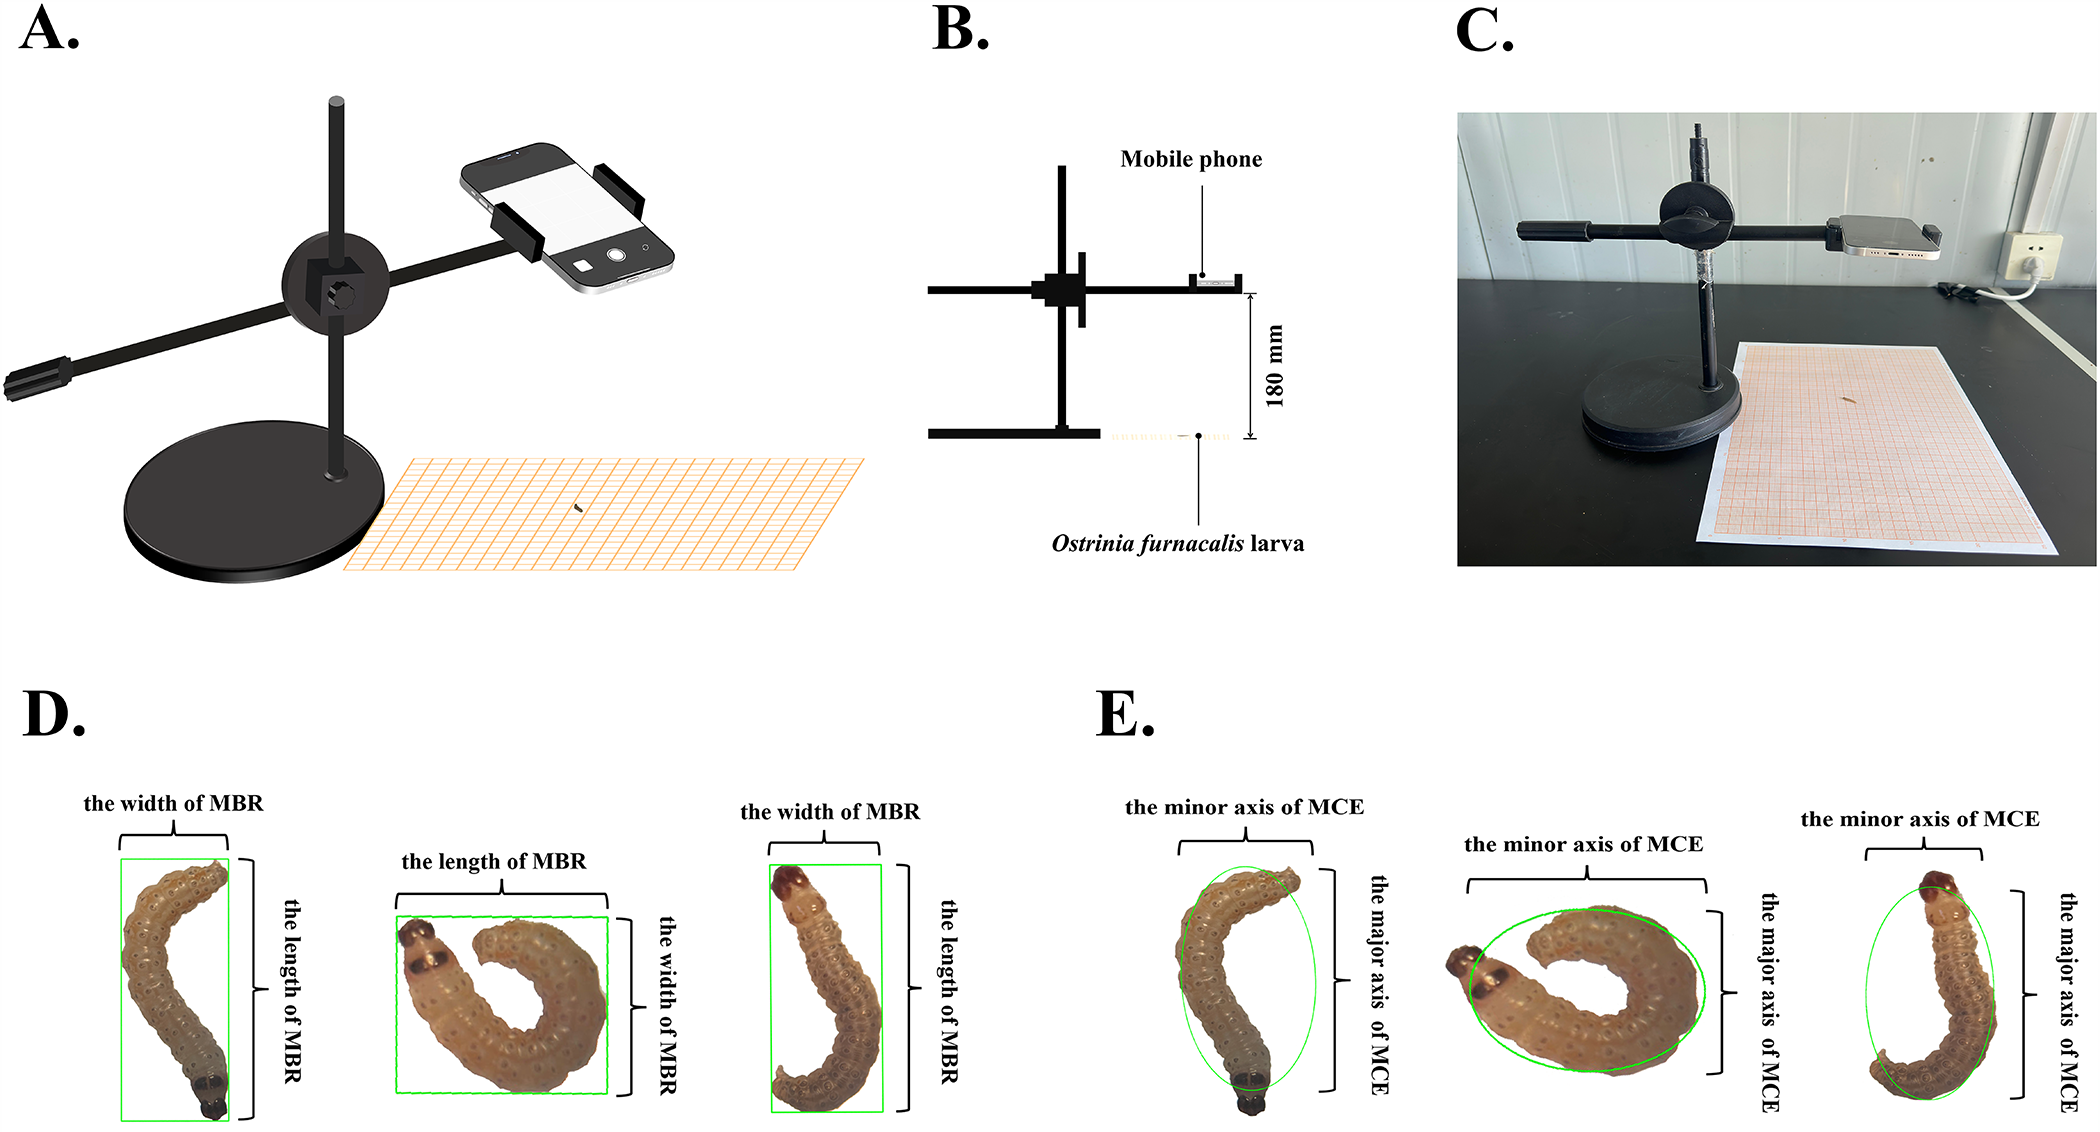
The data acquisition set-up included a mobile phone (iPhone 12, Apple Inc., USA), phone support (Shanghai Xuanxiang Trading Co., Ltd., China), and grid paper (75 cm × 105 cm, Wenlin Art Office Supplies Store, China) (fig. 2A–C). The mobile camera was positioned directly above the larvae, parallel to the surface, at a consistent distance of 180 mm and an angle of 180° to the surface, ensuring uniformity across all images. No additional lighting was used, only ambient daylight from the environment was utilised to maintain natural lighting conditions. Photography was initiated daily at 14:00, to ensure consistent lighting conditions throughout the observation period. Both observations and photography were carried out under natural daylight to avoid direct sunlight and minimise the influence of external variables.
Experimental set-up for image acquisition and evaluation of bounding techniques for Ostrinia furnacalis larvae. (A) Schematic of the image acquisition set-up; (B) front view of the image acquisition set-up; (C) actual experimental set-up used for image acquisition; (D) application of the minimum bounding rectangle (MBR) on a curved larva. The figure shows the limitations of MBR for accurately measuring the larva’s true length and width, as the bounding box encloses empty areas, especially for curved postures; (E) application of the minimum circumscribed ellipse (MCE) on a curved larva. The figure illustrates how MCE fails to precisely capture the true dimensions and curvature of the larva, as the ellipse encompasses unnecessary space, leading to inaccurate representation.

Given that the larvae were alive during image acquisition, there was a risk of motion-induced blurriness. To address this, we implemented a rigorous quality control process: any blurry images were discarded and retaken to ensure that all images used in the dataset were clear and of high quality. A dataset of 1,283 images was compiled, focusing on the larval instar stages from the second to fifth. The first instar larvae were excluded from the study due to their very small size, which resulted in negligible weight measurements. The resolution of the images used was 4032 × 3024.
Feature extraction
To avoid errors during edge detection, an open-source image annotation tool software, Labelme (version 4.5.13), was used to label RGB images of larvae manually. Mask images were generated based on the RGB images and annotation files and then converted into binary images using a thresholding value of 60 to determine whether pixels in the region of interest (ROI) represented larvae or background. Pixels exceeding this threshold were identified as larvae, while those below it were categorised as background. The binary images were used to identify the ROI, specifically the larval region, which was then analysed in the original RGB images. Geometric, colour, and texture features were subsequently extracted from the identified ROI using OpenCV (Table 1). Although the binary images are instrumental in accurately defining the ROI, the actual feature extraction was performed on the original images, ensuring that detailed information, such as colour and texture, was preserved.
Input features and symbols of instar identification and weight prediction models of Ostrinia furnacalis larvae

Considering the irregular and dynamic body shapes of larvae observed during image acquisition, utilising the length and width of the minimum bounding rectangle (MBR) or the major and minor axes of the minimum circumscribed ellipse (MCE) to approximate larval dimensions is not practical (fig. 2D, E). These methods require larvae to remain still and relatively straight, which is challenging. To overcome these limitations, we employed polygon annotation techniques to accurately extract the contour perimeter and area of the larvae. By integrating these measurements into simultaneous equations (Equations (1) and (2)), we effectively approximated the length and width of larvae, even while they are in motion.
 \begin{equation}width\; = \;\frac{{Perimeter}}{4} - \sqrt {{{\left( {\frac{{Perimeter}}{4}} \right)}^2} - Area} \end{equation}
 \begin{equation}length\; = \;\frac{{Perimeter}}{4} + \sqrt {{{\left( {\frac{{Perimeter}}{4}} \right)}^2} - Area} \end{equation}
Data-processing
Outliers in the final input features of models were identified using the  $3\sigma $ principle. Data that satisfy Equation (3) are deemed normal values, whereas those that do not are regarded as outliers and removed. A total of 1261 images were obtained after processing.
 \begin{equation}\mu \; - \;3\sigma \; \lt \;X\; \lt \;\mu \; + \;3\sigma \end{equation}
To select the input features for models, one-way analysis of variance and Tukey’s least significant difference test in Origin 2023b software (OriginLab Corporation, Northampton, MA, USA) were conducted on each of the 13 features separately ( $\alpha = 0.05$). The larvae were categorised into different instar stages, and each stage was treated as a distinct treatment in the study. The counts for the four larval instars were as follows: 306, 331, 311, and 313, respectively. Additionally, Pearson correlation analysis was performed simultaneously, with the 13 features extracted from the images serving as independent variables and O. furnacalis larval instar and weight serving as dependent variables.
To standardise the prediction accuracy across parameters with different magnitudes, feature variables underwent z-score normalisation (Equation (4)). Additionally, due to the larvae’s small weight values, a logarithmic transformation with base ‘e’ was applied to the target variable.
 \begin{equation}z = \;\frac{{x - \mu }}{\sigma }\end{equation}
where  $x$ represents the parameter value, and
 $\mu $ and
 $\sigma $ represent the mean and standard deviation over training data, respectively.
Development of feature datasets
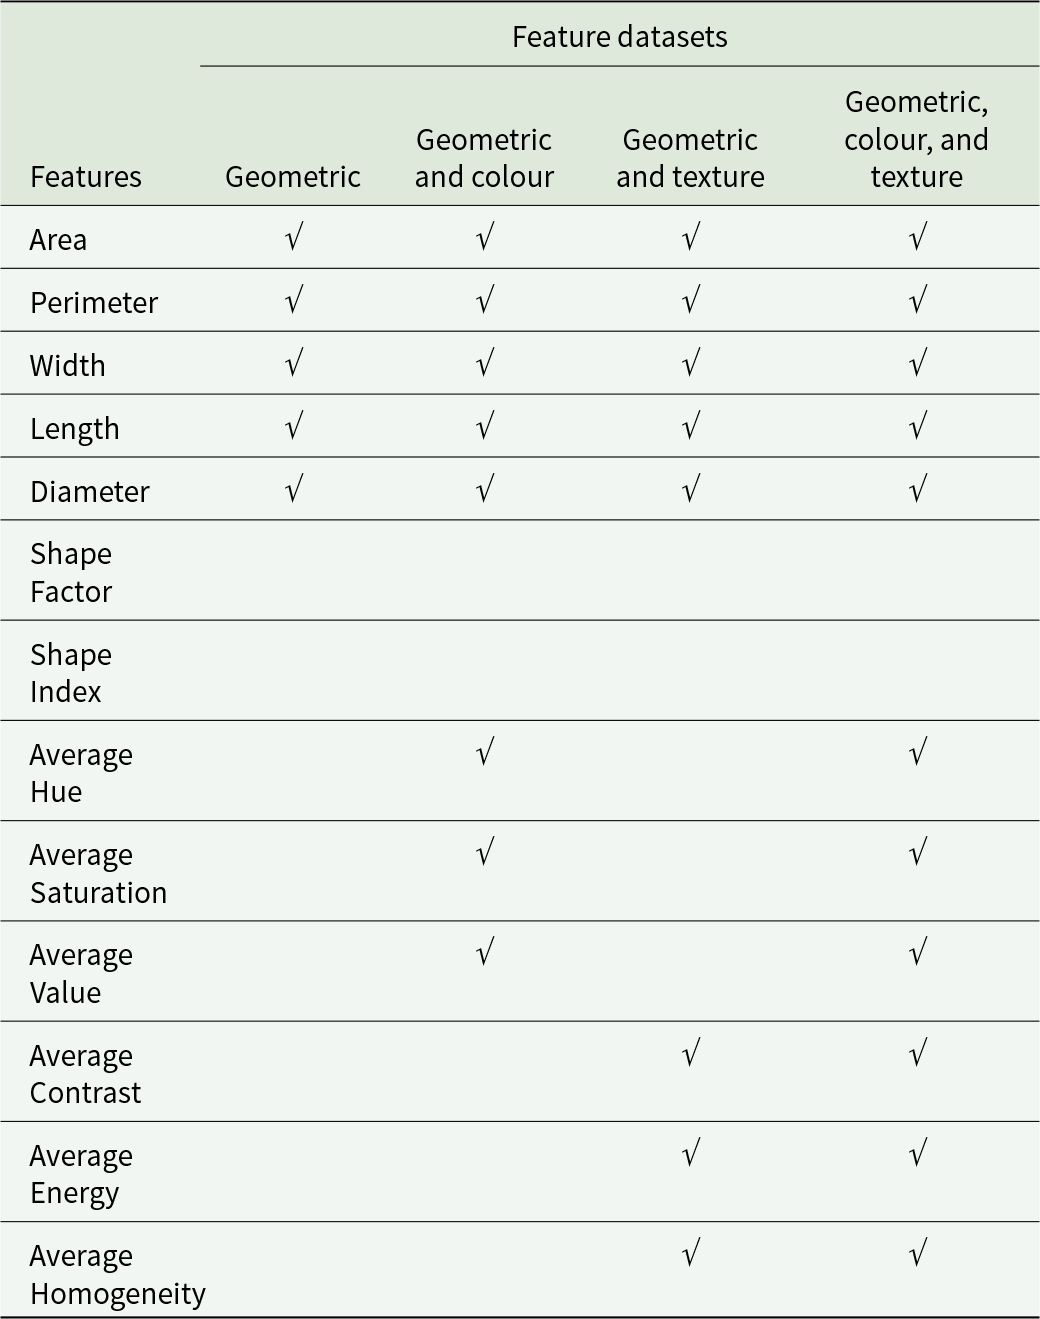
To explore the contribution of different feature types individually and in combination, we developed ML models using four distinct feature datasets: (1) with the inclusion of geometric features, (2) incorporating both geometric and colour features, (3) integrating geometric and texture features, and (4) encompassing a combination of geometric, colour, and texture features (Table 2). Instar identification and weight prediction models were established based on the four datasets and division ratio (training: testing = 7:3).
Input features contained in four feature datasets

Instar identification model performances and feature importance analysis
Identification models
We selected the following ML models from the SciKit-Learn library for their robust performance and applicability in classification tasks: AdaBoostClassifier (an ensemble method that combines weak learners), DecisionTreeClassifier (a model based on decision trees), GradientBoostingClassifier (an ensemble technique that optimises predictions), KNeighborsClassifier (a non-parametric method that classifies based on proximity), LogisticRegression (a linear model for binary classification), RandomForestClassifier (an ensemble of decision trees), RidgeClassifier (a linear classifier with L2 regularisation), SGDClassifier (a linear model optimised via stochastic gradient descent), and Support Vector Classification (a model that finds the optimal hyperplane for classification) (Pedregosa et al., Reference Pedregosa, Varoquaux, Gramfort, Michel, Thirion, Grisel, Blondel, Prettenhofer, Weiss, Dubourg, Vanderplas, Passos, Cournapeau, Brucher, Perrot and Duchesnay2011). Each of these models was developed and evaluated independently. For instar identification, datasets were randomly divided into a training dataset (70%) and a testing dataset (30%). The GridSearchCV algorithm and 10-fold cross-validation were employed to find optimal parameters for all models (Pedregosa et al., Reference Pedregosa, Varoquaux, Gramfort, Michel, Thirion, Grisel, Blondel, Prettenhofer, Weiss, Dubourg, Vanderplas, Passos, Cournapeau, Brucher, Perrot and Duchesnay2011), with the original dataset, consisting of 1,024 images of larvae, randomly partitioned into 10 equal-sized sub-datasets. All methods were implemented in Python 3.8 and PyTorch 1.12.1, with computational experiments conducted using an NVIDIA GeForce RTX 3060 GPU and an Intel Core i5-12490F CPU.
Performance assessment
To assess the model’s validity and feasibility, we calculated the following metrics: accuracy, precision, recall, and F1-score (Equations (5)–(8)).
 \begin{equation}accuracy = \frac{{TP + TN}}{{TP + FP + TN + FN}}\end{equation}
 \begin{equation}precision = \frac{{{TP}}}{{{TP + FP}}}\end{equation}
 \begin{equation}recall = \frac{{{TP}}}{{{TP + FN}}}\end{equation}
 \begin{equation}F1 - score = \frac{{2\; \times \;precision\; \times \;recall}}{{precision + recall}}\end{equation}
where TP (true positives) represent the number of actual positive samples correctly classified as positive, FN (false negatives) are actual positive samples incorrectly classified as negative. False positives (FP) indicate actual negative samples incorrectly classified as positive, and true negatives (TN) denote actual negative samples correctly classified as negative (Sokolova and Lapalme, Reference Sokolova and Lapalme2009). These categories (TP, FN, FP, TN) are identified by comparing the model’s predictions with the actual sample labels.
Feature importance analysis
Shapley Additive exPlanations (SHAP) analysis was conducted on the top-performing models (Lundberg and Lee, Reference Lundberg and Lee2017) to evaluate the importance of feature variables in the larval instar identification process. The analysis utilised RGB images to determine the contribution of each feature to the model’s predictions.
Weight prediction model performances and feature importance analysis
Prediction models
To predict the larval weight, 11 regression models were selected: AdaBoostRegressor, BaggingRegressor, DecisionTreeRegressor, GradientBoostingRegressor, KNeighborsRegressor, Lasso, LinearRegression, RandomForestRegressor, RidgeRegressor, SGDRegressor, and Support Vector Regression (Pedregosa et al., Reference Pedregosa, Varoquaux, Gramfort, Michel, Thirion, Grisel, Blondel, Prettenhofer, Weiss, Dubourg, Vanderplas, Passos, Cournapeau, Brucher, Perrot and Duchesnay2011). As with the instar identification models, these regression models were designed to operate independently. To refine the identification of optimal parameters, we utilised the GridsearchCV algorithm, along with 10-fold cross-validation.
Performance assessment
Four evaluation criteria, namely the coefficient of determination (R 2), root mean squared error (RMSE), mean absolute error (MAE), and mean absolute percentage error (MAPE) were employed to assess the performance of the larval prediction models (Equations (9)–(12)). The R 2, which ranges from 0 to 1, provides insight into the model’s goodness of fit. A value closer to 1 indicates a stronger fit. Additionally, RMSE, MAE, and MAPE values span from 0 to positive infinity. The closer these values are to 0, the greater the accuracy of the model’s predictions.
 \begin{equation}{R^2} = 1 - \frac{{\sum\limits_{i = 1}^n {{{\left( {{y_i} - {{\hat y}_i}} \right)}^2}} }}{{\sum\limits_{i = 1}^n {{{\left( {{y_i} - {{\bar y}_i}} \right)}^2}} }}\end{equation}
 \begin{equation}RMSE = \sqrt {\frac{1}{n}\sum\limits_{i = 1}^n {{{\left( {{y_i} - {{\hat y}_i}} \right)}^2}} } \end{equation}
 \begin{equation}MAE = \frac{1}{n}\sum\limits_{i = 1}^n {\left| {{y_i} - {{\hat y}_i}} \right|} \end{equation}
 \begin{equation}MAPE = \frac{1}{n}\sum\limits_{i = 1}^n {\left| {\frac{{{y_i} - {{\hat y}_i}}}{{{y_i}}}} \right|} \end{equation}
where  $n$ is the total number of data,
 ${y_i}$ is the observed larval weight, and
 ${\hat y_i}$ is the predicted larval weight.
Feature importance analysis
To evaluate the significance of feature variables in models predicting larval weight, a SHAP analysis was again performed on the highest-performing model (Lundberg and Lee, Reference Lundberg and Lee2017). In contrast to the previous SHAP analysis for larval instar identification, which utilised RGB images, this analysis specifically targeted the prediction of larval weight, providing insights into how each feature variable contributed to the outcome.
Results
Feature selection
Characteristics such as Area, Diameter, and verage Hue, with the exception of Shape Factor and Shape Index, displayed notable variations among different instar stages (figs. 3 and 4).
Mean values (±SE) of geometric features for the second to fifth instar Ostrinia furnacalis larvae, presented in seven metrics: (A) Area; (B) Perimeter; (C) Width; (D) Length; (E) Diameter; (F) Shape Factor; (G) Shape Index. Mean bars marked with different lowercase letters indicate statistically significant differences based on Tukey’s HSD test (P < 0.05).

Mean values (±SE) of colour and texture features for the second to fifth instar Ostrinia furnacalis larvae, shown in three metrics: (A) average hue; (B) average saturation; (C) average value; (D) average contrast; (E) average energy; (F) average homogeneity. Mean bars with different lowercase letters indicate statistically significant differences based on Tukey’s HSD test (P < 0.05).

Pearson correlation coefficients ( ${r_1},\;{r_2}$) between each feature, larval instar, and weight were calculated. A value greater than 0 indicates a positive correlation with the target variable (instar or weight), while a value less than 0 indicates a negative correlation. Notably, the feature Perimeter exhibited the highest correlation with instar (0.92), followed by Length (0.91), Width (0.88), and Average Homogeneity (0.88), while the Shape Index had the smallest correlation (0.21) (figs. 3 and 4). For weight, features Area, Average Energy, and Average Homogeneity showed the highest correlation (0.98), with the Shape Factor having the smallest correlation (0.044) (figs. 3 and 4).
Instar identification model performances and feature importance analysis
Identification model performances
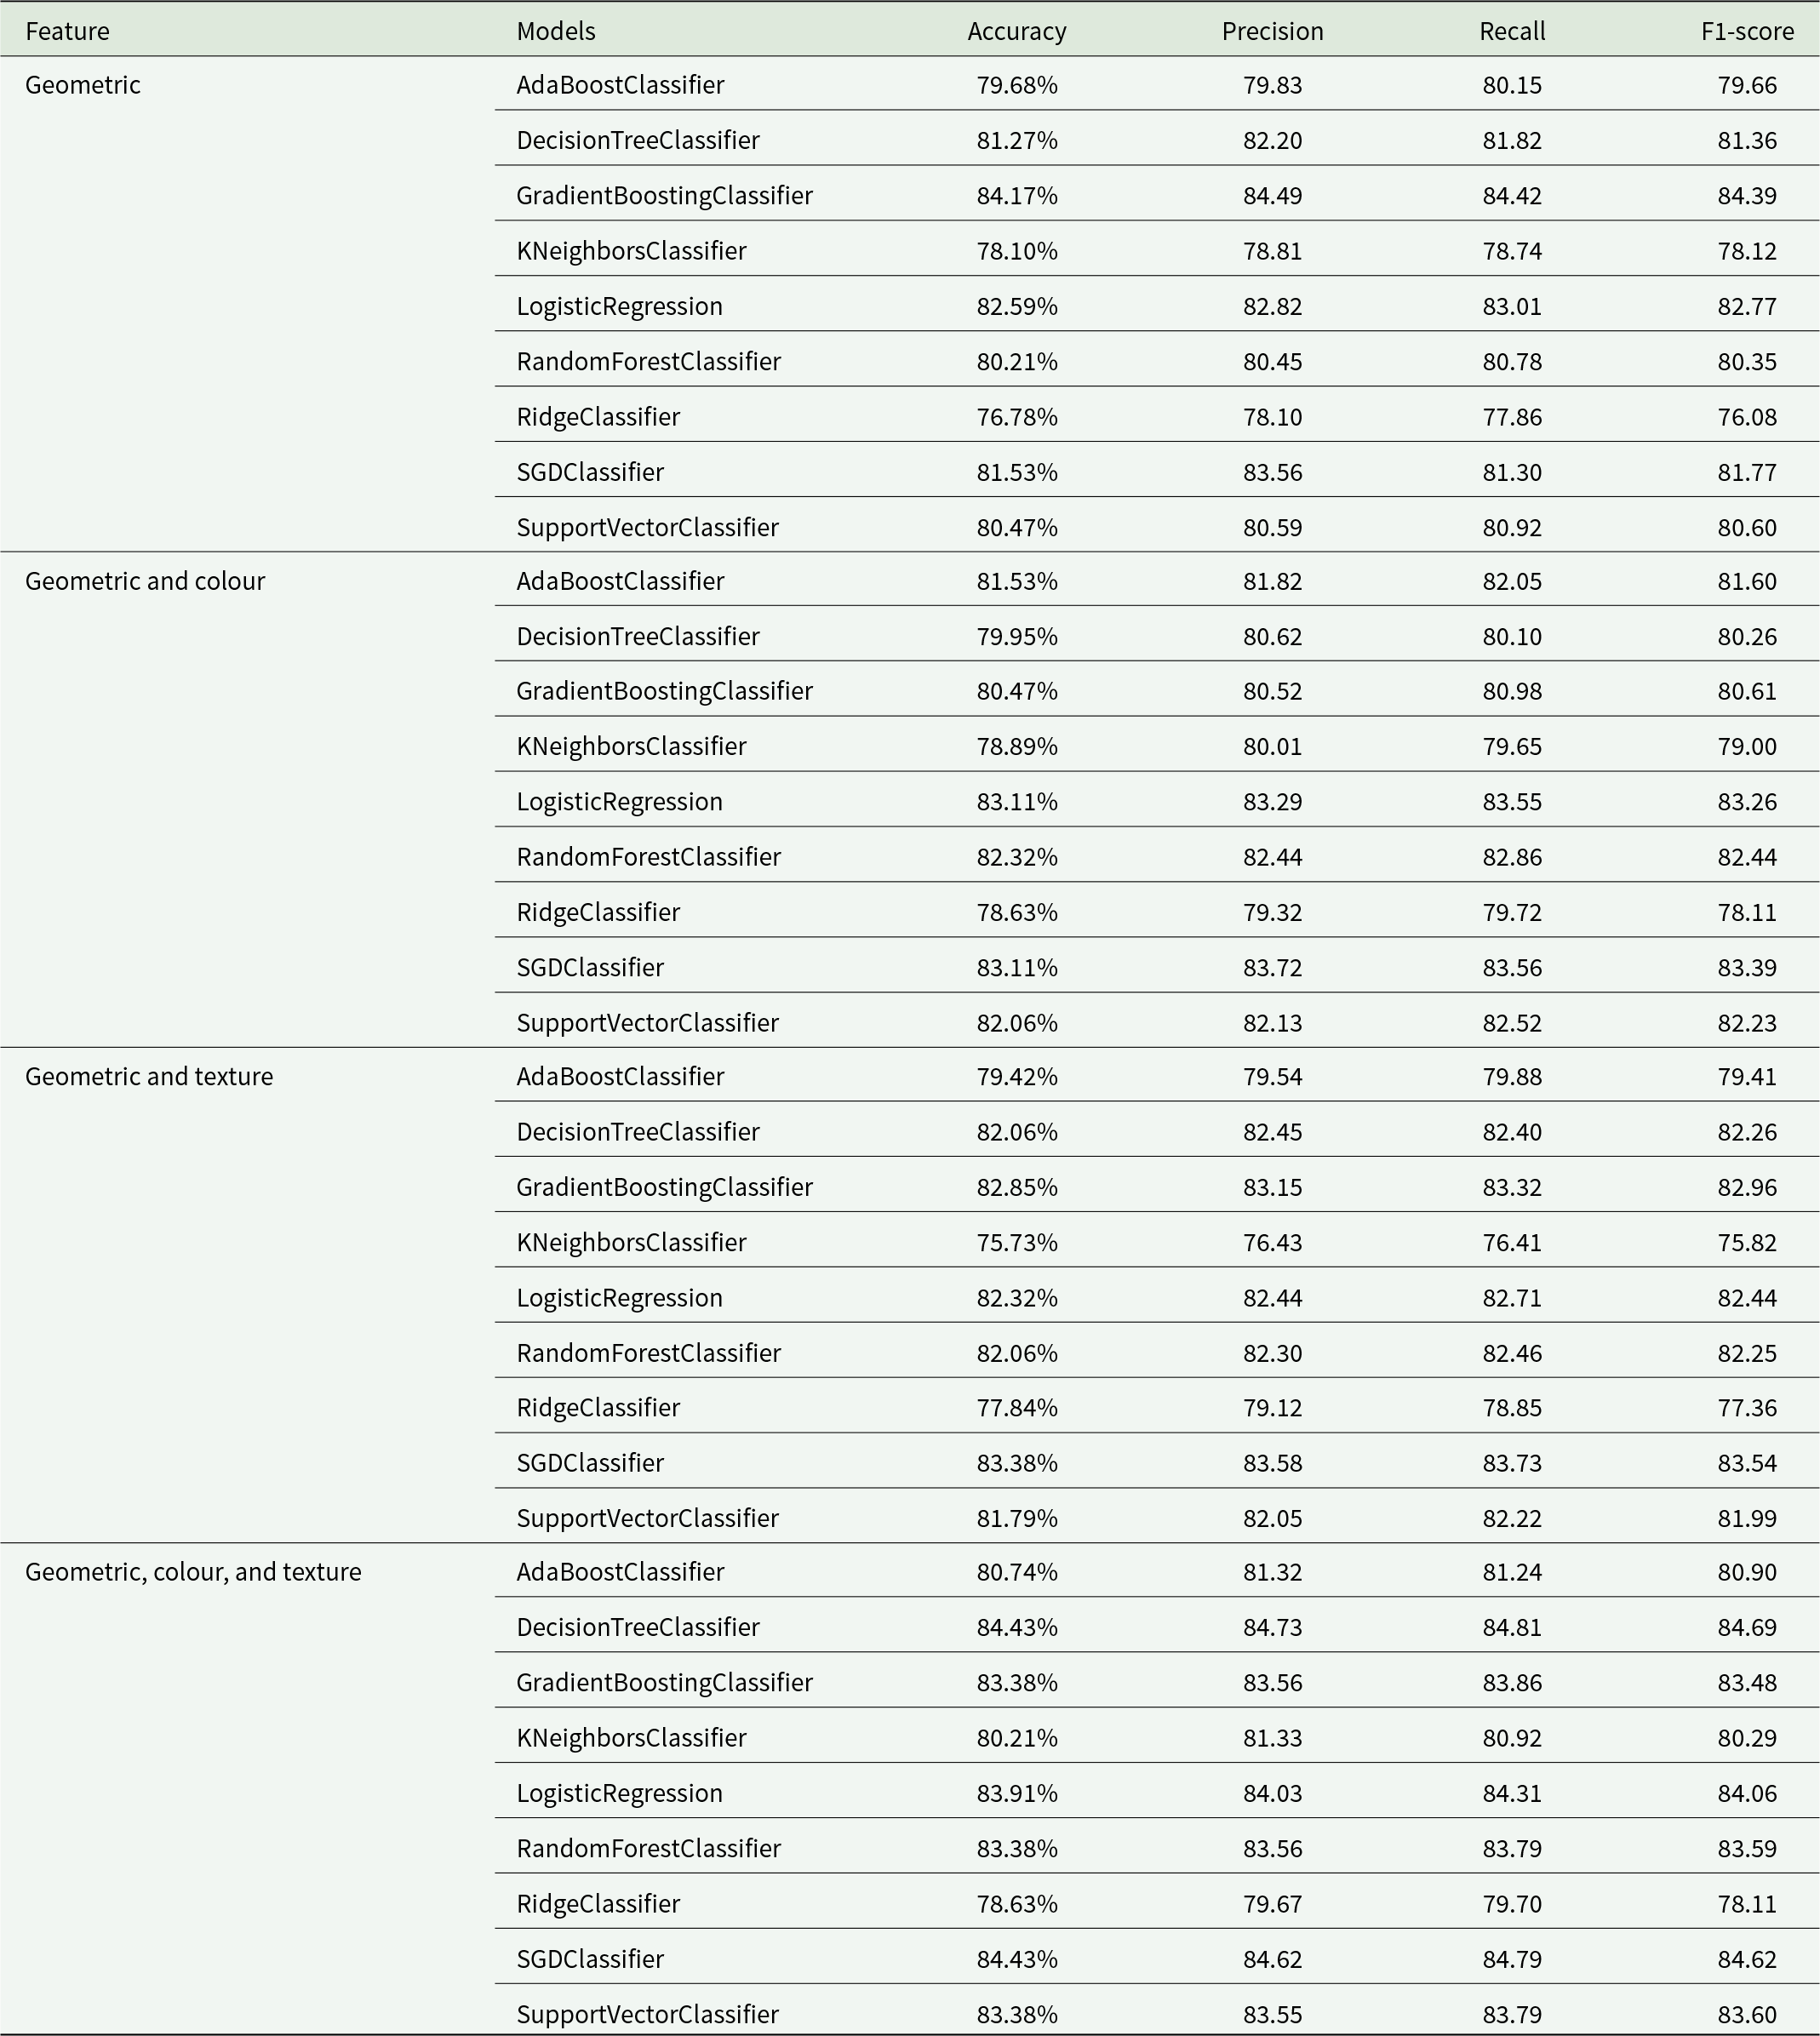
In total, nine models were employed for instar identification. Among these models, DecisionTreeClassifier exhibited best performance based on geometric, colour, and texture features, which was closely followed by GradientBoostingClassifier on the geometric features. In contrast, the KNeighborsClassifier model demonstrated the poorest performance on geometric and texture features (Table 3).
Comparison of the larval instar identification model performances in terms of accuracy, precision, recall, and F1-score

Based on geometric features, the GradientBoostingClassifier model exhibited the best performance for instar identification, achieving an accuracy of 84.17%, precision of 84.49, recall of 84.42, and an F1-score of 84.39. However, the RidgeClassifier model was the least able to discriminate between instars. When considering geometric and colour features, the accuracy of the nine models used for comparison ranged from 78.63% to 83.11%. In dataset geometric and texture features, the accuracy (75.73%), precision (76.43), recall (76.41), and F1-score (75.82) of the KNeighborsClassifier model were the lowest. In dataset geometric, colour, and texture features, the DecisionTreeClassifier and SGDClassifier models exhibited the highest accuracy (84.43%), but the DecisionTreeClassifier model outperformed in terms of precision (84.73), recall (84.81), and F1 score (84.69) (Table 3).
Feature importance analysis
Based on identification efficiency, DecisionTreeClassifier – the best model – was utilised to assess the significance of individual variables in identifying larval instars with SHAP.
In general, Average Energy and Saturation emerged as the primary features, as indicated by their average SHAP values (0.3049 and 0.2292) (fig. 5A). Geometric features played a crucial role in identifying second and fifth instar larvae, contributing 51.22% and 40.08%, respectively. Texture features were pivotal in third instar larvae identification, while colour features played a crucial role in identifying fourth instar larvae (fig. 5B).
Mean absolute SHAP values for feature importance analysis for the optimal instar identification model (Decisiontreeclassifier using geometric, colour, and texture features) of Ostrinia furnacalis larvae: (A) Ranking of feature importance: displays the ranking of individual features based on their contribution to the model’s predictive performance, with the most important features listed first. (B) Percentage distribution of the importance of geometric, colour, and texture features: illustrates the relative contribution of the three feature categories (geometric, colour, and texture) to the overall feature importance. The percentages represent the proportion of the total SHAP value attributed to each category, showing how each feature category influences the model’s prediction.

Weight prediction model performances and feature importance analysis
Prediction model performances
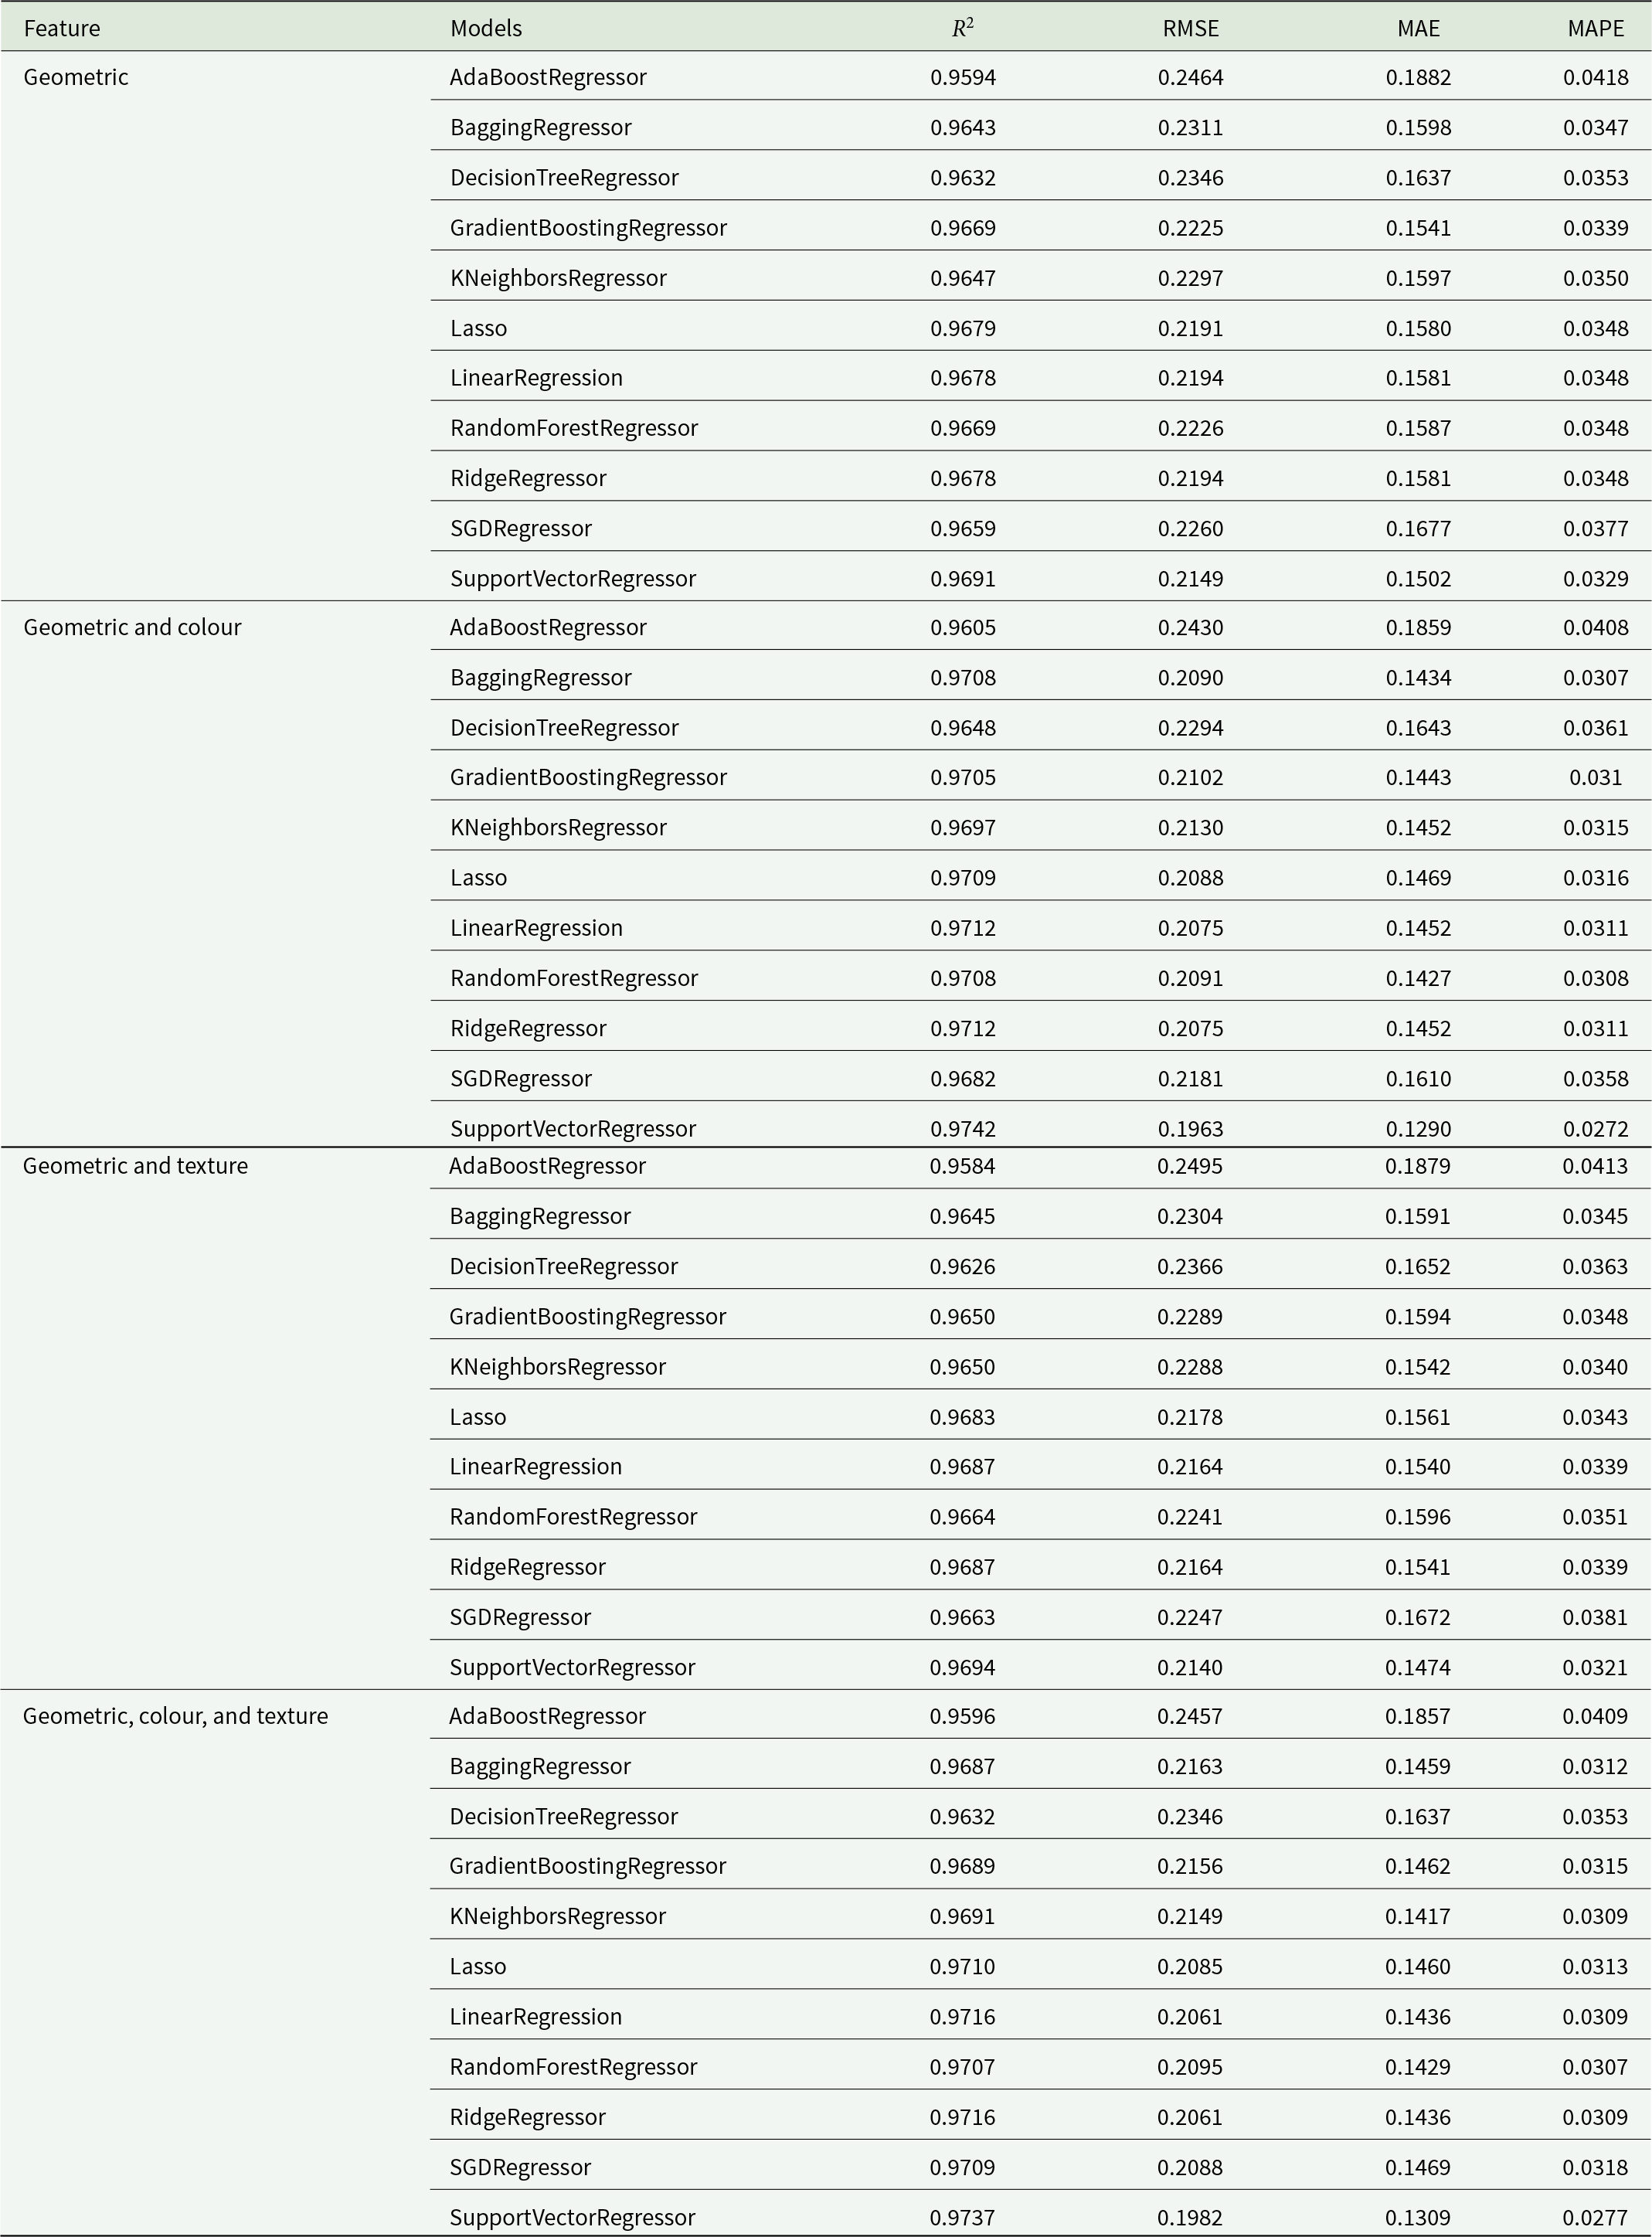
A total of 11 models were employed for weight prediction. The  ${R^2}$ varied between 0.9584 and 0.9742. Notably, when comparing the performance of 11 models across all four datasets, the Support Vector Regressor (SVR) demonstrated the highest performance on the dataset with geometric and colour features, while the AdaBoostRegressor exhibited the lowest performance on the dataset with geometric and texture features (Table 4).
Comparison of the larval weight prediction model performances in terms of coefficient of determination ( ${R^2}$), root mean squared error (RMSE), mean absolute error (MAE), and mean absolute percentage error (MAPE)

In dataset geometric features, the SVR excelled across all evaluation metrics, boasting an  $R{}^2$ of 0.9691, RMSE of 0.2149, MAE of 0.1502, and MAPE of 0.0329. Other models such as Lasso, LinearRegressor, and RidgeRegressor show similar levels of excellence across all evaluation criteria. Based on geometric and colour features, the SVR also achieved the best performance with
 $R{}^2$ (0.9742), RMSE (0.1963), MAE (0.1290), and MAPE (0.0272). However, the AdaBoostRegressor model showed the worst performance in terms of
 $R{}^2$ (0.9605). Based on geometric and texture features, the
 $R{}^2$ of the models extend from 0.9584 to 0.9694 and the MAPE ranges from 0.0321 to 0.0413. Using geometric, colour, and texture features, the
 $R{}^2$ of models such as SVR, LinearRegressor, RidgeRegressor, Lasso, SGDRegressor, and RandomForestRegressor were over 0.97 (Table 4).
Feature importance analysis
The average SHAP value of the Width feature (0.2702) exceeded that of other features, indicating its influence on the SupportVectorRegressor optimal weight prediction model. Conversely, the feature average hue (0.0322) demonstrated the lowest impact (fig. 6A). Additionally, geometric features with 73.05% exerted the greatest influence on model prediction, followed by colour features (26.95%) (fig. 6B).
Mean absolute SHAP values for feature importance analysis for the optimal weight prediction model (support vector regression using geometric and colour features) of Ostrinia furnacalis larvae: (A) Ranking of feature importance: displays the ranking of individual features based on their contribution to the model’s predictive performance, with the most important features listed first. (B) Percentage distribution of the importance of geometric and colour features: illustrates the relative contribution of each of the two feature categories (geometric and colour) to the overall feature importance. The percentages represent the proportion of the total SHAP value contributed by each category, providing a breakdown of the feature categories’ influence on the model’s prediction.

Discussion
In this study, we aim to propose ML models to identify the instar and predict the weight of O. furnacalis larvae through the utilisation of images captured with smartphones. The swift identification of larval instars and prediction of their weights in the field present a significant challenge, particularly for agricultural practitioners such as farmers. This undoubtedly heightens the complexity of targeted pest control efforts. To address these challenges, we developed multiple models for predicting the larval instars and weights of O. furnacalis. Each model was trained and evaluated independently to assess the effectiveness of various feature combinations. This approach provides agricultural practitioners with flexible and robust tools, allowing them to select the most appropriate model based on specific field conditions or operational needs.
The larvae frequently change between various curved positions, which surely pose a challenge to the actual implementation of the strategy since it assumes that larvae should follow a straight path. To tackle this challenge, we propose a solution by formulating equations that establish a relationship between larval area and perimeter concerning width and length rather than relying solely on the major and minor axes of the MBE (Johari et al., Reference Johari, Khairunniza-Bejo, Rashid Mohamed Shariff, Azuan Husin, Mazmira and Kamarudin2022; Lu and S-j, Reference Lu and S-j2020). This not only streamlines the process of capturing larval images but also introduces a novel perspective for feature extraction in analogous research studies. However, accurately capturing contours and areas remains a challenge under varying environmental conditions. Enhancing this approach with advanced image processing techniques or adaptive ML models could improve performance in diverse field conditions.
Our evaluation revealed that the DecisionTreeClassifier and GradientBoostingClassifier were particularly effective in instar identification. The DecisionTreeClassifier showed commendable performance within the geometric, colour, and texture features, achieving accuracy, precision, recall, and F1-score metrics exceeding 84%. This highlights its sensitivity and robustness in handling instar identification. The GradientBoostingClassifier also demonstrated high performance across diverse metrics in all four datasets, indicating its superiority in navigating dynamically changing data scenarios. Similarly, the GradientBoostingClassifier showed high performance across various metrics, indicating its superiority in navigating dynamically changing data scenarios.
For weight prediction, the SVR proved to be the most effective model. It demonstrated high accuracy and robustness by effectively managing the non-linear relationship between features and larval weight. This capability is crucial for optimising pest control strategies, as precise weight predictions are essential for tailoring interventions based on the developmental stage of the larvae. Notably, the SVR performed exceptionally well when utilising geometric and colour features, highlighting its effectiveness in capturing the variations in weight across different instar stages.
Although most studies have focused on predicting the weight of larger animals like pigs and cows (He et al., Reference He, Tiezzi, Howard and Maltecca2021; Ruchay et al., Reference Ruchay, Kober, Dorofeev, Kolpakov, Dzhulamanov, Kalschikov and Guo2022), recent advancements in estimating the biomass of invertebrates, such as the BIODISCOVER system (Ärje et al., Reference Ärje, Melvad, Jeppesen, Madsen, Raitoharju, Rasmussen, Iosifidis, Tirronen, Meissner, Gabbouj and Høye2020), offer a novel approach for invertebrate biomass estimation using advanced image analysis and ML techniques. Incorporating such techniques into larval weight prediction could enhance model accuracy and applicability. Future research may explore these advanced methods may provide further refinement and validation of weight prediction models in diverse field conditions.
Image quality is a critical factor for effective model training. Despite rigorous quality control in laboratory settings to ensure clear and blur-free images, capturing high-quality images in the field remains challenging due to variations in lighting, camera motion, and complex backgrounds. To address this, further development of advanced preprocessing techniques and image enhancement methods is essential to mitigate the impact of suboptimal image quality on model performance.
The inclusion of SHAP (Shapley Additive Explanations) analysis was crucial for improving model interpretability. SHAP provides insights into how each feature contributes to predictions, enhancing feature selection, and model accuracy. This transparency is valuable for validating model decisions and making the methodology more accessible to agricultural practitioners. Future assessments should examine SHAP’s effectiveness in scenarios with missing features to ensure model robustness under varied conditions.
The exclusion of outliers during model training was essential to prevent noise from reducing accuracy and generalisability. While outliers can sometimes offer insights, their inclusion could have led to overfitting and decreased model robustness. Thus, their exclusion was deemed necessary to maintain a high level of model performance and reliability. Future studies may explore the potential benefits of integrating outlier detection mechanisms to assess their impact on model training more comprehensively.
While our models demonstrated strong performance in controlled settings, further optimisation is needed for practical field applications. Variations in real-world environments can introduce noise that affects model accuracy. Enhancing preprocessing methods and model adaptability will be crucial for maintaining high performance in diverse conditions. These improvements will expand the practical use of our models, offering farmers more accurate tools for pest assessment and contributing to better pest control strategies and reduced economic losses.
Acknowledgements
We would like to thank the Jilin Provincial Department of Science and Technology of China (Grant number 20220203198SF).
Competing interests
None.