





Introduction
Community acquired pneumonia (CAP) is a leading cause of morbidity and mortality worldwide. Because the causative organism of CAP is unknown at presentation, empiric antibiotic therapy remains the cornerstone of treatment. Reference Jones, Ramirez and Oren1 While there is emerging evidence for shorter antibiotic courses in CAP patients who achieve clinical stability, determining when to safely discontinue antibiotics in severe community-acquired pneumonia (SCAP) remains an ongoing challenge. Reference Kuijpers, Buis and Ziesemer2
Procalcitonin (PCT), a biomarker typically elevated in bacterial infections but suppressed in viral infections, has shown potential as an antibiotic stewardship tool. Randomized controlled trials (RCTs) suggest that serial PCT testing to determine antibiotic duration can reduce antibiotic exposure by 1.5–2.4 days in acute respiratory infections including CAP and in critically ill patients with sepsis. Reference Schuetz, Wirz and Sager3–Reference Kubo, Sakuraya and Sugimoto5 However, whether this effect occurs in real-world practice is unclear. Antibiotic durations are now shorter than when these studies were conducted and physicians may not discontinue antibiotics in response to PCT. Even in RCTs, physicians did not always follow the protocol regarding discontinuation after PCT. Notably, in the ProACT trial, providers mostly ignored low PCT values among CAP patients and no reduction in antibiotic duration was observed. Reference Huang, Yealy and Filbin6 However, in clinical practice, for patients outside the intensive care unit (ICU), PCT was associated with a half-day reduction when values were low. Reference Deshpande, Schulte and Walker7
The 2019 American Thoracic Society (ATS)/Infectious Diseases Society of America CAP management guidelines recommended against PCT when deciding about antibiotic initiation, because it cannot reliably rule out bacterial infection. Instead, they suggested a narrow indication, PCT could be used for to stop antibiotics after 48 hours for patients with influenza pneumonia, especially where the average length of stay exceeds 5–7 days. Reference Metlay, Waterer and Long8,Reference Martin-Loeches, Torres and Nagavci9 The 2025 update to these guidelines recommends that antibiotic duration in SCAP be determined by clinical stability alone without regard to PCT. Reference Jones, Ramirez and Oren1 Thus, per current US guidelines, there appears to be no role for PCT in CAP or SCAP.
Little is known about physicians’ use of PCT for SCAP. This study aims to evaluate PCT testing practices for patients with SCAP across multiple hospitals, identify factors associated with PCT testing and with PCT levels, and assess PCT’s association with antibiotic duration.
Methods
Study design and population
We conducted a retrospective cohort study using electronic health records data from 12 hospitals within a shared health system after institutional review board approval. We included adult patients (aged ≥18 years) admitted through the emergency department (ED) with an admitting diagnosis of CAP and meeting SCAP criteria (see below) between November 1, 2022, and June 30, 2025.
We excluded patients who (1) were transferred from another acute care facility, (2) were discharged from an acute care hospital in the previous week, (3) had cystic fibrosis, (4) had known pathogens prior to admission (defined as positive blood or respiratory cultures within 72 hours before admission), (5) had concurrent non-CAP infections (identified by International Classification of Diseases, Tenth Revision [ICD-10] codes present on admission), (6) had complicated CAP (e.g., previous diagnosis of pneumonia within 30 days, lung abscess, empyema, lung necrosis, or pleural drainage procedures identified by ICD-10 present on admission codes), (7) were immunocompromised (based on ICD-10 present on admission codes), or (8) died within 24 hours of admission. For patients with multiple qualifying admissions, we excluded any admission within 30 days after a previous admission and then chose a random admission for inclusion.
Data collection and variable definitions
For each hospitalization, we collected demographic data (age, sex, race/ethnicity, and insurance status), clinical presentation characteristics, ED diagnosis, vital signs, laboratory values, microbiology results, treatment information, comorbidities, and mortality data from electronic health records. We also recorded ICU admission.
We defined SCAP using modified ATS criteria, either one major criterion (invasive mechanical ventilation or need for vasopressors) or ≥3 minor criteria (non-invasive ventilation, high respiratory rate [≥30 breaths/min, low PaO2/FiO2 [<250 mg], confusion, uremia [BUN ≥20 mg/dL], leukopenia [WBC <4k], thrombocytopenia [Platelets <100k, or hypothermia [ ≤96°F]). Reference Mandell, Wunderink and Anzueto10 Clinical stability was determined based on ATS criteria and defined as temperature <100°F with at most one sign of clinical instability (systolic blood pressure <90 mmHg, heart rate >100 beats/min, respiratory rate >24 breaths/min, or oxygen saturation <90%) within the first 24 hours of admission. Reference Mandell, Wunderink and Anzueto10 ED diagnosis was the ED physicianT’s working diagnosis at presentation as documented in the electronic health records via diagnosis codes.
PCT testing was included if collected within 24 hours of admission, with values dichotomized as low (<0.5 μg/L) or high (≥0.5 μg/L) based on established sepsis thresholds. Reference Wacker, Prkno, Brunkhorst and Schlattmann11,Reference Schuetz, Bolliger and Merker12 PCT testing post 24 hours and serial PCT testing were also identified.
Exposure and outcomes
The primary outcome was total antibiotic duration in days, including both inpatient and outpatient doses. We conducted two primary analyses: (1) comparing antibiotic duration for patients who received PCT testing within 24 hours of hospital admission versus those who did not and (2) comparing those with low versus elevated admission PCT.
Statistical analysis
We summarized categorical variables using frequencies and proportions and continuous variables using means and standard deviations, unless specified otherwise. Group comparisons were performed using two-sample t-tests or Wilcoxon rank sum tests for continuous variables and PearsonT’s chi-squared or FisherT’s exact tests for categorical variables, as appropriate. PCT testing rates, values, and serial testing rates were compared across hospitals using PearsonT’s chi-squared test. We performed a descriptive analysis of PCT serial testing patterns including frequency, time intervals between tests, and association with PCT levels and clinical stability. Descriptive analysis was also performed for patients without initial PCT testing with post 24-hour testing including frequency and association with clinical stability.
To address potential confounding by indication, we employed propensity score methods with overlap weighting. Reference Li, Thomas and Li13 For the PCT testing analysis, we estimated the propensity score using a mixed-effects model with a hospital-level random effect to model the probability of receiving PCT testing within 24 hours of admission. The model included patient demographics (age, sex, race/ethnicity, and insurance status), clinical presentation characteristics (ED diagnosis, clinical stability, first measured vital signs [systolic and diastolic blood pressure, respiratory rate, temperature, and oxygen saturation], laboratory values [white blood cell count, hemoglobin, sodium, blood urea nitrogen, glucose], microbiology testing [blood cultures, respiratory cultures, MRSA screening, and UAT testing], viral testing results [COVID-19, influenza, and RSV]), interventions (vasopressors, noninvasive ventilation, mechanical ventilation, dialysis), and comorbidities (via diagnosis codes). All variables were limited to within the first 24 hours of admission.
We developed similar propensity score models for PCT value analysis. Overlap weighting assigns each patient a weight proportional to their probability of being in the high PCT versus low PCT group, thus creating well-balanced comparison groups. We assessed covariate balance before and after weighing using standardized mean differences, considering values <0.1 as indicating adequate balance. Variables not achieving adequate balance were included in outcome models. We also repeated the PCT value analysis with values dichotomized at 0.1 and 0.25 μg/L, thresholds more commonly used in trials of PCT-guided therapy in CAP.
For total antibiotic duration analysis, we used weighted linear mixed models. Hospital was included as a random effect to account for clustering of patient encounters. All models used robust standard errors to account for the weighted analysis. We used two-sided statistical tests with a significance level of 0.05. Missing data was quantified to substantiate use of complete case analysis. All analyses were conducted using R version 4.4.0 (R Foundation for Statistical Computing).
Results
After applying exclusion criteria, our analysis included 1,553 patients with SCAP (Figure 1), of whom 325 (21%) were clinically stable at admission. The median time for PCT result from admission to the floor was 7.1 hours (IQR 5.1, 11).
Patient inclusion flowsheet.

PCT testing patterns
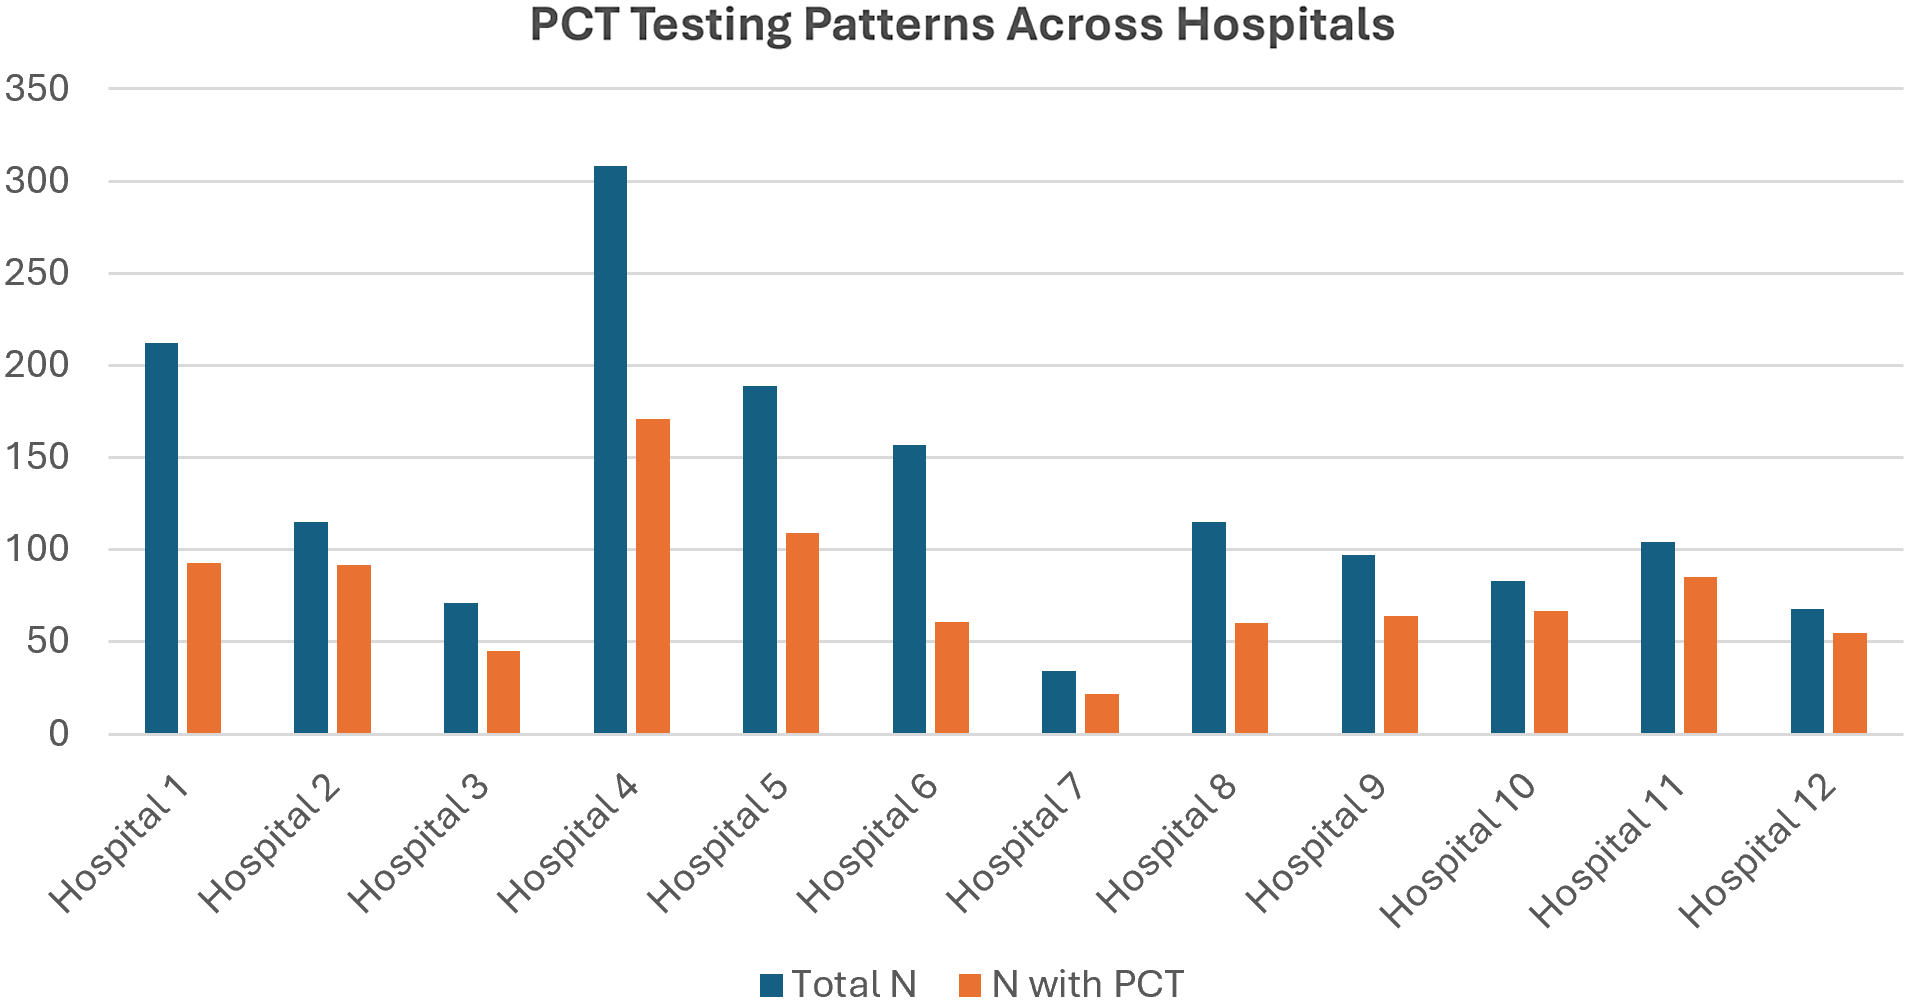
59.5% (924/1553) of patients underwent PCT testing within 24 hours of admission. Testing rates varied substantially across hospitals, ranging from 38.9% to 81.7% (Figure 2).
PCT testing proportions by hospital.

Table 1 shows patient characteristics stratified by PCT testing. Mean age was similar (75 years with PCT vs 74 years without). Patients diagnosed with aspiration pneumonia in the ED were less likely to be tested. Those diagnosed with COVID-19 or influenza pneumonia were more likely to be tested. Testing was not associated with patients’ severity of illness as measured by CURB-65 scoring or with clinical stability on admission, but patients requiring mechanical ventilation were less likely to be tested. Patients with chronic heart failure or non-invasive ventilation were more likely to be tested.
Comparison of the clinical and demographic characteristics of the entire cohort and among patients who were tested versus who were not tested for procalcitonin (PCT)

Table 1. Long description
The table compares clinical and demographic characteristics of patients tested and not tested for procalcitonin (PCT). It has 4 columns: Did, PCT N = 1050, No PCT N = 4325, and P value. The table includes 50 rows with various characteristics such as age, gender, comorbidities, and clinical conditions. Each row provides specific values for patients tested and not tested for PCT, along with the P value indicating statistical significance. Notable characteristics include age, gender distribution, comorbidities like chronic heart failure, and clinical conditions such as COVID-19 and influenza pneumonia. The table also includes CURB-65 scores and clinical stability on admission.
Note: Data are presented as n (%) for categorical variables and median (Q1, Q3) for continuous variables unless otherwise specified. PCT = procalcitonin; SD = standard deviation; BP = blood pressure; WBC = white blood cell; BUN = blood urea nitrogen; UAT = Urinary Antigen Test; MRSA = methicillin-resistant Staphylococcus aureus; RSV = respiratory syncytial virus; LOS = Length of Stay; IMV = Intermittent Mechanical Ventilation; HIV = Human Immunodeficiency Virus
Among tested patients, 49% (452/924) had PCT values <0.5 μg/L. Among those with PCT tests, 26% underwent serial PCT testing; this ranged from 14% to 53% among hospitals. Supplemental Figure 1 shows the distribution of number of PCT tests conducted for all hospitals combined.
Initial PCT value was not associated with serial testing: 131 (28%) patients with a low PCT value and 105 (23%) patients with a high PCT value underwent serial PCT testing. The median duration between serial tests was 73.3 hours (IQR: 33.1, 144.2); 152 (24%) patients without initial PCT testing underwent testing after 24 hours. Of those, 63 (41%) were clinically stable at the time of testing.
Clinical characteristics by PCT value
Table 2 shows patient characteristics based on PCT test value. Females had lower mean values than males. Markers of disease severity, including clinical instability, CURB-65 scores ≥4, lower SBP, higher pulse, WBC counts >11k, higher BUN, and vasopressors on day 1 were associated with a high PCT value. Patients with high PCT values were more likely to have sepsis and chronic kidney disease requiring dialysis. Patients with low PCT values were more likely to have heart failure and chronic pulmonary disease.
Comparison of the clinical and demographic characteristics of the entire cohort and among patients with low PCT value versus those with high PCT value

Table 2. Long description
A table comparing clinical and demographic characteristics of patients with low and high PCT values. The table has 45 rows and 6 columns. Column headers are: Characteristics, Overall (N = 504), Low PCT (≤ 0.25 ng/mL, N = 472), High PCT (> 0.25 ng/mL, N = 32), and P value. Row labels include Gender, Race/Ethnicity, Insurance, Clinical presentation, Severity scores, Comorbidities, and more. Each row provides specific values for each category. Notable trends include differences in gender distribution, clinical presentation, severity scores, and comorbidities between patients with low and high PCT values.
Note: Data are presented as n (%) for categorical variables and median (Q1, Q3) for continuous variables. P-values calculated using Wilcoxon rank sum test, PearsonT’s Chi-squared test, or FisherT’s exact test as appropriate. PCT = procalcitonin; SD = standard deviation; BP = blood pressure; WBC = white blood cell; BUN = blood urea nitrogen; UAT = Urinary Antigen Test; MRSA = methicillin-resistant Staphylococcus aureus; RSV = respiratory syncytial virus; LOS = Length of Stay; IMV = Intermittent Mechanical Ventilation; HIV = Human Immunodeficiency Virus
Association with antibiotic duration and discontinuation
Of study patients, 99% received antibiotics upon admission. Figure 3 shows antibiotics by day based on PCT testing and value. After adjustment using overlap weighting, PCT testing was associated with a shorter antibiotic duration versus no testing (mean 6.9 vs 7.4 days, adjusted mean difference, −0.5 days, 95% CI: −0.8, −0.3). Compared to no testing, PCT testing was associated with a greater shortening of antibiotic duration for patients who were stable on admission (mean 6.6 vs 7.3 days, adjusted mean difference of −0.8 days, 95% CI: −1.5, −0.1) than for those who were unstable on admission (mean 7.2 vs 7.5 days, adjusted mean difference of −0.4 days, 95% CI: −0.8, −0.05).
Tracking of proportion of patients on antibiotics by day based on PCT testing and value.

Among those tested, low PCT values were associated with shorter antibiotic duration than high values (mean 6.5 vs 7.6 days, adjusted mean difference of −1.1 days, 95% CI: −1.9, −0.2). The association was consistent in direction using lower thresholds (Supplemental Table 1). At 0.25 μg/L, 342 patients (37%) had a low PCT and the adjusted mean difference was −0.9 days (95% CI: −1.8, −0.05). At 0.1 μg/L, 127 (14%) had a low PCT and the adjusted mean difference was −1.1 days (95% CI: −2.2, 0.06).
PCT testing was not associated with a significant difference in the proportion of patients whose antibiotics were discontinued within 48 hours (169/921 [18%]) compared to those who were not tested (111/623 [19%]) (P = .8). However, patients with low PCT values were more likely to have their antibiotics discontinued within 48 hours (98/451 [22%]) compared to those with high PCT values (71/470 [15%]) (P = .009).
Discussion
In this multi-hospital cohort study of patients admitted with SCAP, we found that despite a lack of guideline recommendations for PCT testing, most patients had PCT measured. PCT testing was associated with a statistically significant reduction in total antibiotic duration. The benefit was most pronounced amongst patients without signs of clinical instability upon admission, but providers were just as likely to order PCT in unstable versus stable patients.
Current ATS guidelines do not recommend PCT testing to guide either antibiotic initiation or discontinuation. Reference Jones, Ramirez and Oren1 The logic is that a low PCT alone is not sufficiently sensitive to rule out bacterial infection. Instead, the guidelines recommend that clinical stability be used to guide discontinuation. We found no evidence that providers used PCT to initiate antibiotics, as 99% of our cohort received antibiotics in the ED. Instead, they appeared to use PCT to help distinguish between bacterial and non-bacterial infections in determining antibiotic duration, especially when the diagnosis was uncertain. Because PCT is associated with bacterial infection, a low PCT makes bacterial infection less likely. Reference Huang, Yealy and Filbin6,Reference Metlay, Waterer and Long8,Reference Evans, Rhodes and Alhazzani14 Like WBC count, viral PCR, and chest x-ray, PCT should contribute to an overall clinical picture rather than be used in isolation.
Because clinical stability is a prerequisite for antibiotic discontinuation, one might expect PCT to be ordered primarily for clinically stable patients. However, we found that PCT testing was not associated with clinical stability, either on admission or later, even though stable patients were more likely than unstable ones to have low PCT values and to have their antibiotic duration shortened. These last two observations suggest that PCT does have clinical value, but that providers could use it more efficiently by limiting testing to patients most likely to benefit—those who are clinically stable.
Few RCTs have focused on CAP exclusively. One study, published in 2006, randomized 302 CAP patients to PCT-guided antibiotic discontinuation and demonstrated a 7-day reduction in antibiotic duration (median duration 5 days vs 12 days in non-PCT-guided). Reference Christ-Crain, Stolz and Bingisser15 In a patient-level meta-analysis of 26 RCTs, PCT guidance reduced antibiotic duration among 2,910 CAP patients by 2.4 days compared to controls. Reference Schuetz, Wirz and Sager3 Most recently, a trial of 468 hospitalized non-ICU CAP patients produced a reduction of only 1.5 days (median duration 5.5 days versus 7 days in non-PCT-guided) . Reference Duijkers, Prins and Kross16 We found that PCT testing was associated with an even more modest reduction of 0.5 days. This may reflect that earlier studies had longer antibiotic durations overall, incorporated serial testing with algorithm-based decisions for antibiotic discontinuation, and included few, if any, patients with SCAP. In the ProACT trial, where physicians adhered to the trial protocol for <40% of CAP patients, no reduction in antibiotic duration was observed. Reference Huang, Yealy and Filbin6 Unlike in ProACT, our physicians appeared to consider PCT results in their decision-making; however, the impact may have been blunted by patient selection and intensity of follow up. But even modest reductions in antibiotic duration may have significant population-level impact on antibiotic resistance and adverse events.
Unlike in the RCTs, only a quarter of our cohort underwent serial testing; furthermore, those with high initial PCT value, who would theoretically benefit most from serial testing, were not more likely to receive serial testing compared to low values. Physicians generally ordered PCT as a stand-alone diagnostic test, rather than using it to assess trajectory of a bacterial infection. This differs from RCT protocols, in which serial testing was performed at baseline and at regular intervals (typically every 1–3 days) during hospitalization. Reference Schuetz, Wirz and Sager3,Reference Huang, Yealy and Filbin6,Reference Christ-Crain, Stolz and Bingisser15,Reference Duijkers, Prins and Kross16 Other studies of real-world PCT testing also found low serial testing rates—in one study 29.7% of critically ill sepsis patients had serial measurements, and in another only 17% of patients with suspected bloodstream infections and admission-day PCT had repeat testing. Reference Chu, Mehta and Walkey17,Reference Lawandi, Oshiro and Warner18
Our study has clinical implications. The reduction in antibiotic duration with PCT testing, especially in clinically stable patients, suggests that providers use it to aid in antibiotic discontinuation. However, the lack of association between testing and clinical stability, low rate of serial testing, and the use of PCT as stand-alone test for antibiotic duration decisions highlight opportunities to use PCT more effectively. Hospitals could implement evidence-based protocols that limit testing to clinically stable patients, incorporate serial testing for patients with elevated PCT and use algorithm-based discontinuation criteria.
This study has limitations. Overlap weighting balanced measured covariates but cannot address unmeasured confounding, including the physicianT’s judgement about the likelihood of bacterial infection. The comparison of low versus high values may partly reflect residual differences rather than the test itself. Furthermore, infrequent PCT serial testing prevented us from evaluating its association with reduced antibiotic duration. Although we did not assess the safety of shorter antibiotic durations associated with PCT testing, randomized trials suggest that PCT testing reduces mortality in sepsis patients and may do so in CAP. Reference Schuetz, Wirz and Sager3,Reference Evans, Rhodes and Alhazzani14,Reference Wirz, Meier and Bouadma19 We excluded immunocompromised patients and those with extrapulmonary complications, so our results cannot be extended to them.
Conclusion
In summary, despite ATS guidelines recommending against PCT testing in SCAP, more than half of patients had at least one test. Physicians appeared to use PCT results to help decide when to discontinue antibiotics, especially when the diagnosis of bacterial infection was in doubt. PCT testing was associated with shorter antibiotic courses, especially for patients who were clinically stable, but clinically stable patients were not more likely to be tested. Guidelines should consider evaluating PCT to aid antibiotic discontinuation in clinically stable patients, potentially developing algorithm-based discontinuation protocols to maximize the utility of PCT-guided antibiotic stewardship.
Supplementary material
The supplementary material for this article can be found at https://doi.org/10.1017/ice.2026.10600
Data availability statement
The data that support the findings of this study are available from the corresponding author upon reasonable request.
Acknowledgments
None.
Author contribution
-
• JS contributed substantially to the design of the work, interpretation of data for the work, drafting the work critically for important intellectual content, final approval of the version to be published, and agreement to be accountable for all aspects of the work in ensuring that questions related to the accuracy or integrity of any part of the work are appropriately investigated and resolved.
-
• RS contributed substantially to the acquisition, analysis, and interpretation of data for the work, reviewing the work critically for important intellectual content, final approval of the version to be published, and agreement to be accountable for all aspects of the work in ensuring that questions related to the accuracy or integrity of any part of the work are appropriately investigated and resolved.
-
• MAP, MW, REW, AD, MK, PKL, TLH, SSK, DDR, AMP, MZ, and ACH contributed substantially to the interpretation of data for the work, reviewing the work critically for important intellectual content, final approval of the version to be published, and agreement to be accountable for all aspects of the work in ensuring that questions related to the accuracy or integrity of any part of the work are appropriately investigated and resolved.
-
• MBR contributed substantially to the design of the work, interpretation of data for the work, reviewing the work critically for important intellectual content, final approval of the version to be published, and agreement to be accountable for all aspects of the work in ensuring that questions related to the accuracy or integrity of any part of the work are appropriately investigated and resolved.
Financial support
Support provided by grant R01HS028633 from the Agency for Healthcare Research and Quality.
Competing interests
No conflicts exist for the specified authors. The funding sources had no role in the design and conduct of the study; collection, management, analysis, and interpretation of the data; preparation, review, or approval of the manuscript; or decision to submit the manuscript for publication. The views expressed are those of the authors and do not necessarily represent the official views of the National Institutes of Health, or the U.S. Department of Health and Human Services.
Guarantor statement
Michael B. Rothberg is the guarantor of the content of the manuscript, including the data and analysis.
Ethical statement
Institutional Review Board of the Cleveland Clinic Foundation, Federalwide Assurance #FWA00005367, IRB approval number: #21-863.



 Open access

