Nomenclature
- AMC
-
Acceptable Means of Compliance
- CS
-
Certification Specifications
- EASA
-
European Union Aviation Safety Agency
- EOS
-
Equation of State
- FAA
-
Federal Aviation Administration
- FAR
-
Federal Aviation Regulation
- FEA
-
Finite Element Analysis
- UAS
-
Unmanned Aerial System
Symbols
- A,B,C,n,m
-
Johnson-Cook strength model parameters
- d1,…,d5
-
Johnson-Cook failure model parameters
- c0, S,
 ${\gamma _0}$
-
Mie-Grüneisen equation of state parameters
- E
-
Young’s modulus
- Et
-
Tangent modulus
- h
-
height
- l
-
length
-
$m$
-
mass
- r
-
radius
-
$V$
-
Volume
-
${\varepsilon _{max}}$
-
strain at fracture
-
${\varepsilon _0}$
-
reference strain rate
-
$\nu $
-
Poisson’s ratio
-
$\rho $
-
density
-
$\sigma y$
-
Yield stress


1.0 Background
In the past, collisions with birds have led authorities to impose regulation on so-called ‘wetted’ areas. These are the areas of an aircraft in the direction of flight. Regulations on ‘wetted’ areas are listed in the European Union Aviation Safety Agency (EASA) Certification Specifications (CS) and Acceptable Means of Compliance (AMC) for Large Aeroplanes (CS-25) [1]. The requirements pertaining to a bird strike are listed in CS 25.631 ‘Bird strike damage’ and AMC 25.631 for impact with a four-pound bird. The Federal Aviation Administration has comparable regulation in place documented in Federal Aviation Regulation (FAR) [2]. For bird impact the relevant requirements are documented in FAR 25.571 for wing leading edge and engine, in FAR 25.631 for leading edge empennage, and in FAR 25.775 for windshields and windows. A decade ago, an EASA study [Reference Dennis and Lyle3] concluded that the bird strike requirements as documented in CS-25 are providing an adequate level of safety.
Unmanned Aerial Systems (UASs) are increasingly starting to dominate lower airspace. This increases the chance that a UAS will hit the means of transport of people e.g. aircraft, helicopters. For air traffic, the UAS threat becomes apparent as authorities such as EASA have begun to report threat occurrences in annual safety reports (e.g. [4]). At present (2019), the number of incidents recorded with UASs is higher than incidents recorded with bird/wildlife strike. Such findings are reported in earlier studies as well [Reference Sharma5], showing an increasing trend in UAS-related events.
Current research [Reference Radi6] suggests that aircraft wetted-areas (e.g. wing leading edge) that are certified for so-called ‘bird-impact’ may not sustain a ‘UAS-impact’. Further insight was obtained with ground tests carried out by the department for Transport, the Military Aviation Authority and the British Airline Pilots’ Association [7] on a helicopter windshield to replicate UAS impact. In addition, a simulation model for UASs was made to carry out impact simulations on helicopter windshield and tail rotor. More recently, ground tests have been commissioned by the National Research Council CANADA [8] where a commercial drone was impacted on a windshield and a leading edge under various approach conditions. This study confirmed the severe damaged caused by drone impact on windshields and leading-edge structures.
As a response to the concerns that impact of a drone might be more severe than a bird impact, EASA formed a ‘drone collision’ task force [9] and the FAA formed an Alliance for System Safety of UASs through Research Excellence [10] to assess the impact of UASs with aircraft collision through development of UAS analysis models and laboratory testing. EASA and FAA are in the process of determining the threat of a UAS impact on aircraft via extensive research programs. The FAA recently concluded an extensive program called UAS Airborne Collision Severity Evaluation [10]. In this program, relevant components of UASs were identified, damage level categories defined, and collision scenarios specified [Reference Olivares11]. Among several other studies, quadcopter UAS [Reference Olivares12] and fixed wing UAS [Reference Olivares13] numerical models were developed and an extensive impact testing campaign was launched to calibrate the numerical simulation models. Different collision scenarios were studied and the severity of impacts were categorised. These studies concluded that UAS collisions may introduce severe damage to aircraft structures. In recent work [Reference Drumond, Greco and Cimini14], design changes necessary for a wing leading edge to sustain a UAS impact have been studied, showing the weight penalty on an aircraft structure when adapted to better survive damage from a UAS collision. The threat to helicopter windscreens due to a collision with a quadcopter is simulated in [Reference Jonkheijm15] together with a detailed outline of a quadcopter numerical simulation model. Currently (2020), EASA is running a program called Vulnerability of Manned Aircraft to Drone Strikes [Reference Austen, Lord and Bridges16] to determine the threat of UAS collisions.
In the event of multiple UASs flying deliberately close formation such as reported in an incident at Gatwick Airport [17], authorities are forced to ground flights. The costs of such a closure incident is estimated to be significant [Reference Calder18]. In a more recent study [Reference Wendt, Voltes-Dorta and Suau-Sanchez19], an analysis is carried out to estimate whether the cost of a defence system outweighs the costs of shutting down an airport. However, a defence system may not be fully effective, and closing an airport is undesirable. So, what would happen to an aircraft wetted zones in case of multiple UAS impact? To the authors’ knowledge, the damage multiple UAS impacts have on a wing leading edge has not yet been fully established.
To investigate the impact of a multiple UAS strike on the wing leading edge and front spar, a so-called UAS impact model is created. Relevant components for the impact are modelled and the impact is compared with literature findings. This UAS model is then impacted onto a wing leading edge that is sized to withstand a bird impact. Following the single-UAS impact simulation, results of multiple UAS impacts are presented. Finally, conclusions and recommendations for further research are given.
2.0 Methodology
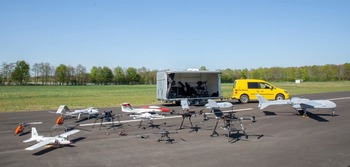
Commercial UASs come in various configurations and sizes, see e.g. Fig. 1.
UASs come in many forms and sizes. An overview of some of NLR’s in-house UASs. Image - Royal NLR.

Several divisions exist in the literature for the categorisation of UASs. In the present work the authors follow a division that was used by EASAs ‘Drone Collision’ Task Force for readily available consumer UASs [9] weighing less than 5kg. According to the EASA this category represents the majority of commercially available UASs [20]. The two main categories considered in this work are:
-
1. Quadcopter UAS
-
a. Tiny (0.25kg, harmless)
-
b. Small (0.5kg)
-
c. Medium (1.5kg)
-
d. Large (3.5kg)
-
-
2. Fixed wing UAS
-
a. Up to 3.5kg (single category)
-
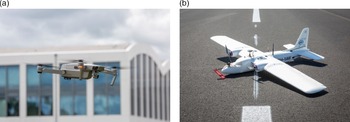
As an example of a quadcopter UAS and a fixed-wing UAS, Fig. 2 shows in the left image a UAS quadcopter that requires rotors to stay in the air and on the right image a fixed wing UAS that more resembles a conventional aircraft.
(a) Example of a quadcopter UAS and (b) an example of fixed wing UAS. Image- Royal NLR.

Small UASs (below 0.5kg) are expected to cause no damage to the aircraft wetted zones [9], and the large UASs are expected to cause significant damage. This expectation is supported by results reported in literature for quadcopter UASs (e.g. [Reference Olivares12]) and fixed-wing UASs (e.g. [21]).
Of particular interest is the medium-sized UAS, because the impact energy is close to that of a bird impact for which design regulation is already in effect. Bird impact studies are typically carried out with a four-pound bird (roughly 1.81kg) or equivalent gel impactor in accordance with CS 25.631 [1]. Research (e.g. [Reference Olivares11]) suggests that the hard components of a UAS such as the battery and motors will cause observable damage to certified areas at lower impact speeds.
Because a UAS consists of individual parts with different strength and stiffness properties, the complete UAS modelling is lumped into three categories of component densities, in order to reduce the number of components in the model (see e.g. [20]).
-
1. Frangible and low-density housing
-
2. Infrangible and medium-density media such as the battery package
-
3. Sharp high-density objects such as the motor
In addition to these three component categories, payload items need to be considered when modelling the UAS. Typically, consumer UASs are outfitted with a camera, therefore, we also consider a payload consisting of a photo/video camera commonly used for making pictures or recordings.
2.1 UAS dimensions
A common consumer UAS model, the DJI Phantom 3, was identified as representative for this study in order to obtain results comparable to previous studies (e.g. [Reference Olivares12], [Reference Drumond, Greco and Cimini14], [Reference Jonkheijm15] or [Reference Yu22]). Furthermore, the authors had access to a similar physical model making it relatively easy to determine size and weight of components.
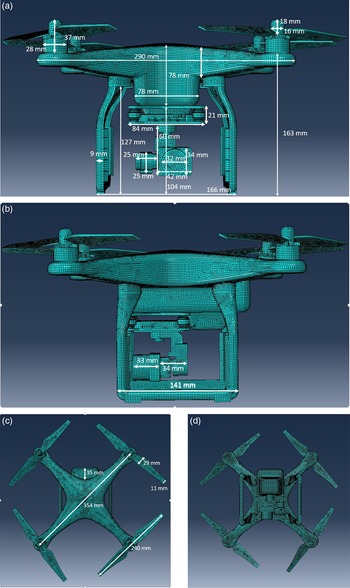
The Finite Element (FE) discretisation of the UAS and its relevant housing and component dimensions including the diagonal distance = 354mm used in the UAS FE model are shown in Fig. 3.
(a,b,c,d) Different view angles of the UAS model used for the impact studies. Some overall dimensions are shown to give an impression of size and location of components with respect to each other.

The FE mesh density is set to 2mm, which produces accurate results according to a mesh density study by Jonkheijm [Reference Jonkheijm15]. A total of 77,487 nodes are used to describe the UAS battery, camera, motors, housing and propellers. The total number of elements is 76,516, of which 1,400 are solid elements, the remainder being shell elements.
2.2 UAS housing and propellers
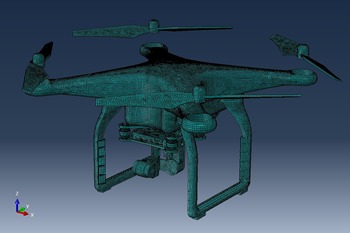
To simplify the modelling of the UAS housing, not all components are modelled separately. Instead, the UAS housing is constructed as a single body. Furthermore, this body is then meshed via mid-surface modelling using S4R shell elements in Abaqus [23]. Each shell element is assigned a thickness and an offset. To simplify the modelling, the thickness is set as a uniform parameter and the offset used is the external geometry of the UAS. In addition, the propellers are modelled via mid-surface modelling with S4R elements and are given the same thickness and material properties as the UAS housing. Clearly this is different from the thickness of components of the physical model. However, as these parts are considered frangible the impact damage is not expected to significantly change. The housing and propellers are shown in Fig. 4.
In the FEA model, the skin thickness of the UAS housing is adjusted so that the weight of the UAS housing and propellers combined correspond to a total mass of 617.6g. For the present simulation model this corresponds to a skin thickness of 2.29mm for housing and propellers. The weight of 617.6g is determined by taking the total UAS weight from literature (1216g) and subtracting the battery (343g), motors (4 × 50.7g) and camera (52.6g).
The UAS housing material is analogous to previous work (e.g. [Reference Jonkheijm15] or [Reference Drumond, Greco and Cimini14]) and consists of polycarbonate material. An elastic-plastic material model and ideal plasticity was assumed to model the mechanical behaviour of the housing. Progressive damage was modelled using maximum tensile strain as the parameter following the onset of material degradation. Furthermore, elements are removed once a maximum degradation of 0.95 is reached. The material properties are taken from Drumond [Reference Drumond, Greco and Cimini14] and Jonkheijm [Reference Jonkheijm15] and listed in Table 1 for completeness.
Mechanical properties of polycarbonate [Reference Drumond, Greco and Cimini14], [Reference Jonkheijm15]

Discretized Finite Element model using shell elements for the UAS housing including the propellers.

2.3 Battery package
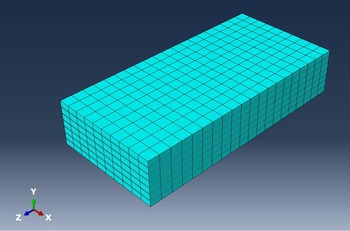
The battery package is modelled as a solid consisting of seven individual battery cells (15.2V pack), see Fig. 5. The cells were meshed via solid elements C3D8R in Abaqus. Each cell is 3mm thick, 58mm in width and 120mm in length. The distance between each battery cell is 0.5mm. Contact between the cell layers is modelled via a penalty formulation with a 0.2 friction coefficient in tangential direction and so-called hard contact in normal direction.
Discretized Finite Element model of the battery package of the UAS consisting of seven battery cells modelled with solid elements.

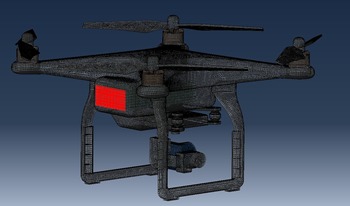
The battery package is attached to the UAS housing via so-called tie constraints on the back of the UAS. The surface area where the battery adjoins the housing is marked red in Fig. 6.
Discretized Finite Element model of the UAS. The battery is attached to the UAS housing via so-called tie constraints. The surface where the nodes are tied between the housing and the battery is indicated in red.

In previous studies ([Reference Drumond, Greco and Cimini14], [Reference Jonkheijm15]), lithium-ion batteries were modelled as a crushable foam. In the present study the batteries are considered to behave as an elastic-plastic material using a ductile damage model. Element elimination is set at maximum degradation of 1.0. The battery dimensions are based on in-house measurements of a UAS battery pack. Density of the battery material is then adjusted to facilitate comparison with literature findings (343g battery) and in-house measurements (438g battery). The material properties used are listed in Table 2.
Material properties for the 343g and 438g UAS battery pack

Material properties of the UAS motor consisting of Steel Alloy AISI4130 [Reference Rice24]

2.4 Motor
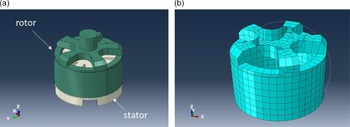
The UAS motor was modelled using a mid-surface modelling technique. To simplify the modelling, the motor geometry was reduced to the external surface of the motor caps. These caps were given the equivalent density of the rotor and core stator, see Fig. 7.
(a) The stator and rotor of the UAS motor. (b) Discretized Finite Element model (2D shell) of the motor casing using mid-surface technique.

The weight of each motor is taken analogous to [Reference Drumond, Greco and Cimini14], [Reference Jonkheijm15] and corresponds to 50.7g for each motor. The skin thickness of the shell elements is calculated to be 2.755mm, based on the density listed in Table 3.
A steel alloy AISI4130 [Reference Rice24] for the UAS motor is considered in this work, and relevant material properties are listed in Table 3. The material is modelled as a bi-linear elastic plastic material. Element deletion was used with criteria for element deletion to correspond to the maximum tensile strain value.
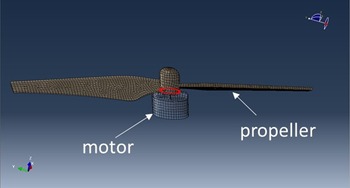
The motors move along with the UAS housing in the same direction as the UAS and are connected via a contact definition. In tangential direction this is done via a penalty formulation with a friction coefficient of 0.2 and in normal direction via so called hard contact. The propellers are connected directly to the motors via node connectivity, see Fig. 8.
Discretized Finite Element model of the UAS motor (grey) and the propeller (brown). The propeller is connected to the UAS motor. The shared nodes are highlighted in red.

2.5 Payload
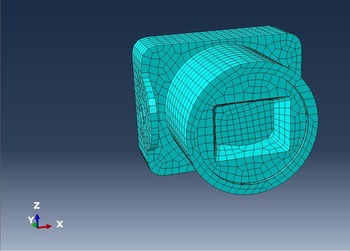
The UAS payload in this study consists of a standard camera, see Fig. 9. The outer dimensions of the camera are 32.6mm × 42mm × 34mm. Material properties are taken from literature [Reference Rice24]. The camera is modelled using a mid-surface model with shell elements on the outer contour of the camera geometry. The thickness assigned to the shell element mesh is adjusted so that the mass of the camera corresponds to the mass used in literature (52.6g). The corresponding thickness assigned to the shell elements is 2.935mm.
Discretized Finite Element model of the UAS payload. Here the UAS payload consists of a camera.

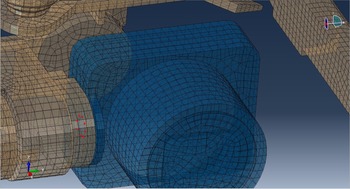
The camera is attached to the UAS housing via shared nodes. These nodes are highlighted in red in Fig. 10.
Material properties for the camera are taken from literature. For completeness these are listed in Table 4.
The camera housing is modelled via a bi-linear elastic plastic material model with element deletion criteria. The criterion for element deletion is the maximum tensile strain value.
3.0 Reference impact examples
The modelling strategy outlined in the previous section is compared with results from literature. First, numerical simulations of the battery, motor and camera impact tests on an aluminium plate with different thickness were performed. Second, a leading edge that is sized for bird impact is modelled to simulate the impact of a UAS onto a leading edge.
3.1 Target: Aluminium plate
The numerical model of the UAS components is compared to impact results recorded in literature. This is done to compare overall impact behaviour of each components numerical model with that of an actual controlled-impact experiment. The ballistic impact studies to which the simulation results were compared are recorded in [Reference Olivares12]. Simulation results of these impact tests by other authors are documented in [Reference Drumond, Greco and Cimini14] and [Reference Jonkheijm15]. First the target model is discussed, followed by presentation of the results of the numerical impact tests.
Material properties for the payload consisting of a camera. The camera housing consists of Aluminium Casting alloy A520.0-F [Reference Rice24]

Material properties for Aluminium 2024-T3, see [Reference Kay25]

Finite Element model of the camera and UAS housing. The camera is attached to the UAS housing. The shared nodes are highlighted in red.

3.1.1 Numerical plate model
An aluminium plate with dimensions 890mm × 890mm is modelled with thicknesses of, respectively, 1.6mm and 6.35mm, in accordance with [Reference Olivares12]. The material properties for the aluminium plate are taken from [Reference Kay25] and are listed in Table 5.
The Aluminium alloy 2024-T3 is modelled as an elastic-plastic material with Johnson-Cook plasticity model. The necessary material parameters are taken from [Reference Kay25] and are listed in Table 6.
Failure of the aluminium plate is modelled via Johnson-Cook dynamic failure model, which is available in Abaqus [23]. The necessary material parameters are listed in Table 7.
Element deletion is applied, with elements being deleted upon reaching maximum degradation. The plate is meshed with shell elements (S4R elements, 2×2mm mesh density) in Abaqus, which is found to be sufficiently accurate (as explained in the next section). Contact between the target (plate) and projectile (e.g. motor) is modelled using the built-in Abaqus interaction procedure. The interaction properties are selected as ‘hard contact’ (separation after contact) in the normal direction, and in the tangential direction, a penalty formulation with a 0.2 friction coefficient with no-slip condition is applied.
Input material parameters for the Johnson-Cook plasticity model, see [Reference Kay25]

Input parameters for the Johnson-Cook dynamic failure model, see [Reference Kay25]

3.1.2 Results of impact simulations
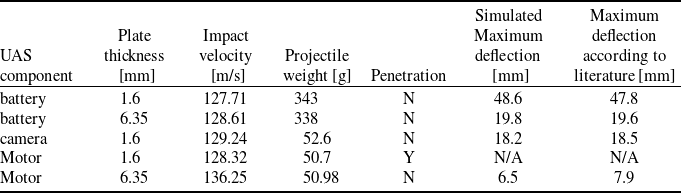
The impact simulation studies are performed on plates with different thicknesses of, respectively, 1.6mm and 6.35mm. The projectile velocity, the projectile weight, and the deflection of the plate, are taken from literature references and compared with the results of the simulations, the results of which are listed in Table 8.
Results of the UAS component impact simulations compared to literature findings [Reference Olivares12]

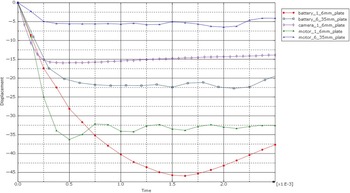
The results agree well with the results recorded in the literature. History of maximum deflection of each plate during impact simulation is shown in Fig. 11.
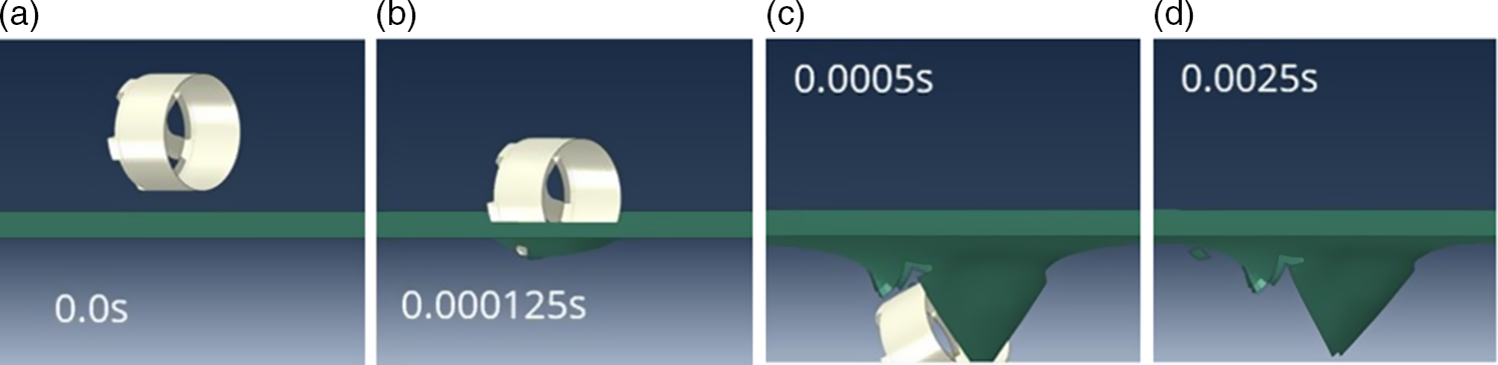
Note that the distance between the UAS component and the plate was not equal for each simulation. Hence, the exact moment of impact of each component differs slightly on the horizontal axis as seen in Fig. 11. For the maximum deflection results recorded in Table 8 this has no effect. Furthermore, at maximum deflection of the plate with thickness of 1.6mm the motor penetrates the skin and the displacement resembles that of the torn skin. The skin penetration is shown in Fig. 12 where the motor impact is plotted at different time steps.
The high motor density is likely the cause of the penetration of the skin. The numerical results agree with the experimental results recorded in literature.
3.2 Target: Leading edge
To study the effect of a ballistic impact of a UAS onto a leading edge, first a leading-edge design is necessary that is at least able to withstand a bird impact. In the work of McNaugtan [Reference McNaughtan26] an empirical equation is given for the preliminary design of aluminium leading edges. In this work an approach analogous to [Reference Drumond, Greco and Cimini14] is followed to determine the necessary skin thickness via FEA.
Material properties for Aluminium 7050_T7451 [Reference Rice24]

Maximum displacement of the plate during impact. Each line corresponds to a different component of the UAS and/or different thickness of the plate (see legend).

(a,b,c,d) Simulation results of the motor component penetrating the 1.6 [mm] aluminium plate at different time steps in seconds [s].

3.2.1 Leading edge numerical model
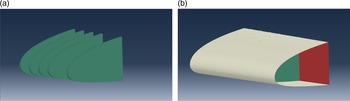
In this work, the skin thickness of the leading edge is determined via simulation of the bird impact. The skin is considered thick enough if no penetration or skin tearing is observed in the simulation results. The rib flanges are connected with kinematic constraints to the leading-edge skin and spar. The thickness of ribs and spar is taken to be 2mm and not tuned further. Analogous to the work of [Reference Drumond, Greco and Cimini14], Aluminium 7050_T7451 is taken for the ribs and spar. The material properties are listed in Table 9. The leading-edge model is shown in Fig. 13.
Comparison between literature values [Reference Walvekar29] and our simulation results for the bird impactor impacting an aluminium plate

(a): Ribs that are included in the leading edge design. (b): The skin, rib (green) and spar (red) combined into a leading edge model.

For the skin the material, Aluminium T2024-T3 is chosen, and the skin thickness is then adjusted to be able to withstand the bird impact as discussed in the next section.
3.2.2 Projectile: Bird impactor
A bird impactor model can be created analogous to the work of e.g. Riccio [Reference Riccio, Cristiano and Saputo27]. Such a bird impactor model can be used to support the certification process against bird impact. In the present work a cylindrically shaped projector with rounded ends was assumed. The volume V corresponds to Equation 1.
 \begin{align}V = \pi {r^2}h + \frac{3}{4}\pi {r^3},\;\;where\;l = h + 2r,\;\;\;\frac{l}{{2r}} = 2.0\end{align}
The mass of the bird is calculated as
 $m = \rho V$
. Hence, with radius v = 57mm, length
 $l$
= 228mm and height
 $h$
= 114mm, the density
 $\rho $
= 934 kg/m3, resulting in a weight of
 $m$
= 1.81kg (four pounds). Furthermore, for this bird impactor model, the Abaqus equation-of-state Mie-Grüneisen (Us-Up) is used, relating pressure, temperature, and volume to compute the mechanical volumetric strength of the material. A discussion parameters selection for these equations is given in [Reference Segletes28]. The settings chosen for this work are c0 = 1482.9 m/s, s = 2, Gamma0 = 0. The bird impactor is meshed with 4,340 solid elements, which are then converted to particles using the Abaqus ‘Smoothed Particle Hydrodynamics’ modelling feature. The impactor is converted to an SPH particle model on impact.
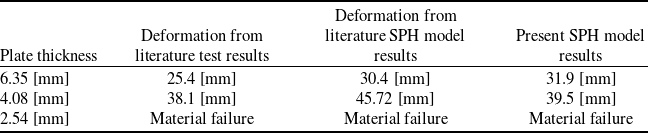
The bird impactor is compared against simulation results listed in [Reference Walvekar29] for a flat Aluminium 7075-T6 plate of dimensions 609.5mm in width and 914.4mm in height. For the bird impactor of 1.81kg at a velocity of 136 m/s (265 knots), the computed plate deformation is listed in Table 10 together with the results recorded in literature [Reference Walvekar29].
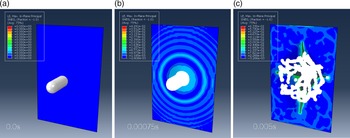
The plate simulation result for a plate thickness of 2.54mm for which material failure was observed is shown in Fig. 14.
(a,b,c) Bird impact on a flat aluminium 7075-T6 plate of 2.54 mm thick. Strain contour plotted at three different time steps indicated in seconds (s). The plate has a thickness of 2.54 [mm by 609.5 mm width by 914.4 mm height].

3.2.3 Leading edge sizing for bird impact
To determine the skin thickness of the leading edge, the bird impactor is placed between two ribs with respect to the leading edge, as shown in Fig. 15. The speed of the bird impactor is chosen to be 127 m/s (250 knots). This speed is motivated by the choice of impact speed for the UAS which is the difference between UAS speed and aircraft speed. The type of UAS considered in this work reaches a maximum speed of 20 m/s and the aircraft speed (107 m/s) is taken as the maximum speed for a holding phase on a flight below 1829m (6,000 feet) (derived from paragraph 5-3-8-j.2 (a) of the Aeronautical Information Manual [30]).
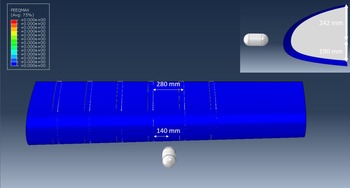
Frontal and side view of the leading edge and bird impactor. Position of the bird impactor (grey) is chosen in between two ribs.

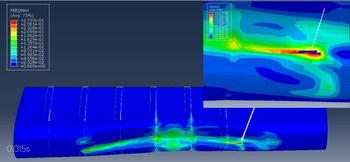
As an initial value for the skin thickness a value of 1.5mm is selected. The maximum PEEQ strain computed for this impact simulation is shown in Fig. 16.
Frontal view of the leading edge after impact. Skin rupture for a skin thickness of 1.5mm after impact of the bird impactor at the location marked with the arrow at timestep 0.015 s. PEEQmax (plastic) strain [dimensionless] in the skin are above the material failure limit and skin tearing has taken place.

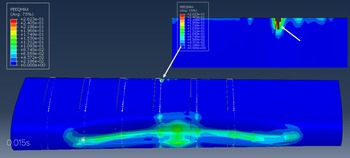
As can be seen in Fig. 16, skin tearing takes place after impact and therefore the skin thickness has to be adjusted for. The maximum PEEQ strain for the second attempt simulation with a skin of 2mm thick is shown in Fig. 17.
Frontal view of the leading edge after impact. Skin rupture for a skin thickness of 2.0 mm after impact (timestep 0.015 s) of the bird impactor at the location marked with the arrow. PEEQmax (plastic) strain in the skin is beyond the material failure limit, indicating that skin tearing has taken place.

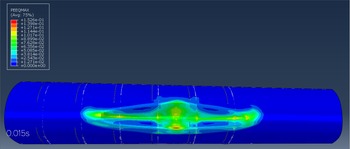
The skin of 2mm thick shows skin tearing at the connection with one of the ribs. Therefore, the skin thickness is adjusted once more to 2.5mm. For the present leading-edge geometry, a skin thickness of 2.5mm is sufficient to withstand the bird impact under the simulated conditions in this work. This is seen in Fig. 18 where the PEEQmax strain (plastic strain) of the impact is shown.
Frontal view of the leading edge after impact. Skin impact result for impact with skin thickness 2.5mm at timestep 0.015s. PEEQmax (plastic) strain [dimensionless] in the skin are below the material failure limit.

Thus, no skin tearing or penetration of the skin has taken place for a skin thickness of 2.5mm. This skin thickness is used for the leading edge for the remainder of the simulations.
4.0 Results leading edge impact UAS
The leading edge for which impact with a bird impactor was simulated in the previous section is now targeted with the UAS impactor. First a single UAS is impacted on the leading edge for three different UAS weights. Next, a multiple UAS impact is simulated for three UASs impacting the leading edge. Finally, a summary of the findings is presented.
4.1 Results: Ballistic impact single UAS
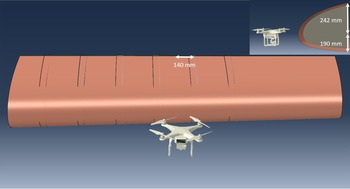
The UAS position with respect to the leading edge is chosen so that the centre of mass of the UAS matches the centre of mass of the bird impactor simulation, see Fig. 19.
Positioning of the UAS with respect to the leading edge. The battery inside the UAS is located at the same position as the bird impactor.

4.1.1 UAS 1.2kg
The total mass of the UAS is 1216g and the weight of components is taken analogous to previous studies [Reference Drumond, Greco and Cimini14]. Hence, the mass is computed as 4 times 50.7g for motors, camera of 52.6g and battery of 343g. The remainder for the other components is: 617.6g. This weight is assigned to the UAS body, gimbal and propellers. The speed of the UAS is taken as 127 m/s (250 knots). This speed is motivated by the difference between UAS maximum speed and aircraft maximum speed. The type of UAS considered here reaches a maximum speed of 20 m/s and the aircraft speed (107 m/s) is taken as the maximum speed for a holding phase on a flight below 1829 m (6,000 feet), as derived from paragraph 5-3-8-j.2 (a) of the Aeronautical Information Manual [30]. The same impact speed and motivation is recorded in other research as well (see e.g. [Reference Olivares12] and [Reference Drumond, Greco and Cimini14]).
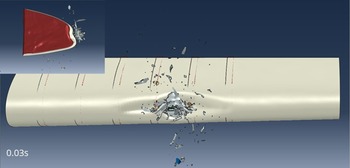
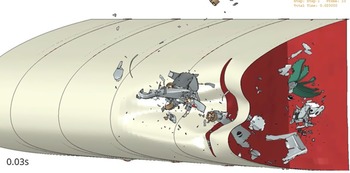
The impact result is shown in Fig. 20, where the UAS has impacted the leading edge. The close-up shows that no components have entered the leading-edge section.
Deformation of the leading edge after UAS impact at timestep 0.03s, showing that no components have entered the leading edge.

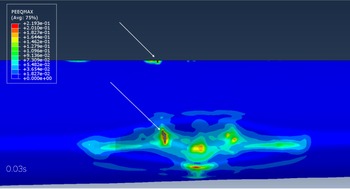
Skin tearing has taken place along the connection of skin and rib due to the large strains that are a result of the impact of the UAS, as shown in Fig. 21.
Contour plot of PEEQmax plastic strain at time step 0.03s. The white indicators highlight the skin rupture where material failure has taken place. The image shows only the leading edge skin (other components are deliberately blurred).

4.1.2 UAS 1.4kg
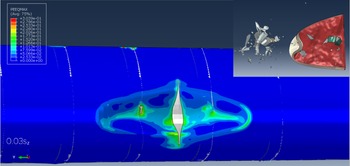
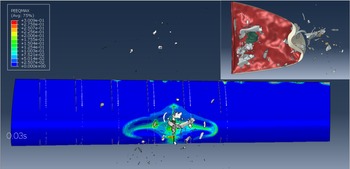
The UAS model that the authors had access to was weighed on a scale, and the battery turned out to be slightly heavier than what was reported in the literature [Reference Drumond, Greco and Cimini14] and [Reference Jonkheijm15]. To see the effect of a heavier battery (438g versus 343g) the analysis was repeated with the heavier battery. In Fig. 22 the damage caused by the impact is shown via a plot of PEEQmax strain and the skin tearing is clearly visible.
Contour plot of PEEQmax strain and tearing of the skin after UAS impact with a heavier battery at time step 0.03s. Skin tearing has taken place on the location of impact and next to the rib. On the top side of the leading edge where the skin is connected to the spar, skin rupture is also observed.

Skin tearing takes place and some of the UAS components enter the leading edge. Most noticeably it is the battery pack that has punctured the leading edge. Some of the battery cells are still largely intact. Hence, post-impact short circuiting may pose a threat, although that aspect is not further investigated as part of this work.
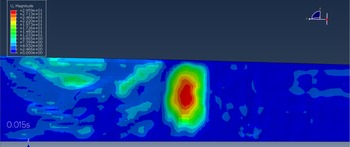
To show the deformation caused by the impact of the components (those that enter the leading edge) on the front spar, the leading-edge deformation is plotted in Fig. 23.
Maximum displacement of the spar due to the impact of the battery at time step 0.015s.

Figure 23 shows that the maximum displacement during the impact is approximately 30mm. Furthermore, no plastic deformation was computed. For this simulated impact no penetration or material failure of the front spar was computed.
4.1.3 UAS 1.8kg
To compare the impact of the UAS with the bird impactor the weight of the UAS is increased by multiplying all densities of the materials of the UAS by the same factor to arrive at a total weight of 1.81 kg. This is equivalent to the approaches documented in other literature [Reference Drumond, Greco and Cimini14], [Reference Jonkheijm15]. The flight path is kept the same with respect to all previous impact simulations. The PEEQmax strain of the impact of the 1.81kg UAS on the deformed leading edge is plotted in Fig. 24.
Contour plot of PEEQmax strain [dimensionless] of the 1.81kg UAS impacting the wing leading edge. A large tearing of the skin is visible at the location of impact at timestep 0.03s.

Tearing of the skin is visible and part of the UAS has entered the wing leading edge. The components that enter the leading edge are made visible with a cut-out of the impact section as shown in Fig. 25.
The image shows a cut-out of the wing leading edge where the UAS enters the structure at timestep 0.03s. The battery pack (green) has entered the wing and loose cells are still partially intact.

The battery package (green) has entered the wing leading edge. In the current model the package of loose cells is partly intact. Therefore it would be of future research interest to further detail the battery model to include electric-thermal properties and determine if this poses additional risk on the structure. Furthermore, the result shows that the current FEA approach is a good means to track components of the UAS. For example. the brown-coloured motors are still identifiable.
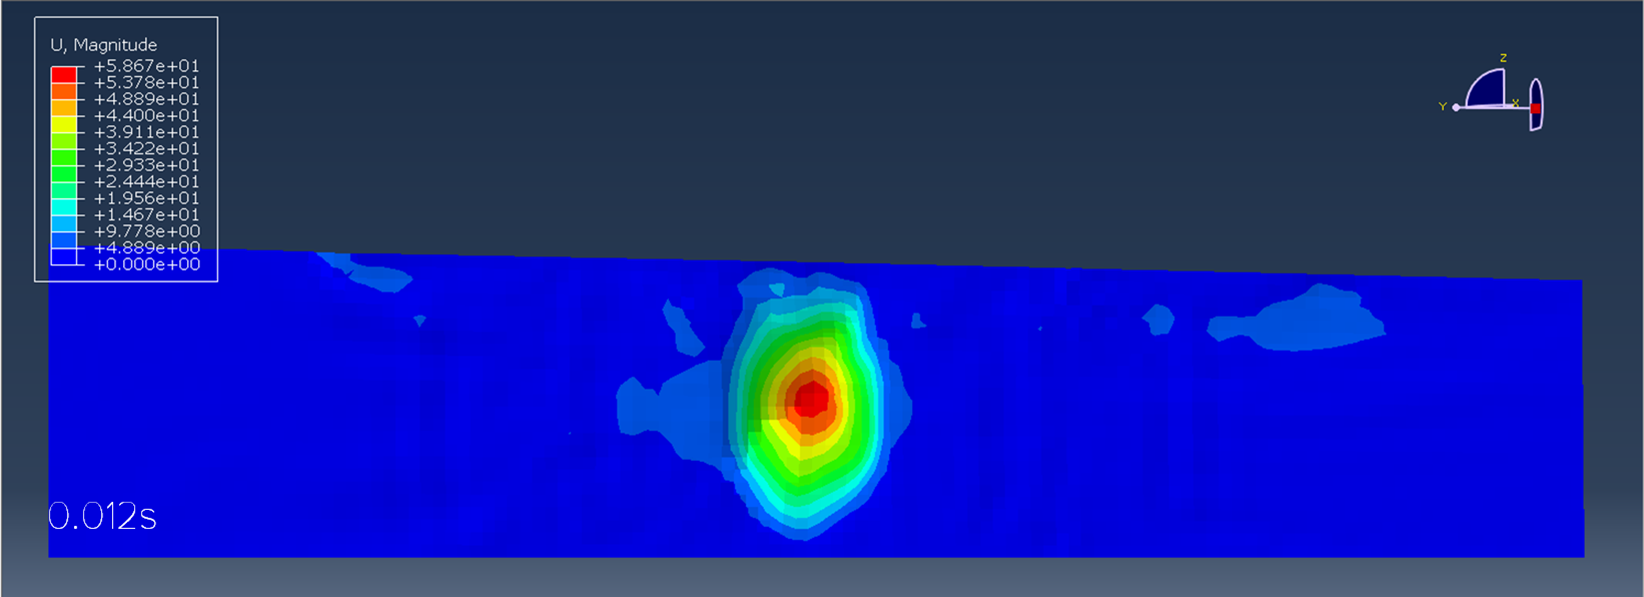
The components that have entered the leading edge and impacted the front spar did not fully penetrate the front spar. The maximum displacement calculated for the front spar is shown in Fig. 26.
Front spar maximum displacement mm contour plot at time 0.012s after impact with the components of the 1.8kg UAS.

Maximum displacement is 59mm and no plastic deformation was computed. For this simulated impact the front spar was not penetrated. Hence, the impact of a single UAS causes the front spar to deform but no substantial material failure is observed for the cases considered in this work.
4.2 Results: Ballistic impact multiple UAS
The effect of a multiple UAS impact is modelled using the previously introduced leading edge with multiple duplicates of the UAS model.
4.2.1 UASs 1.2kg
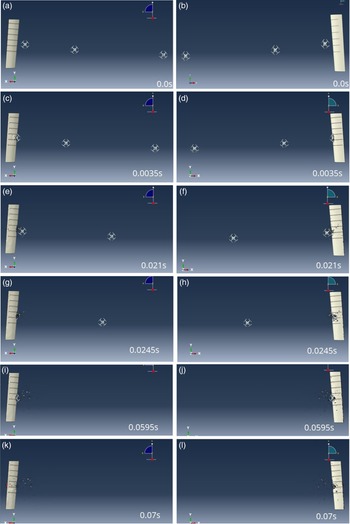
In the present study, three UASs of 1.2kg each are impacted on the leading edge in close sequence, one at a time. Although many combinations of impact scenarios are imaginable, a sample scenario is selected where all three UASs strike the leading edge in between the same ribs. Furthermore, the distance between the UASs is chosen such that the skin has largely absorbed the impact from one UAS before the second UAS strikes. In this case the distance between UAS 1 and UAS 2 is 2.5m and the distance between UAS 2 and UAS 3 is 4.5m. In addition, the UASs are positioned to strike the leading edge so that they do not bounce off, but are instead absorbed into the leading edge. At least the battery of the UAS has to hit the leading edge or spar to be able to compare a multiple impact scenario with a single impact scenario. Finally, the second and third UAS encounter debris of the first and second UAS whilst impacting the leading edge. This reduces the impact effect of the second and third UAS on the leading edge but the significance of this reduced effect on the impact on the leading edge and spar is not further investigated.
In Fig. 27 the three UASs are shown together with the leading edge at several time steps through the simulation from both the top view (left) and the bottom view (right).
Top view of the multiple UAS impact simulation setup at different timesteps s. The three UASs are aligned with respect to the leading edge to impact in between the same ribs.

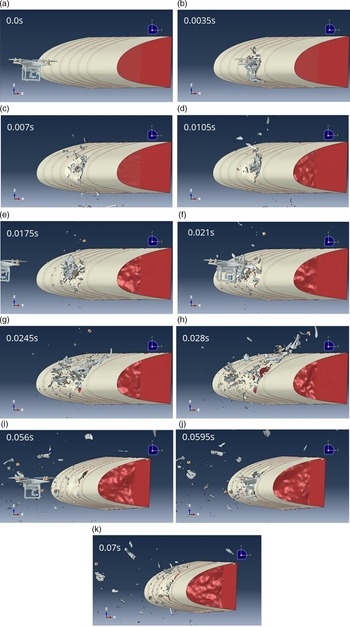
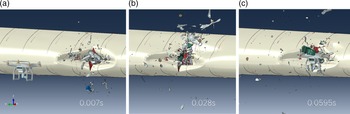
A closer look at the location of impact of the UASs is shown in Fig. 28.
Side view of the leading edge showing the sequence of events of the three UASs impacting the leading edge.

As can be seen in Fig. 28, the first UAS impacts the wing in the same way the single UAS impact was modelled. The second UAS impacts near the same location, but some debris moves over the leading-edge skin. The third UAS impacts the wing and is completely destroyed.
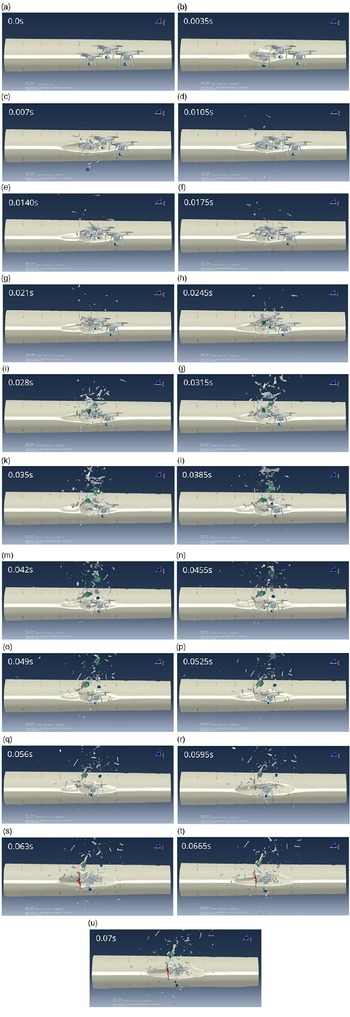
The impact of the three UASs as viewed from the front of the leading edge is shown in Fig. 29.
Front view of the leading edge showing the sequence of events of the three UASs impacting the leading edge.

Figure 29 shows the impact location from the frontal view of the leading edge. The impact of the first UAS is the same as that of the single UAS impact. The second impact caused by the next impacting UAS is slightly less severe as part of the first UAS is colliding with the second UAS. The third impact causes the leading-edge skin to detach from one of the ribs.
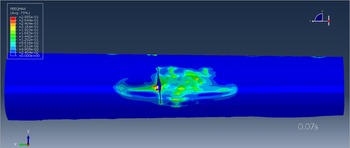
Once all UASs have impacted the leading edge a deformation plot of the damage can be created. In Fig. 30 the PEEQmax strains are plotted on the deformed structure.
Frontal view of the leading edge showing the skin tearing. Colouring corresponds to the PEEQmax (plastic) strain plotted on the geometry.

As compared to the single UAS impact, the skin tearing is larger at the location where it is connected to the rib. In addition, two of the components of the third UAS manage to enter the wing body. The components entering the wing are shown in a cut-out of the leading edge in Fig. 31.
Multiple UAS impact, one UAS motor component (brown) and part of the UAS housing grey of the third UAS have entered into the wing leading edge. Parts of the model view have been cut away to show the leading edge internals.

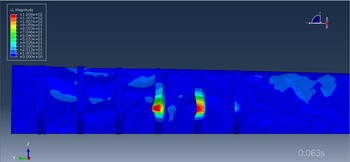
Figure 31 shows that most debris remains outside the wing leading edge. However, one motor from the third UAS and part of the UAS motor housing have entered the leading edge. The maximum deformation that the impact of these components cause on the front spar is shown in Fig. 32.
Maximum deformation [mm] contour plot on the deformed spar and ribs after the third UAS impact.

In Fig. 32 no penetration of components or material failure has been computed for the front spar. The maximum deformation in between the two ribs where the impacts take place is 13mm deflection of the front spar.
4.2.2 UASs 1.8 kg
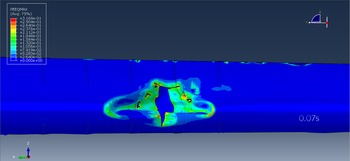
For completeness, three heavier UASs that weigh 1.81kg each are impacted onto the leading edge as well. The resulting impact damage is shown in Fig. 33.
Frontal view of the leading edge after multiple UAS impact. PEEQMax plastic strain contour plot at timestep 0.07s. Skin tearing is observed after a multiple 1.81 kg UAS impact.

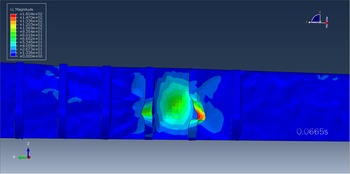
The damage on the leading edge is larger than for the single UAS. The front spar shows a larger deformation than with the 1.2kg drones as shown in Fig. 34. Although the deformation is much larger no material failure is computed and the front spar has not been penetrated with UAS components.
Plot of the deformed spar and ribs showing the maximum deformation mm contour plot after the third UAS impact.

The maximum deformation that is computed between the two ribs due to the impact of the third UAS is 90mm. The sequence of impacts is shown in Fig. 35.
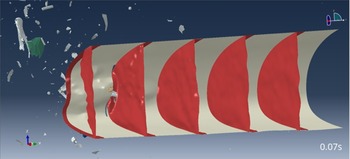
Impact of each individual UAS. From left to right, the first UAS enters the leading edge. The second UAS breaks up and partly enters the wing. The third UAS enters the wing but collides with the debris of the previous UAS components.

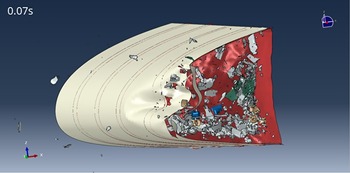
In Fig. 35 the sequence of events is shown of the multiple UAS impact. The first UAS impacts the skin and tears the skin open. The second UAS breaks up, some of the components entering the leading edge and others bouncing off. The third UAS flies into the opening created by the previous impacts but does not stay intact whilst entering the leading edge. The third UAS breaks up as well due to the skin opening being smaller than the size of the UAS. However, most parts of each UAS manage to penetrate the leading edge as can be seen in the cut-out shown in Fig. 36.
Cut-out of the leading edge where UAS components of the three 1.81kg UASs have entered the leading edge section. None of the battery packs (green) appears to be intact after the impact but individual cells are still visible.

The cut-out of the leading edge shows the components of the UASs ending up into the wing leading edge after the impact. None of the components appear to remain intact. Hence, the battery pack used in the present modelling where the battery consists of individual cells is destroyed after impact, although individual cells may still pose a threat in case of electric-thermal behaviour. A different model of the battery such as in [Reference Drumond, Greco and Cimini14] or [Reference Jonkheijm15], where the battery is modelled as a single component, may give different results. A post-impact analysis via e.g. electro-thermal analysis of the battery cells is part of ongoing research by the authors.
4.3 Summary
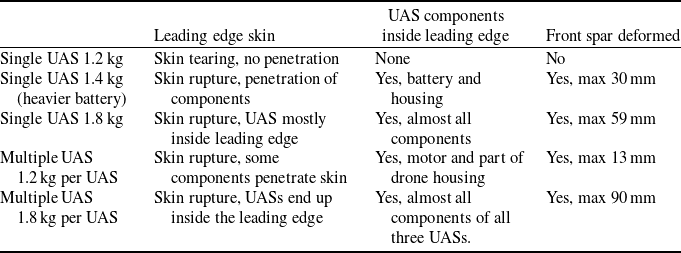
Table 11 summarises the impact condition and the damage observed as a result of the impact studies carried out in this work. Heavier UAS components are shown to penetrate the leading edge and may cause deformation of the spar. When multiple UASs impact in the zone between the ribs, the damage to the leading-edge skin, and the deformation of the spar, are more significant than for a single UAS impact.
Summary of impact studies performed and the damage observed

5.0 Conclusions and recommendations
In this work a UAS model was developed analogous to previous research found in the existing literature. The modelling efforts adopted to model the individual components yield similar ballistic impact results as compared to those that might be expected according to impact tests recorded in the literature.
A preliminary wing leading-edge design was created that sustains a simulated bird impact for the conditions considered in this work. This impact was simulated via an impactor that was created analogous to previous literature reporting. A UAS impact on this leading edge for a reasonably sized UAS showed that skin tearing takes place, indicating the potential for damage to equipment located right behind the wing leading edge. Furthermore, simulations of an impact with a UAS fitted with a heavier battery resulted in the battery penetrating the leading edge. Although the battery was destroyed, individual battery cells were seen to remain partly intact under the modelled conditions in this work. A post-impact analysis of these battery cells, to determine the likelihood and risk of short-circuiting, and the consequences thereof, was however not investigated under the present work.
To show the difference between a bird impact and a UAS impact with the same weight, a heavier UAS was modelled as well. Here significant damage to the leading-edge skin is visible. Furthermore, UAS components are seen to penetrate the wing leading edge, including the battery pack. The battery pack was destroyed upon impact but individual cells appeared to remain intact under the modelled conditions. For all three simulated cases, the front spar deformed due to components that penetrated the leading edge. However, there was no critical material failure computed.
The multiple-UAS impact showed an increase in damage sustained by the leading edge. For the 1.2kg UAS only two components entered the wing leading edge, but for the UAS of 1.81kg all three UASs ended up partly or completely inside the leading edge. All three UASs and their components were destroyed upon impact. For all simulated cases the front spar deformed to a larger extent than with the single-UAS impact. However, no critical material failure was observed in the spar.
For future work, it is recommended to investigate the behaviour of composite wing leading edges in response to UAS impacts. This material behaves differently as compared to metal and the components of a UAS may behave differently during and after impact. Furthermore, it is recommended to investigate the modelling of the battery pack itself. Different modelling approaches could yield different results for both impact on the leading edge and post-impact behaviour. For example, a softer battery may stay intact and may necessitate an electro-thermal analysis to see if the battery short-circuits.
The UAS impact models developed in this study can be used by authorities and the industry to analyse different threat scenarios involving medium-sized UASs. With the developed models, further insight into damage behaviour can be obtained, reducing the dependency on expensive impact testing. Moreover, studies like these can be applied to possible design improvements for aircraft resilience to UAV strikes.