Introduction
Biological control in intensive crops is usually based on the inoculation and/or conservation of predator and parasitoid species to control pests that invade the crop (Albajes & Alomar, Reference Albajes, Alomar, Albajes, Gullino, van Lenteren and Elad1999). In Mediterranean tomato crops, the whiteflies Bemisia tabaci Gennadius and Trialeurodes vaporariorum (Westwood) (Hemiptera: Aleyrodidae) are two of the main pests. They can cause significant reductions in crop yield by either feeding directly on the plant leaves or by producing honeydew, on which sooty mold develops quickly. This mold hampers photosynthesis and respiration, and renders fruits unmarketable. Also, several viruses that severely affect protected vegetable crops worldwide are transmitted by these whitefly species. In particular, B. tabaci transmits the Tomato Yellow Leaf Curl Disease that causes severe crop losses (Gabarra & Besri, Reference Gabarra, Besri, Albajes, Gullino, van Lenteren and Elad1999; Avilla et al., Reference Avilla, Albajes, Alomar, Castañé, Gabarra, Parrella and Heinz2004). In order to control these whitefly species, two polyphagous predators, Macrolophus pygmaeus (Rambur) and Nesidiocoris tenuis Reuter (Hemiptera: Miridae), have been shown to reduce whitefly populations in greenhouses (Albajes et al., Reference Albajes, Sarasúa, Avilla, Arnó, Gabarra, Maredia, Dakouo and Mota-Sanchez2003; Calvo et al., Reference Calvo, Bolckmans and Belda2009). Until recently, M. pygmaeus found on tomato has been misidentified as M. caliginosus Wagner (=M. melanotoma (Costa)) and is still named as M. caliginosus by commercial producers (Martinez-Cascales et al., Reference Martinez-Cascales, Cenis, Cassis and Sanchez2006). Macrolophus pygmaeus and N. tenuis spontaneously colonize Mediterranean tomato crops when spray applications are reduced, and IPM programs based on conservation of these natural enemies are applied (Castañé et al., Reference Castañé, Alomar, Goula and Gabarra2004).
Parasitoids are also used in biological control of whiteflies in protected crops. Abundant naturally occurring populations of Eretmocerus mundus (Mercet) and Encarsia pergandiella Howard (Hymenoptera: Aphelinidae) are also present in IPM tomato crops in northeast Spain (Gabarra et al., Reference Gabarra, Arnó, Alomar and Albajes1999; Arnó et al., Reference Arnó, Matas, Martí, Ariño, Roig and Gabarra2005). Eretmocerus mundus, which is commercially available, specifically parasitizes B. tabaci, while E. pergandiella parasitizes both T. vaporariorum and B. tabaci. Therefore, it is common to find the two whitefly species, the two whitefly parasitoids and the two predator species, in the same tomato crop. The natural enemies may interact with each other and their joint use could either have an additive, positive synergistic or negative effect on the control of pest species. For this reason, the analysis of this food web under natural field conditions is essential if the mechanics of the interactions are to be understood. Better understanding of trophic relationships and the control capacities of the species involved, acting in concert, should allow better strategies to be devised for the optimization of whitefly control.
In field situations, prey choice by predators is not easily quantified by direct observations and is made much more difficult where cryptic species are involved. Apart from direct observation, predation on whiteflies has usually been estimated by counting the remains of whitefly pupae (Castañe et al., Reference Castañé, Alomar, Goula and Gabarra2004), but this measure is the result of the accumulation of predated whitefly pupae over time. When more than one predator is present in the crop, it is impossible to determine which one has consumed the target prey. An alternative approach is to use microscopic examination of gut contents to identify prey remains in predators, but this is only possible if indigestible solid remains are present in the foregut. Many arthropod predators, including the Hemiptera, are fluid feeders, making this approach impossible. In addition, predation on parasitized whitefly nymphs is even more difficult to evaluate because of the difficulty of finding parasitoid early stages, even by dissection.
In recent years, molecular techniques have facilitated the detection of prey remains within predator gut contents, generally by identifying prey-specific protein or DNA sequences (Symondson, Reference Symondson2002). Currently, the most common way to analyze dietary studies of arthropods is by DNA-based gut content analysis using prey-specific molecular markers, which can provide accurate information about which predator species has fed on a particular target prey (King et al., Reference King, Read, Traugott and Symondson2008; Kuusk & Agustí, Reference Kuusk and Agustí2008). This approach has also been successfully used to detect parasitoid DNA within hosts (Agustí et al., Reference Agustí, Bourguet, Spataro, Delos, Eychenne, Folcher and Arditi2005; Traugott & Symondson, Reference Traugott and Symondson2008). Molecular detection of predation and parasitism (reviewed by Gariepy et al., Reference Gariepy, Kuhlmann, Gillott and Erlandson2007; King et al., Reference King, Read, Traugott and Symondson2008) is now a well-proven technology, with increasing numbers of studies conducted in the field (Agustí et al., Reference Agustí, Shayler, Harwood, Vaughan, Sunderland and Symondson2003; Harper et al., Reference Harper, King, Dodd, Harwood, Glen, Bruford and Symondson2005; Harwood et al., Reference Harwood, Desneux, Yoo, Rowley, Greenstone, Obrycki and O'Neil2007; Juen & Traugott, Reference Juen and Traugott2007; Zhang et al., Reference Zhang, Lü and Wan2007; Kuusk et al., Reference Kuusk, Cassel-Lundhagen, Kvarnheden and Ekbom2008). However, among all of them, few have been focused on predation of parasitized prey under field conditions (Chacón et al., Reference Chacón, Landis and Heimpel2008; Traugott et al., Reference Traugott, Bell, Raso, Sint and Symondson2011) and none in tomato crops.
It was, therefore, the aim of this study to test the existence and extent of trophic interactions between predators and parasitoids of whiteflies under greenhouse conditions, which could interfere with the biological control of those whitefly pests.
Materials and methods
Insects
Macrolophus pygmaeus and N. tenuis were reared at our facilities (IRTA, Cabrils) as described in Agustí & Gabarra (Reference Agustí and Gabarra2009a, Reference Agustí and Gabarrab). This colony is renewed every year with introductions of new field-collected insects from the same area. They were fed with Ephestia kuehniella Zeller (Lepidoptera: Pyralidae) eggs on tobacco. Ephestia kuehniella eggs were provided by Biotop (Valbonne, France). Bemisia tabaci and T. vaporariorum were reared on cabbage and tomato, respectively. Eretmocerus mundus was reared on B. tabaci on cotton plants. All insects were reared under controlled conditions of 25±2°C, 70±10% RH and L16:D8 photoperiod. The remaining species were obtained from crops near the study site.
Primer design, DNA extraction and amplification
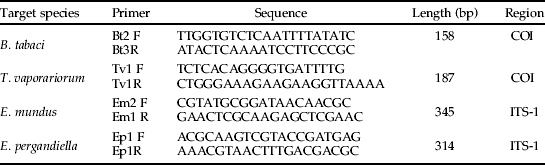
Two pairs of specific primers, Bt2F/Bt3R and Tv1F/Tv1R, were designed for B. tabaci and T. vaporariorum, respectively, from the mitochondrial cytochrome oxidase I (COI) region. Several sequences from the GenBank database (www.ncbi.nlm.nih.gov) were used as reference sequences to design species-specific primers for the COI gene for B. tabaci (AM691052, B. tabaci; AF418672 and AF110708, T. vaporariorum; AY842502, Aphis gossypii; DQ059302, Helicoverpa armigera) and T. vaporariorum (AY521259, B. tabaci; AY521265, T. vaporariorum; AY227082, Aphis gossypii; AY437834, H. armigera). Similarly, GenBank reference sequences for the ITS-1 region were used in the development of specific primers for E. mundus, Em2F/Em1R and E. pergandiella, Ep1F/Ep1R (AY854061, B. tabaci; AY854055, T. vaporariorum; AF273635, E. mundus; AY615778, E. pergandiella). In this case, ITS-1 region was used because of the impossibility of finding enough differences in the COI region to design specifics primers. Sequence alignments were performed using CLUSTALW (http://www.ebi.ac.uk/clustalw). AMPLICON software (Jarman, Reference Jarman2004) was used to design B. tabaci primers. The remaining primers were designed as described in Agustí et al. (Reference Agustí, Shayler, Harwood, Vaughan, Sunderland and Symondson2003).
DNA was extracted from individual insects using the DNeasy Tissue Kit (QIAGEN; protocol for animal tissues). Total DNA was eluted in 100 μl of AE buffer provided by the manufacturer and stored at −20°C. Negative controls were added to each DNA extraction set. Samples were amplified in a 2720 thermal cycler (Applied Biosystems, Foster City, CA, USA). Reaction volumes (25 μl) contained 4 μl of resuspended DNA. All pairs of primers were amplified by using 0.65 U of Taq DNA polymerase (Invitrogen), 0.25 mM of dNTPs (Promega), 0.4 μM of each primer and 1.5 mM (Em2F/Em1R), 3 mM (Bt2F/Bt3R and Tv1F/Tv1R) or 6 mM (Ep1F/Ep1R) of MgCl2 in 10× manufacturer's buffer. Samples were amplified for 35 cycles (except Ep1F/Ep1R, 40 cycles) at 94°C for 30 s; 63°C (Tv1F/Tv1R), 62°C (Em2F/Em1R) or 58°C (Bt2F/Bt3R and Ep1F/Ep1R) for 30 s; and 72°C for 40 s. A first cycle of denaturation at 94°C for 3 min and a final extension at 72°C for 5 min was carried out. Target DNA and water were always included as positive and negative controls, respectively. PCR products were separated by electrophoresis in 1.5% agarose gels stained with ethidium bromide and visualized under UV light.
Species specificity
At least ten individuals of each target prey were tested with their respective specific primers to test for intraspecific differences. Ten individuals of the B and Q biotypes of B. tabaci, which are the most common in the studied area (Moya et al., Reference Moya, Guirao, Cifuentes, Beitia and Cenis2001) were also analyzed. Specificity of the four pairs of primers was analysed by testing ten individuals of each prey, parasitoid and predator species potentially present in horticultural crops in the study area (table 1). Ephestia kuehniella was also tested as it was the prey of the predators during mass rearing.
Prey, parasitoid and predator species tested for cross-amplification using whitefly and parasitoid specific primers described in table 2.

Field sampling and analysis of field-collected predators
Eight tomato greenhouses located near Barcelona (NE Spain), where IPM programs based on conservation of these natural enemies were applied (Castañé et al., Reference Castañé, Alomar, Goula and Gabarra2004), were sampled in summer (May–October) for mirid predators, whiteflies and whitefly parasitoids. In order to determine their abundance, the number of adult whiteflies, as well as nymphs and adults of each predator species, were surveyed on ten leaflets per plant and on 30 plants per greenhouse. For whitefly pupae and parasitoid abundance, 30 tomato leaflets were collected per greenhouse from those leaves where adult whiteflies were starting to emerge from the pupae. The pupae were classified under a binocular microscope as alive, consumed or parasitized. Consumed whitefly pupae were easily distinguished from incomplete predation or other causes of mortality, because complete consumption by a fluid-feeding mirid bug leaves an empty cuticle without an insect emergence hole (Castañé et al., Reference Castañé, Alomar, Goula and Gabarra2004).
Immediately after M. pygmaeus and N. tenuis were collected, they were placed at 4°C and then frozen at –20°C when arriving to the lab. In order to avoid false negatives (Sint et al., Reference Sint, Raso, Kaufmann and Traugott2011), each predator was analyzed up to three times if previous times a positive result was not obtained. One predator was considered negative if prey DNA was not detected in the three analyses. Percentages of molecular detection of each prey species were calculated in each greenhouse, as well as percentages of multiple prey detection in the same individual predator.
Whitefly pupae and adult abundances were compared with whitefly molecular detection percentages in each greenhouse for both predator species. Abundances of non-parasitized and parasitized pupae were combined because whitefly DNA could also be detected in the parasitized pupae, depending on the parasitoid developmental stage (data not shown). Abundance of parasitized pupae was also compared with parasitoid molecular detection. The number of predators testing positive for whitefly DNA was also compared with the mean numbers of predated whitefly pupae in each greenhouse. The number of positive predators of both species was added, as it was not possible to determine which species had fed on the whitefly pupae when both predator species were present.
Multiple regression analyses were done to evaluate the relationships between molecular detection and the number of available whitefly pupae and adults, parasitized and predated prey (SAS Institute Inc., 2001). The available and predated whitefly data were logn-transformed.
In order to determine whether prey detection depended on predator species, molecular detection percentages of both whiteflies within each predator species were studied. A two-tailed Fisher exact test was performed (SAS Institute Inc., 2001).
Results
Species specificity
Specific primers that were designed for B. tabaci, T. vaporariorum, E. mundus and E. pergandiella (table 2) showed successful amplifications of the target prey in all cases (fig. 1). In the case of B. tabaci, B and Q biotypes were both successfully amplified. When the four pairs of primers were tested for cross-amplification against other potential prey (26 species belonging to 14 families; see table 1), only the target prey were detected, thus showing a high degree of primer specificity.
Amplification products obtained with the specific primers for the four target prey. Lane 2, Bemisia tabaci (158 bp); 3, Trialeurodes vaporariorum (187 bp); 4, Eretmocerus mundus (345 bp); 5, Encarsia pergandiella (314 bp). Lane 1, 100 bp DNA ladder.

Whitefly and parasitoid species-specific primer sequences (5′–3′), amplified fragment sizes and gene targeted.

Predation in greenhouses
Predator-prey abundance and prey molecular detection
Predator and prey abundances found in the eight sampled greenhouses are shown in table 3. Macrolophus pygmaeus was found in all greenhouses where it was sampled (greenhouse A was not sampled for abundances, although predators were collected for molecular analysis), while N. tenuis was found only in four. Predator nymphs were more abundant than adults in all greenhouses, except in greenhouse G for N. tenuis. Trialeurodes vaporariorum adult abundance was higher than B. tabaci in four of the sampled greenhouses, while the same was found for T. vaporariorum pupae in six of them. The abundance of pupae parasitized by E. mundus and E. pergandiella was low, except in greenhouse A, where E. pergandiella reached a very high level (34.6±8.81 pupae per leaflet).
Predator and prey abundances (mean±SE) in eight tomato greenhouses.

Bt, B. tabaci; Tv, T. vaporariorum; Em, B. tabaci parasitized by E. mundus; Ep, T. vaporariorum parasitized by E. pergandiella.
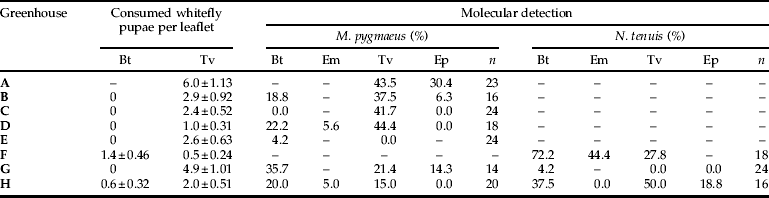
Percentages of prey detection by PCR in the eight sampled greenhouses are shown in table 4. Predators were collected from 30 plants per greenhouse, but only those greenhouses with more than 14 collected predators were analysed by PCR. Therefore, although low densities of N. tenuis and M. pygmaeus were observed in greenhouses E and F, respectively, analyses were not conducted. All prey species were detected by PCR in both predator species. Prey was detected in 39% (n=142) of M. pygmaeus and in 46% (n=61) of N. tenuis. Bemisia tabaci and T. vaporariorum molecular detection was achieved in all greenhouses where they were present, except in two cases: B. tabaci in greenhouse C, where only B. tabaci pupae were found; and T. vaporariorum in greenhouse E, where only adults were found and with the lowest abundance (table 3). However, predated B. tabaci pupae were only observed microscopically in two of the seven greenhouses. Therefore, molecular techniques were more likely than microscopy to detect the occurrence of rare predation events, as is shown in the detection of predation by M. pygmaeus on B. tabaci in four greenhouses where predation was not observed upon microscopic examination. Also, in those greenhouses where both M. pygmaeus and N. tenuis were present and analysed by PCR (G and H), molecular detection identified which whitefly species were being consumed by each predator species. In addition, E. mundus predation was detected by molecular analysis in all greenhouses where it was visually observed (F and H; see table 4), while E. pergandiella predation was detected only in three of the five greenhouses where it was documented in visual counts. In two greenhouses, molecular detection of one parasitoid was possible even when they were not observed (E. pergandiella in greenhouse G and E. mundus in greenhouse D), again reaffirming the utility of molecular techniques in the detection of rare predation events.
Predated prey observed under microscope (mean±SE) and percentages of positive M. pygmaeus and N. tenuis by PCR in eight tomato greenhouses.
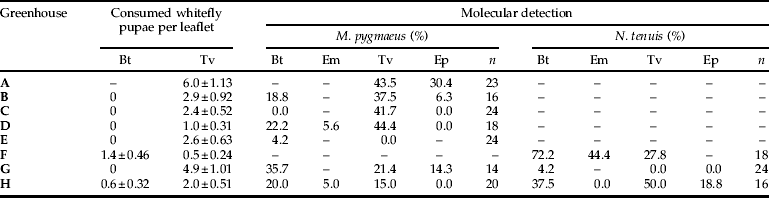
Bt, B. tabaci; Tv, T. vaporariorum; Em, B. tabaci parasitized by E. mundus; Ep, T. vaporariorum parasitized by E. pergandiella; n, number of predators analyzed.
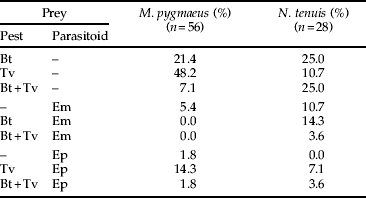
Molecular detection percentages of all prey combinations within M. pygmaeus and N. tenuis.
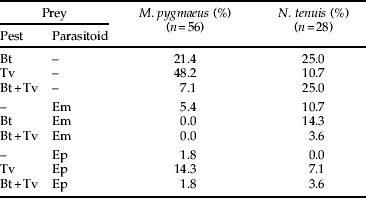
Bt, B. tabaci; Tv, T. vaporariorum; Em, E. mundus; Ep, E. pergandiella.
Relationship between prey abundance and molecular detection
Detection of whitefly DNA in predators was positively correlated with whitefly adult abundance (both whitefly species together) for both predator species (r2=0.55; P=0.009 for M. pygmaeus and r2=0.67; P=0.045 for N. tenuis; fig. 2a, b). Similarly, when whitefly pupae abundances (both whitefly species together) were related to molecular detection of whitefly DNA within predators, a significant positive relationship was found for N. tenuis (r2=0.88; P=0.005; fig. 2d) but not significant for M. pygmaeus (r2=0.28; P=0.079; fig. 2c). There was no significant relationship between parasitized whitefly pupae (both parasitoid species together) and detection of parasitoid DNA in M. pygmaeus (r2=0.21; P=0.304). This relationship was not calculated in N. tenuis because parasitoids were only found in two greenhouses together with this predator (see table 3), which was not enough to determine a relationship.
(a) and (b) Relationship between percentages of whitefly detected in both predator species and whitefly adult presence; and (c) and (d) whitefly pupae presence.

No significant relationship was found between the number of predated whitefly pupae observed under the microscope (table 4) and the whitefly DNA detected in the two predator species (r2=0.02; P=0.679).
Multiple prey molecular detection
Up to three different prey species were detected in both predator species (table 5). From the 56 M. pygmaeus in which prey were detected, one prey species was detected in 77% of them, two prey species were detected in 21% and three prey species were detected in only 2%. From the 28 N. tenuis in which the prey was detected, 46% were positive for one prey species, 46% for two and 7% for three, showing possibly greater polyphagy by this predator species.
Forty-five per cent of the predators positive for E. mundus were also positive for B. tabaci, while 92% of the predators positive for E. pergandiella were also positive for T. vaporariorum.
Prey molecular detection depending on predator species
Considering the particular case of greenhouse H, where both whitefly species and both predators where present (n=20 M. pygmaeus and n=16 N. tenuis), whitefly detection was higher within N. tenuis than within M. pygmaeus, and significantly higher (two-tailed Fisher's exact test, P=0.034) in the case of T. vaporariorum (fig. 3).
Prey molecular detection percentages within M. pygmaeus and N. tenuis from greenhouse H. *, significant difference between M. pygmaeus and N. tenuis. Bt, B. tabaci; Tv, T. vaporariorum.

Discussion
In the present study, it was demonstrated that both predators were feeding on both whitefly species, as well as on both parasitoid species under greenhouse conditions. Prey molecular detection was possible in greenhouses where prey abundance was very low or even not observed under a microscope. This suggests that predators are also feeding on small life stages of parasitoids (eggs and early larvae), which are very difficult or impossible to detect inside the whitefly by direct observation or dissection. This molecular technique provides improved detection of prey consumption in greenhouse crops, as well as the possibility to identify which prey species were fed by each predator species present in the same greenhouse, which was impossible in previous studies using traditional methods (Castañé et al., Reference Castañé, Alomar, Goula and Gabarra2004; Arnó et al., Reference Arnó, Matas, Martí, Ariño, Roig and Gabarra2005).
Whitefly molecular detection within both predators was significantly related to the adult whitefly abundance found in the greenhouses, as well as to whitefly pupae abundance in the case of N. tenuis. Montserrat et al. (Reference Montserrat, Albajes and Castañé2000b) observed a higher efficiency of M. pygmaeus preying on second-instar larvae of Frankliniella occidentalis (small and mobile) than on fourth-instar nymphs of T. vaporariorum (bigger and sessile). This suggests that M. pygmaeus could be attracted to mobile prey, which could explain the significant relationship between whitefly molecular detection and the abundance of adult whitefly within the same predator. Another explanation would be related to the distribution on the plant. Adult whiteflies, mainly T. vaporariorum, tend to congregate in the upper leaves of the tomato plant (Arnó et al., Reference Arnó, Albajes and Gabarra2006), an area which also supports larger predator populations (Arnó et al., Reference Arnó, Castañé, Riudavets and Gabarra2010).
As expected, no relationship was found between whitefly DNA detected in predators and the observed predation on whiteflies. The number of predated whitefly pupal husks observed on the leaves is the result of predation over an extended period of time. It is not possible to know when these pupae were consumed or which predator species had fed on them. Also, no relationship was observed between parasitoid molecular detection and parasitoid abundance, as estimated by visual inspection of leaves. This suggests an underestimation of parasitism under the microscope because of the difficulty of observing parasitoid egg and larval stages. Even if these predators have been reported previously to prey on E. mundus pupae, immature stages and adults in laboratory studies (Malo, Reference Malo2009), molecular methods are probably optimal for future work looking at the predators' impact on parasitoids, as these techniques provide more sensitive species-specific detection.
The molecular analysis of field collected predators allowed the identification of up to three different prey species in some of the analysed predators. Intraguild predation may be advantageous when pest species are scarce (van Baalen et al., Reference van Baalen, Krivan, van Rijn and Sabelis2001) or disadvantageous when predators reduce the effectiveness of parasitoids by feeding on them (Rosenheim et al., Reference Rosenheim, Kaya, Ehler, Marois and Jaffee1995). Therefore, analysis of predation rates on parasitized prey can be important when determining the effectiveness of polyphagous predators simultaneously with parasitoids (Hoelmer et al., Reference Hoelmer, Osborne and Yokomi1994). Although the number of specimens analyzed in the present study was fairly low, we show that both predators fed mainly on whiteflies (76.7% for M. pygmaeus and 60.7% for N. tenuis) but also on parasitoids (23.3% and 39.3%, respectively). As mentioned before, previous studies have already shown intraguild predation on parasitoids under field conditions using molecular tools. Chacón et al. (Reference Chacón, Landis and Heimpel2008) showed predation on the parasitoid Aphidius colemani by Harmonia axyridis and Chrysoperla carnea. Similarly, Traugott et al. (Reference Traugott, Bell, Raso, Sint and Symondson2011) showed predation on several species of aphid parasitoids by generalist predators. Other studies indicate that joint presence of these predators and these parasitoids could be complementary (Castañé et al., Reference Castañé, Alomar, Goula and Gabarra2004; Gabarra et al., Reference Gabarra, Zapata, Castañé, Riudavets and Arnó2006). The present study shows that predation on E. mundus and E. pergandiella by M. pygmaeus and N. tenuis under greenhouse conditions is common and could have a negative effect on biological control. However, further experiments or larger scale collections are necessary to confirm the existence and impact of such interactions on the success of biological control of whiteflies.
Although E. pergandiella has been described as a B. tabaci parasitoid (Liu & Stansly, Reference Liu and Stansly1996), the combination of B. tabaci and E. pergandiella DNA was not detected in predators. This suggests preference by this parasitoid for T. vaporariorum when both whitefly species are available. Similar results were found when natural parasitism by both parasitoids on whiteflies in tomato and cucumber crops were studied (Arnó et al., Reference Arnó, Matas, Martí, Ariño, Roig and Gabarra2005).
Molecular prey detection was higher in N. tenuis than in M. pygmaeus. Although it can be the result of a lower digestion rate in N. tenuis, a higher voracity of this predator species could also explain this difference. This would agree with previously published studies, like Arnó et al. (Reference Arnó, Sorribas, Prat, Matas, Pozo, Rodríguez, Garreta, Gómez and Gabarra2009), who compared the predatory capacity of both predators on T. absoluta eggs and observed that M. pygmaeus nymphs preyed significantly less than N. tenuis nymphs. Barnadas et al. (Reference Barnadas, Gabarra and Albajes1998) also observed that M. caliginosus consumed fewer B. tabaci and T. vaporariorum pupae than the mirid D. tamaninii. Finally, Montserrat et al. (Reference Montserrat, Albajes and Castañé2000a) found lower prey searching activity in M. caliginosus than in D. tamaninii.
This study has demonstrated the effectiveness of molecular markers to study predation in agroecosystems, including greenhouse tomato crops. Here, trophic interactions were detected between the polyphagous predators M. pygmaeus and N. tenuis in the presence of the whiteflies B. tabaci and T. vaporariorum and two parasitoids under field conditions. This predation on the parasitoids indicates the existence of intraguild predation, which could interfere with the biological control of those whitefly pests. The extent of this impact on a biological control program needs to be investigated further. Nonetheless, the molecular markers described here provide valuable information that would be difficult or impossible to obtain by other methods.
Acknowledgements
We thank Victor Muñoz, Pilar Hernández, Francisca Oliver, Thaïs Aznar, Faten Hamdi and Ramon Berruezo for their technical support and Lluis Torres and Pablo Manzano for the statistical support. We also thank the anonymous reviewers and the subject editor for improving the manuscript. This work has been funded by the Spanish Ministry of Science and Innovation (MICINN) (Projects AGL2008-00546 and AGL2010-18811). R. Moreno-Ripoll was supported by a FPI grant and N. Agustí by the Program Ramón y Cajal, both funded by the MICINN.