The risk of sudden cardiac death from coronary artery anomalies has been well described previously.Reference Frescura, Basso and Thiene 1 , Reference Basso, Maron, Corrado and Thiene 2 Coronary arteries that arise from the aorta outside of its ipsilateral sinus of Valsalva, anomalous aortic-origin coronary arteries, with an interarterial course impart a greater risk.Reference Maron, Thompson and Ackerman 3 In an autopsy series of patients who died suddenly, 0.2–6.3% were diagnosed with anomalous aortic-origin coronary arteries.Reference Brothers, Carter, McBride, Spray and Paridon 4
Little high-quality evidence exists to guide the management of these patients. Restriction of exercise level and surgery comprise the primary management strategies.Reference Brothers, Gaynor, Paridon, Lorber and Jacobs 5 , Reference Van Hare, Ackerman and Evangelista 6 In general, concern exists regarding the merit of exercise restriction in children. It may result in decreased physical activity, leading to caloric imbalance and increased adiposity. Children with congenital heart disease have at least an equal risk of obesity as the general paediatric population.Reference Pinto, Marino and Wernovsky 7 , Reference Shustak, McGuire, October, Phoon and Chun 8 Obesity may be even more common in adults with congenital heart disease and may promote the early development of acquired cardiovascular disease as well.Reference Lamotte, Iliescu, Libersa and Gottrand 9 , Reference Woo, Chook and Yu 10
In this investigation, we used the Congenital Heart Surgeons’ Society Data Center’s registry of patients diagnosed with anomalous aortic-origin coronary arteries to gain insight into the relationship between changes in body mass index over time in patients who were exercise restricted versus those who were not. We hypothesised that exercise restriction in patients with anomalous aortic-origin coronary arteries was associated with increasing body mass index over time.
Materials and methods
The details of the Congenital Heart Surgeons’ Society’s anomalous aortic-origin coronary arteries registry have been previously described.Reference Brothers, Gaynor and Jacobs 11 In brief, an ongoing inception cohort of 440 patients diagnosed with anomalous aortic-origin coronary arteries from January 1998 to September 2015 was enrolled by 38 institutions. Patients were less than 30 years of age at the time of enrolment. Patients with any of type of haemodynamically significant structural cardiac disease were excluded. Only patients with both documented height and weight measurements and exercise-restriction status were included in this analysis, which comprised the study population (n=143). If exercise-restriction status had never been documented, the patient was excluded.
Data acquisition and follow-up
Institutional Review Board approval for enrolment was obtained from each of the 38 participating institutions. Patient participation in the study was voluntary, and patient medical information was kept confidential. Parental consent was obtained for patients under 18 years of age before enrolment. For patients over 18 years of age, consent was obtained directly. Diagnostic, surgical, echocardiographic, and clinical characteristics were abstracted from de-identified institutional patient medical records, as previously described.Reference Poynter, Williams, McIntyre, Brothers and Jacobs 12 Annual follow-up of patient medical history was performed by the Congenital Heart Surgeons’ Society Data Center staff.
Statistical analyses
Baseline demographic, clinical, operative, echocardiographic, and anatomical characteristics were summarised. Z-scores for weight, height, and body mass index were calculated for all patients using the 2000 standards from the Centers for Disease Control and Prevention in order to account for the age-dependency of body mass index.Reference Kuczmarski, Ogden and Guo 13 The macros used to generate the z-scores were downloaded from http://www.cdc.gov/nccdphp/dnpao/growthcharts/resources/sas.htm. Categorical variables are reported as percentages and frequencies and were compared using the χ2 test or Fisher’s exact test, as appropriate. Continuous variables are summarised as means and standard deviations or medians with interquartile ranges (IQR). The normality of their distributions was evaluated using the Shapiro–Wilk test and were compared using Student’s t-test or the Mann–Whitney U-test, as appropriate. A p-value of 0.05 was considered significant. For time-related exercise restriction, informative imputation based on the previous clinic visit’s status was utilised if exercise-restriction status of subsequent visits was missing.
Univariable and multivariable associations between body mass index z-score and exercise-restriction status over time were assessed using linear mixed model regression (PROC MIXED) with repeated measures of body mass index z-scores. Covariates entered into the multivariable model included baseline exercise-restriction status, sex, baseline symptomatic state, age at diagnosis, age at operation, coronary arterial anatomical characteristics, and exercise restriction and surgical intervention over time, as time-varying covariates, where their values were allowed to change at each clinic visit. The covariates with significant associations with body mass index z-score over time in the univariable analysis were entered into a multivariable linear mixed model repeated-measures analysis. Stepwise selection was performed manually, as PROC MIXED does not include automatical variable selection. A threshold for significance of p=0.05 was used for univariable associations; p=0.10 was used for covariate entry into the model; and p=0.05 was used for covariate retention. For all significant covariates, interaction terms with time were created and tested for statistical significance. All analyses were performed using SAS 9.2 (SAS Institute Inc., Cary, North Carolina, United States of America).
Results
Baseline characteristics
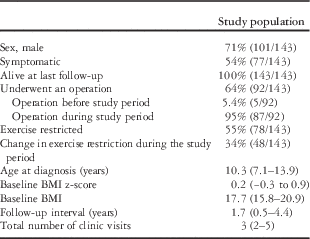
In total, 143 patients who attended 558 clinic visits were included in this analysis. Patients attended a median of three clinic visits, with an interquartile range of two to five visits and an absolute range of 1–13 clinic visits. Baseline patient demographic characteristics are shown in Table 1. Males accounted for 71% of patients. At the first clinic visit, 54% were symptomatic, and exercise restriction was recommended for 55% or 78/143 patients. Symptoms were present in 63%, or 49/78, of restricted patients. Surgery for anomalous aortic-origin coronary arteries was performed in five patients before the study period and in 87 during the study period. At their first clinic visit, 55% were exercise restricted, and 34% (48) of patients’ exercise-restriction status changed during follow-up. Of the 48 patients whose exercise-restriction status changed, 39 underwent surgery. Exercise restriction was lifted in all 39 of these patients. Patients were diagnosed at a median age of 10.3 years, with an IQR of 7.1–13.9 years, and were followed-up for a median of 1.7 years (IQR 0.5–4.4). All patients were alive at the end of the study period. The median baseline body mass index z-score was +0.2 (IQR −0.3 to +0.9).
Baseline and demographic characteristics.

BMI=body mass index
Anatomical characteristics of surgically managed patients
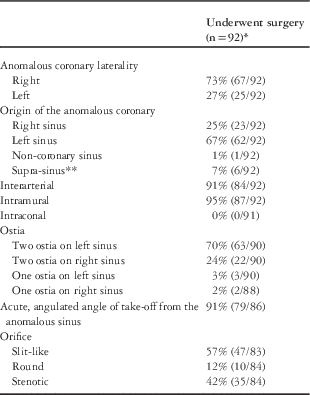
Detailed anatomical data were available for patients who underwent repair (n=92, Table 2). A single operation was performed for 86 patients, two operations for five patients, and three operations for a single patient. Anomalous right coronary arteries were present in 73% of patients, whereas 27% had an anomalous left coronary arteries. An interarterial or an intramural course was present in 91 and 95%, respectively, whereas none of them had an intraconal course. Acute angulation of the take-off from the anomalous sinus was observed in 91%. A slit-like or stenotic orifice was seen in 57 and 42%, respectively.
Anatomical characteristics of surgical patients.

* Complete descriptions of all anatomic features were not available for all patients from their operative notes
** Refers to coronary arteries found explicitly superior to the sinus ridge. For specific definitions and descriptions of the anatomic featuresReference Poynter, Williams, McIntyre, Brothers and Jacobs 12 , Reference Poynter, Bondarenko and Austin 14
Univariable associations with body mass index z-score over time
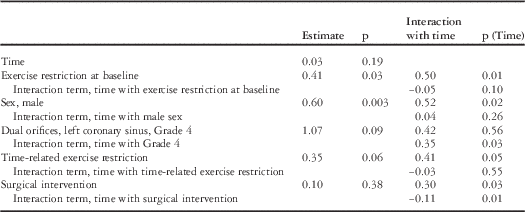
Univariable associations of baseline characteristics, anatomical characteristics, time-varying exercise restriction, and surgical intervention with body mass index z-score over time were tested using repeated-measures analysis. Male sex, exercise restriction at baseline, Grade 4 dual orifices of the left coronary sinus, in which a single orifice within the coronary sinus with a common coronary arterial trunk that bifurcates into two separate coronary arteries outside of the aorta, time-related exercise-restriction status, and time-related surgical intervention were all associated with increasing body mass index z-score over time (Table 3). All, except for male sex, had significant interactions with time.
Univariable associations with body mass index z-score over time.

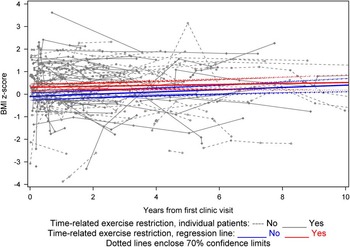
In Figure 1, all patients’ body mass index z-scores are plotted over time. Regression lines, derived from the parameter estimates from repeated-measures analysis, were solved for exercise-restriction status (parameter estimate=0.41, p=0.05) and its interaction term with time (parameter estimate=−0.03, p=0.55) and were plotted. As displayed, body mass index z-scores over time did not differ by time-related exercise-restriction status.
Body mass index z-scores over time stratified by time-related exercise-restriction status. Individual patient body mass index z-scores are plotted over time since the patient’s first clinic visit. Body mass index z-scores for patients who were exercise restricted during the study period are connected by solid grey lines. Body mass index z-scores for patients who were not exercise restricted are connected by dashed grey lines. Regression lines, which incorporate time-related exercise restriction (parameter estimate=0.41, p=0.05) and its interaction term with time (parameter estimate=−0.03, p=0.55), are plotted. The solid blue line represents the regression line in which time-related exercise restriction was not present, with the dotted blue lines enclosing the 70% confidence limits. The solid red line represents the regression line in which time-related exercise restriction was present, with the dotted red lines enclosing the 70% confidence limits.

Multivariable associations with body mass index z-score over time
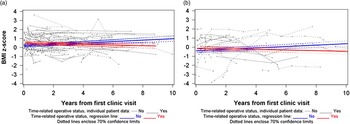
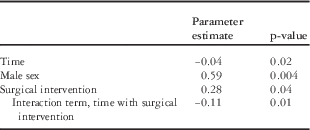
All covariates with significant associations with body mass index z-score over time in the univariable analysis were evaluated in the multivariable repeated-measures analysis as candidate-associated factors. As shown in Table 4, the final multivariable model included male sex, surgical intervention as a time-varying covariate, and its interaction term with time. Neither time-related exercise-restriction status nor its interaction with time was significantly associated with body mass index z-score over time in the multivariable analysis (p=0.84 and 0.49, respectively). In Figures 2a and b, regression lines solved for the effect of surgical intervention and its interaction term with time are shown, for male (Fig 2a) and female patients (Fig 2b). The slope of body mass index z-score of those who underwent an operation during the study period indicated a decreasing body mass index z-score over time, compared with an increasing body mass index z-score over time in those who did not undergo an operation.
( a and b ) Body mass index z-scores over time stratified by time-related surgical intervention in male patients ( a ) and female patients ( b ). Individual patient body mass index z-scores are plotted over time since the patient’s first clinic visit. Body mass index z-scores for patients who were underwent surgical intervention during the study period are connected by solid grey lines. Body mass index z-scores for those who did not undergo surgical intervention are connected by dashed grey lines. Regression lines, which incorporate male sex (parameter estimate=0.59, p=0.004), time-related surgical intervention (parameter estimate=0.28, p=0.04), and its interaction term with time (parameter estimate=−0.11, p=0.01), are plotted. The solid blue line represents the regression line in which time-related surgical intervention did not occur, with the dotted blue lines enclosing the 70% confidence limits. The solid red line represents the regression line in which time-related surgical intervention did occur, with the dotted red lines enclosing the 70% confidence limits.

Multivariable associations with body mass index z-score over time.

Discussion
The risk of obesity in children with congenital heart disease is almost equal to those of healthy children.Reference Pinto, Marino and Wernovsky 7 , Reference Shustak, McGuire, October, Phoon and Chun 8 Multiple studies have shown that children with congenital heart disease are not as physically active as children without heart disease.Reference Arvidsson, Slinde, Hulthen and Sunnegardh 15 – Reference McCrindle, Williams and Mital 17 Concern exists regarding the effects of exercise restriction on body composition. Using a subset of a multi-institutional cohort of patients with anomalous aortic-origin coronary arteries and repeated-measures analysis, we found that time-related exercise restriction was not associated with increasing body mass index z-score over time; however, surgical intervention was associated with decreasing body mass index z-score over time.
Exercise restriction over time
Several investigations have provided initial insight into the effects of exercise restriction on children with congenital heart disease. In 2010, Brown et al demonstrated little benefit of exercise restricting patients with critical aortic stenosis after balloon valvuloplasty. In 528 patients followed-up for a median time of 12 years, only a single sudden death occurred – the patient died while asleep. Although this study did not directly assess the effect of exercise restriction on body composition, the investigators concluded that the benefits of exercise restriction in young patients with critical aortic stenosis in terms of preventing sudden death may be overstated.Reference Brown, Dipilato and Chong 18 The accompanying editorial highlighted the potential risks of exercise restriction – depriving children of the many known benefits of physical activity.Reference Rome 19 In our study population of 143 patients with known exercise-restriction status, no sudden death occurred in either the restricted group or the non-restricted group.
The effect of exercise restriction on body composition was directly investigated in a single-centre study of 110 patients with various forms of congenital heart disease. With a mean follow-up period of 8.4 years, exercise restriction was associated with an increase in absolute body mass index and body mass index percentile;Reference Stefan, Hopman and Smythe 20 however, their analysis did not analyse repeated measures of body mass index over time or incorporate exercise restriction as a time-varying covariate. Although our study’s follow-up period was shorter, our results, generated using more sophisticated techniques, indicate that exercise restriction does not appear to detrimentally impact body mass index over time.
Surgical intervention over time
The association of surgical intervention with decreasing body mass index z-score over time represents a novel finding in patients with anomalous aortic-origin coronary arteries. In a cohort of patients with various forms of congenital heart disease, Shustak et al found no effect of surgical intervention on the risk of obesity; however, male patients who had undergone surgery were twice as likely to be overweight or obese.Reference Shustak, McGuire, October, Phoon and Chun 8 It must also be emphasised that the confidence limits of the regression lines in Figure 2 do not diverge until ~8 or more years after the first clinic visit. It would appear that an operation would have little short-term effect on body mass index z-score during childhood. The beneficial effect may be seen in late adolescence or early adulthood in many children, given that the median age at diagnosis was 10 years. This finding is puzzling when taking into account the evidence that physical activity levels decrease as children approach adulthood.Reference Brener, Kahn and Shanklin 21 , 22
Study limitations
We acknowledge several significant limitations of this study. First, this is a retrospective study with the inherent limitations of analysing a non-random sample of patients.
Only one-third (143/440) of this cohort of patients with anomalous aortic-origin coronary arteries had documentation of their exercise-restriction status. It would seem that the discussion and documentation of the exercise-restriction status would be part of best practices for this patient population, as recommended by the Bethesda Guidelines.Reference Dean, Gillespie and Greene 23 Although these guidelines do not technically apply to pre-adolescent children, they have been used to guide decision making for these patients.Reference Brown, Dipilato and Chong 18 , Reference Stefan, Hopman and Smythe 20 It is unclear whether this is due to lack of discussion, documentation, or both. The fact that a minority of patients had a change in their exercise-restriction status likely decreases our ability to detect whether time-related exercise-restriction status does lead to changes in body mass index over time. Furthermore, there was no way to truly ascertain patients’ level of physical activity before the imposition of exercise restriction, as these data were not collected. Finally, the relatively modest length of follow-up may represent another limitation. This highlights the importance that the lack of overlapping confidence limits seen in Figure 2 represents projections based on the parametric linear mixed model regressions.
The fact that exercise restriction was discussed with patients and their parents may result in changes in patients’ exercise level. Parents may have heightened awareness of their child’s activity level, which may lead to the imposition of intended or unintended limitations. Although previous reports have shown that physicians may not adequately emphasise the importance of physical activity in children with congenital heart disease to parents, many parents are also unable to correctly describe their child’s exercise restrictions, leading to unnecessary and potentially harmful exercise limitation.Reference Cheuk, Wong, Choi, Chau and Cheung 24 – Reference Swan and Hillis 26
These discrepancies have also been described in patients with Fontan circulation who require anticoagulation, and are thus exercise restricted. Longmuir and McCrindleReference Longmuir and McCrindle 27 reported that, although parents reported a higher rate of exercise restriction than cardiologists, more than 40% of parents were unaware of restrictions on their child’s participation in competitive athletics, indicating the many gaps in effectively enforcing exercise restriction. There was also no way to know with certainty patients’ adherence to physician guidance regarding exercise restriction following counselling. Finally, the possibility exists that parents could receive information on exercise restriction from multiple physicians, some of whom may contradict one another.
Conclusions
In a multi-institutional study of patients with anomalous aortic-origin coronary arteries, exercise restriction was not associated with increasing body mass index z-score over time. Although surgical intervention was associated with decreasing body mass index z-score over time, its effect was not significant for nearly a decade after the patient’s first presentation with an anomalous aortic-origin coronary artery. Future investigations should focus on defining patients who will benefit most from surgical intervention. Given that they may be at high risk for sudden cardiac death during physical activity, we recommend that physicians discuss and document exercise status with patients and their parents at every clinic visit. Finally, efforts to improve patient and parental comprehension of the level of exercise restriction are critical.
Acknowledgements
The authors thank the Congenital Heart Surgeons’ Society Data Center staff, including Sally Cai, Kathryn Coulter, Annette Flynn, Kristina Kovach, Susan McIntyre, and Ilina Ristevska, for coordinating patient enrolment and the collection, abstraction, and management of data. We are also grateful to all members of the Congenital Heart Surgeons’ Society and their colleagues for their ongoing contributions to this study. The authors are grateful to the Michael H. Ludwig Memorial Foundation for funding the CHSS AAOCA Registry, as well. Finally, the authors thank the patients enrolled in the AAOCA Registry for their participation in Congenital Heart Surgeons’ Society studies.
Financial Support
Funding for Dr James M. Meza was provided by the Congenital Heart Surgeons’ Society and the Division of Cardiovascular Surgery at the Hospital for Sick Children. Funding for the CHSS AAOCA Registry has been provided by the Michael H. Ludwig Memorial Foundation.
Conflicts of Interest
None.