Introduction
The EU crisis that started in 2007, and that still seems to be ongoing, is complex and multidimensional, linking a banking, sovereign debt and macroeconomic crisis (Tosun et al., Reference Tosun, Wetzel and Zapryanova2014). As Germany is considered the most powerful economy in the European Union and the assumed ‘winner’ of the crisis (Kaitila, Reference Kaitila2014), one would not expect food insecurity to be a German problem. But beyond the complexity of the crisis and the German ability to cope with it, public discourse has it that the most severe economic effects of the crisis were felt by fragile national economies and low-income households all over Europe. Although the German GDP per capita has been growing faster than elsewhere in the EU-15 on average (ibid.: 348), income inequality has also risen sharply since 2000 (OECD, 2011). The German Gini CoefficientFootnote 1 (disposable income, post taxes and transfers) made a considerable jump between 1999 (0.259) and its all time high of 0.297 in 2005, before somewhat retreating back to 0.286 in 2010. Thus, the German Gini is better than the UK value (0.341 in 2010); current levels of German inequality, which are similar to those found in some Nordic countries in the 1980s, are very close to the OECD average (ibid.).
However, unlike rising income inequality, household food insecurity or food poverty in Germany seem to be much less widely acknowledged or discussed than, for instance, in the UK, where the more drastic reality is harder to ignore, with a 54 per cent increase in food banks from 2012 to 2013 alone (Cooper et al., Reference Cooper, Purcell and Jackson2014: 4). While in the UK church and welfare organisations are highlighting the problem and the press is responding (for example, The Guardian started a Food Poverty section in 2011), in Germany food poverty does not yet have the same impact on public discourse. As we have argued elsewhere (Pfeiffer et al., Reference Pfeiffer, Ritter and Hirseland2011), reasons for this neglect include the role of the third sector in Germany, an historically specific denial of food poverty as something which should have been overcome after the post war period, and new forms of body-related stigmatisation of poverty, for example, associating obesity with poverty.
Food poverty in what we consider affluent societies seems something of a contradiction; however, hunger has always been caused by poverty and inequality, not scarcity (Holt-Gilmènez et al., 2012: 595). With rising inequality, food insecurity, meaning the ‘inability to acquire or eat an adequate quality or sufficient quantity of food in socially acceptable ways (or the uncertainty of being able to do so)’ (Dowler and O'Connor, Reference Dowler and O'Connor2012: 44), is increasingly a serious problem in the Global North and otherwise stable European economies. Food poverty in the heart of Europe is not an inevitable and short-term consequence of the last economic crisis, but follows certain changes to the social security system, particularly a more punitive implementation (Cooper et al., Reference Cooper, Purcell and Jackson2014: 6). In Germany and the UK alike, the state has widely ignored the issue, delegating it to charitable solutions (Caraher and Dowler, Reference Caraher, Dowler, Goodman and Sage2014; Pfeiffer et al., Reference Pfeiffer, Ritter and Hirseland2011).
This article provides empirical results derived from quantitative and qualitative data on the coping strategies of low-income households and those living under conditions of welfare as defined by Social Code II (Sozialgesetzbuch II), as a consequence of the enforced major, and what some consider to be a highly punitive, changes to the German social security system in 2005. First, we give some insights into the degree of food insecurity in Germany, based on the rather unsatisfactory state of research, and on corresponding figures from SILC/Eurostat (Section 2). We then confront the quantitative results with our in-depth qualitative analysis, to shed light on day-to-day strategies developed to tackle food insecurity by households affected in Germany (Section 3). These findings are based on secondary analysis of 458 narrative and biographical interviews, conducted with more than 100 welfare recipients in four waves of interviews. After introducing the methodological details, we provide a typology of the strategies poor households develop to cope with nutritional restrictions and alimentary exclusion. In our conclusion (Section 4), we discuss the results not only as indicators of food insecurity in Germany, but in the light of social participation and resultant consequences for social policy.
Food insecurity in Germany
In 2011, drawing on a variety of evidence from different sources of quantitative data, we sought to demonstrate that there is nutritional poverty in Germany, and in particular that social welfare recipients are widely excluded from normative social patterns of consumption, including eating outside the home (Pfeiffer et al., Reference Pfeiffer, Ritter and Hirseland2011). Since then, the situation has intensified. Physiological hunger and ‘hunger for social inclusion’ are an increasing reality in contemporary German society. We now provide some basic information on the state of food-related research in Germany.
As in 2011, we face scientific and public ignorance towards the reality of food insecurity. According to the German food survey (Nationale Verzehrstudie), one in five people is classified as obese, and excess weight is unequally distributed along the social scale (Max Rubner-Institut, 2008). Whereas surveys on food and nutrition in Great Britain (National Food Survey, NFS) do take poorer population strata into consideration, or even over-represent them, the German NVS excluded population groups at a higher risk of nutritional poverty from study. For example, migrants, homeless people or elderly people are underrepresented, although including these population groups might allow for more detailed insights into the risks of nutritional poverty, especially if aspects such as food availability, utilisation and accessibility were also studied (Withbeck et al., Reference Withbeck, Xiaojin and Johnson2006). This sampling bias could partly be explained by the fact that the scientific and public debate on eating patterns in Germany is primarily dominated by concern over obesity, rather than food poverty.Footnote 2 The German food surveys thus do not give a clear picture of household food insecurity because of the omission of population groups most likely to be vulnerable to it; there is a tendency to imply that unsatisfactory nutrition in Germany is merely a self-inflicted problem caused by unhealthy eating patterns (Max Rubner-Institut, 2008: 163). While nutritional poverty in the UK is discussed by academics in the light of food security, and therefore the focus lies on structures of relevance, such as local food availability, food accessibility, subjective utilisation and general conditions (Pfeiffer et al., Reference Pfeiffer, Ritter and Hirseland2011), food surveys in Germany are as granular in nutritional details as they are biased according to social stratification effects.
Despite the lack of thorough food-related research in Germany, there are some indicators that point to the rising problem of household food insecurity. One is the exploding number of food banks in Germany. Although Germany has not faced as abrupt a rise in food bank consumption as has the UK (Cooper et al., Reference Cooper, Purcell and Jackson2014: 4), their growth has accelerated since 2005 (the year in which the Social Code II was introduced), from 480 to, by 2013, 916 food banks.Footnote 3 Currently, 60,000 volunteers serve food to 1.5 million so-called ‘regular customers’. These numbers alone could be interpreted as evidence of food insecurity in Germany. Further indicators come from the few items that point to nutrition-related topics in surveys regularly conducted by the Federal Statistical Office. In 2011, based on SOEP,Footnote 4 we estimated that 1 per cent of the population, or 800,000 people, in Germany were spending less than 99 Euros per month of their household expenditure on food, and were likely to live in nutritional poverty and experience hunger at least from time to time (Pfeiffer et al., Reference Pfeiffer, Ritter and Hirseland2011). This may also hold true for an estimated 300,000 homeless people. As we also pointed out in 2011, food insecurity could also be an intermittent reality for some of the 7 per cent of the population, more than 5 million people, who have a monthly nutritional spend of between 100 and 199 Euros. The SOEP dataset also indicates that spending on food differs according to employment status: in 2011, German employed households spent, on average, 362 Euros a month on food, beverages and tobacco (13.7 per cent of monthly private consumption expenditure), while unemployed households were only able to spend 205 Euros, or 19.2 per cent of their consumption expenses. The differences are much more evident if one compares expenditures on hotels and restaurants: German employed households spent 147 Euros per month (5.6 per cent of consumption spendings) while unemployed households equivalent expenses total a meager 21 Euros a month, or 2 per cent of their overall expenditure (Statistisches Bundesamt, 2013: 147).
Unfortunately, Germany does not have research which uses a similar methodology to the Poverty and Social Exclusion (PSE) project in the UK, which is based on a ‘necessities of life’ approach, and which aims for a consensual measure of relative poverty, using majority opinion to determine the set of items and activities which are regarded as necessities (Gannon and Bailey, Reference Gannon and Bailey2014). Assuming German public opinion to be similar for what is seen as necessary, and to what extent, we can use the PSE list with the SILC/Eurostate database for Germany. The PSE list for the UK contains several items that refer to food consumption in a narrow sense: 91 per cent of the population surveyed saw two meals a day as necessary for adults, and 93 per cent considered three meals a day essential for children. Fresh fruit and vegetables every day were seen as a necessity of life for adults by 83 per cent, and for children by 96 per cent. And while ‘meat, fish or an equivalent’ every other day are considered necessary for adults by 76 per cent and for children by 90 per cent, a regular roast joint or equivalent is now only seen as indispensable for adults by 36 per cent (ibid.: 328–9).
As food security is thus shown as being considered one of the key essentials of life, we use these indicators with consumption data from the SILC/Eurostat survey over time for Germany, comparing them to data for the EU27, the UK and Greece. We chose these comparators because Germany and Greece are at opposite ends of the European scale for almost all social and economic indicators, and the UK is mostly found somewhere in the middle. For example, the 2012 unemployment rate in Greece is the worst in Europe at 24.5 per cent, Germany's was the best with 5.5 per cent, while the UK lies in between with 8.1 per cent (see OECD, 2014: 101). This is also true for the share of ‘yes’ responses to the question ‘Have there been times in the past twelve months when you did not have enough money to buy food that you or your family needed?’ For Greece, the percentage answering ‘yes’ jumped from under 10 per cent in 2006/07 to around 18 per cent in 2012, while there was a considerable decline in Germany from around 7 per cent to under 5 per cent and a moderate decline from 10 per cent to around 8 per cent in the UK (ibid.: 28).
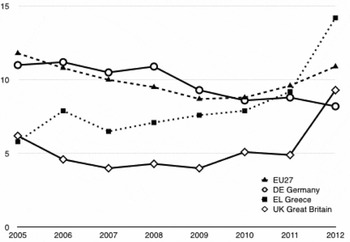
The only data to shed light on food consumption behaviour are those on the ability to afford one meal with meat, chicken or fish (or vegetarian equivalent) every second day (or at least once a day for children). Data comparing the EU27, Germany, the UK and Greece (see Figure 1) show a moderate decline in the percentage of the total population; for Germany, the proportion who could not afford the stated meal every second day sank from 11 per cent in 2005 to 8.2 per cent in 2012. At first sight, food poverty seems not to be an increasing problem, that is, if the German public and political opinion take 8.2 per cent unable to afford a meat meal regularly as acceptable, especially as the UK, Greece and the average EU27 have far higher percentages which rapidly increased from 2011 to 2012 alone.
Percentage of total population who cannot afford one meal with meat, chicken or fish (or vegetarian equivalent) every second day Source: SILC/Eurostat 2013.

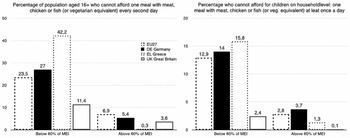
However, differentiating the data points to a more problematic constellation for Germany. Figure 2 shows that 27 per cent of Germans with an income below 60 per cent of the Medium Equivalised Income (MEI) cannot afford one proper meal every second day, a figure that is without question considerably better than Greece's 42.2 per cent, but higher than the European average of 23.5 per cent and much higher than UK's 11.4 per cent. In fact, the percentage who cannot afford a proper meal although their income is above 60 per cent of MEI is higher in Germany, at 5.4 per cent, than in the UK, where 3.6 per cent of the defined non-poor cannot afford a square meal every second day. Even if they cannot afford such a meal for adults every now and then, poor households evidently try hard to provide a proper meal at least once a day for their children, as indicated by the overall lower percentages on the right side of Figure 2 for the answer ‘cannot afford’. Nevertheless, Germany, with 14 per cent (those with income below 60 per cent of MEI) and 3.7 per cent (income above 60 per cent of MEI) respectively, shows higher rates than those in the EU27 (12.9 per cent), and considerably higher than the UK's 2.4 per cent, and almost the same as the 15.8 per cent of economic crisis-stricken Greece.
Percentage who cannot afford one meal with meat, chicken or fish (or vegetarian equivalent) Source: Data for 2013 by SILC/Eurostat. Percentage below/above medium equivalised income.

The UK PSE study (Gannon and Bailey, Reference Gannon and Bailey2014) also asked about food-related necessities of life that point to the social aspects of food consumption and food-related activities which support social inclusion. Most of these activities were only asked in relation to adults: to dine out once a month is seen as essential by 25 per cent, going out socially once a fortnight by 34 per cent and going out for a drink once a fortnight by 17 per cent. Two more items were asked for adults and children alike: 80 per cent consider celebrations on special occasions as essential for adults and 91 per cent for children; having friends or family round once a month is seen as an adult necessity by 46 per cent, and 49 per cent see having friends round once a fortnight as essential for children (ibid.: 328–9). Thus, even if the social aspects of eating are not essential for nutritional wellbeing, the possibility to eat with others, offering hospitality, and being able to share food outside the home, appear to be regarded as an essential and significant part of people's lives at every age. This chimes with our previous argument, that to be able to afford meals at home is just one side of not being poor (Pfeiffer et al., Reference Pfeiffer, Ritter and Hirseland2011); ‘alimentary participation’ (ibid.), which refers to the possibility of experiencing the social function of food, by eating outside the home, and/or together with others, is something from which poor people are significantly excluded.
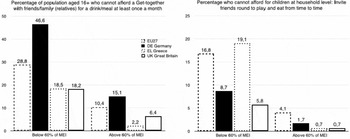
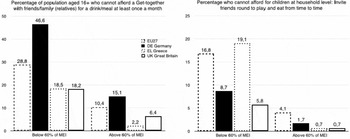
There are not many clear questions about ‘eating out’ occasions in the SILC/Eurostat dataset. However, there are some hints, as one question asks whether people can or cannot afford a ‘get-together’ with friends or family for a drink/meal at least once a month (or for children, invitations to play and eat with friends from time to time). The data are presented in Figure 3, which shows remarkably high percentages for Germany, particularly among those whose income falls below 60 per cent of MEI, with 46.6 per cent unable to afford a drink or meal with others at least once a month. This is a much higher percentage than in the EU27 (28.8 per cent), Greece (18.5 per cent) or the UK (18.2 per cent), although these are all averages for the whole populations. Even in the population with incomes above 60 per cent of MEI, Germany shows a higher percentage of people who cannot afford drinking and/or eating in company. Although it might be argued that there are cultural differences in the social importance of shared meals or drinking in company across Europe, and that perhaps Germans place less emphasis on this aspect of social behaviour, the size of the difference between Germany and the averages of the other countries chosen for comparison, for the population whose income is below 60 per cent of MEI, suggests there are substantial issues of inequality in Germany, rather than mere cultural distinctions. The percentage of households that cannot afford children's invitations is considerably lower than the proportion unable to afford conviviality for adults, below the EU27 average (16.8 per cent) and 19.1 per cent for Greece, but at 8.7 per cent in households with incomes below, and 1.7 per cent in those above 60 per cent of MEI, the percentages in Germany are higher than in the UK (which are 5.8 per cent and 0.7 per cent respectively). These data imply that people with low incomes have very limited access to social eating activities and are, thus, excluded from this part of social life. Although such food practices have increasingly been regarded as essential in modern and individualised consumer societies (Pfeiffer et al., Reference Pfeiffer, Ritter and Hirseland2011), previous studies have largely omitted investigation of such social aspects of food poverty.
Eating with friends and family Source: Data for 2013 by SILC/Eurostat. Percentage below/above medium equivalised income.
To sum up, these data, although only partial indicators of the more complex social realities associated with changed or reduced patterns of food consumption, enforced poverty behaviours and exclusions, strongly suggest that, despite the relative success of Germany's economy in coping with the economic crisis, there is a sizeable proportion of the population which is experiencing occasional hunger and is stricken by food insecurity, including the loss of opportunity to exchange and socialise around food. As delegation, denial, and stigmatisation are still the predominant societal strategies for tackling food insecurity in Germany, those thus affected are required to find their own solutions in their daily life. The next section offers qualitative insight into these efforts.
Coping with food scarcity
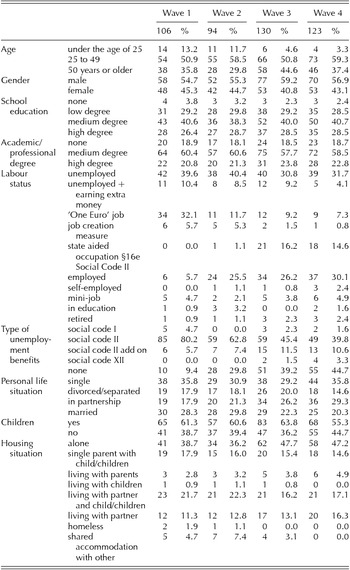
In order to examine how people in Germany actually deal with a situation of food and nutritional scarcity and alimentary exclusion, we present results based on analyses from qualitative research which aimed to explore the patterns of poverty dynamics and their connections to institutional processes of poverty prevention, alleviation and reduction (for methodological details see Pfeiffer et al., Reference Pfeiffer, Ritter and Hirseland2011). The research started in January 2006 and concluded in January 2012. As eating out is almost completely skipped by the interviewees, we concentrate here on food consumption patterns in the household. In the longitudinal qualitative study, 106 people, mostly welfare recipients, were initially recruited, and were interviewed several times over a period of five years, using biographical in-depth interviews (Rosenthal, Reference Rosenthal, Seale, Giampieto, Gubrium and Silverman2004). Most interviews took place in the interviewees’ home environment. The sampling strategies employed enabled us to generate a well-balanced sample in terms of age, gender, regional labour market, and educational and labour status.Footnote 5 The study focused on the situation in terms of personal lives, children and housing (see Table 1). To analyse the transcribed material of 453 qualitative interviews, we used Qualitative Content Analysis (Mayring, Reference Mayring2000).
Sample overview

Through our analyses the empirical material provided information on how people who were dependent on social welfare dealt with a situation that seemed, at least by the end of each month, to be tantamount to food and nutritional poverty. Interpretation of our in-depth interviews, as well as case comparisons, revealed a variety of interacting conditions that shaped the ways in which the interviewees were coping with a seriously restricted nutritional situation. We summarise these here in terms of four important conditional factors which we derived from the data; these four sets of factors effect different coping strategies at different levels, while remaining entwined with each other.
First of all, there are naturally objective factors that can restrict or support food and nutritional circumstances. Depending on the infrastructural conditions, the possibilities of accessing food banks are more or less likely. In urban regions, for example, public transport improves mobility, which potentially leads to better access to food banks; on the other hand, it is more difficult for people living in big cities to find cultivable land in order to be able to grow fruits and vegetables for home consumption. Objective factors also include having appropriate facilities for food storage and cooking. Thus, these objective factors represent structural circumstances that primarily result from, and coexist with, social and political circumstances that shape the experience of social welfare conditions in Germany.
Secondly, we identified important subjective factors, which initially have to be considered independently from the objective factors described above. For example, emerging initially from the analysis are things such as the overall attitude to food and eating, which is in turn dependent on variables such as ‘lifestyle’, eating culture, shopping patterns and health awareness. This overall attitude furthermore can be used to explain varieties of eating behaviours developed earlier in life and are somewhat independent from the financial restrictions they experience later in life. This is particularly the case when interpreting data on people who become poor later in the life course, whose eating patterns show a similar variation to that of the overall population. In order to explain and evaluate capacities for dealing with food insecurity, deeply held views and practices over eating patterns had to be taken into consideration, along with issues of reluctance and shame, in understanding, for instance, the use of food banks. Finally, there are individual capabilities, such as household and money management and cooking skills, which affect the ways in which people deal with restricted income and limited food supply.
Thirdly, there are medical factors, which can be both the reason for, as well as the result of, restricted access to food. People who have an illness or who are allergic to certain substances, and therefore depend on special diets, need to spend more money in order to ensure adequate nutrition. If money is short, such people are likely to endanger their health. Furthermore, people who are not able to afford healthy food are in fact more likely to suffer from chronic diseases. Of course, being unable to buy appropriate food for health is not the only factor contributing to poor health outcomes, but the implications of nutritional poverty for health are not only important in the short-term, in that they can have immediate consequences, but also because possible longer-term risks to health are likely to compound the other problems experienced by those living in poverty.
Finally, we extracted factors of sociality, which are primarily represented in social networks like family bonds or circles of friends. The range and intensity of these networks, as well as the attitude towards caring for others or being cared for, represents social integration, which is a fundamental for human wellbeing. Such social engagement around food can of course be helpful where it offers possibilities of help in sharing food, but it may also result in an additional burden for those suffering from nutritional poverty in that they have little to offer in return, and thus cannot meet social obligations, from which they eventually withdraw. Thus, going beyond simple material inadequacies, nutritional poverty has to include loss of eating with others as a fundamental, deeply social act; its definition has to go beyond mere sufficiency of eating, to include shopping, preparing food and getting together for hospitality and sharing. It is important that both the possibilities for time to achieve these things and social inclusion itself form part of the understanding.
The way these conditions are intertwined with each other was further elaborated in an additional stage of our analysis. In a dialectical and dynamic form of ongoing transformation in people's biographies, as their underlying conditions and circumstances worsened and became more embedded, it became clear that the conditions contributed both as the reasons for, and the results of, different individual coping ‘types’. In order to understand these better, and in recognition of the heterogeneity of coping strategies in relation to food employed by those who are poor, we drew on three analytical dimensions of nutrition and alimentary experiences; biographical acquisition of eating habits; and overall food related capabilities. This analysis enabled us to identify eight relatively distinct individual ‘coping typologies’, which can be characterised as followed:
Against the odds: This coping type actively deals with the objective circumstances of not having enough money to maintain a sufficient food supply, in terms of either quality or quantity. Falling back on food banks happens whenever possible, and is seen as pragmatic and not shameful. Nevertheless, welfare recipients often perceive the need to pay back what has been received or to contribute in return, for example, by volunteering at food banks. While this coping type tries to make the best of the situation, people still often have to cut back, depending on the individual attitude towards food and nutrition.
Children first: Faced with subjective feelings of severe restriction of food supply within the family, parents prioritise taking care of children at the expense of their own nutrition. They behave this way not only because they want to provide their children with good and healthy food, but also because they are motivated by a desire to engender nutritional experiences that can lead to greater subjective nutritional competence. Parents who want their children to develop a certain sense of taste have to supply a broad variety of different foods, a food experiment which is risky under financial restrictions not only because unknown/exotic food is more expensive, but because of the risk of children not liking it. Nevertheless, to enable their children to experience different foodstuffs, these parents are willing to make a sacrifice of their own nutrition.
Abandonment of quality: Another coping strategy to deal with financial restrictions for food is to allow a lowering of food quality. In nutritional circumstances which are not likely to improve, people can prioritise quantity over quality, not to consume more food but sometimes just to eat enough. In addition, food which is sweet and/or fatty can be comforting and at least assures temporary satisfaction of needs. A (forced) decision leading to lower quality can be viewed in a fatalistic way, so that social and health factors are overshadowed by perceived necessity, and food of low quality is consumed in spite of anticipation of serious risks to health.
Abandonment of quantity: In contrast, there is also a coping strategy grounded in lowering the quantity of food. Where a fatalistic or resigned attitude does not develop over time, the requirement of a special diet is an important reason for following this strategy. In addition to medical reasons, subjective reasons can be strong as well, ideological or religious justifications often being cited, including a chance to demonstrate preference for a more environmentally sustainable lifestyle, which might lead to changes in food choice, and in particular to intakes of specific types of food being reduced (such as meat), if possible.
Surfing the ‘ups and downs’: In contrast to the coping strategies described above, initially there is no change in food purchase or eating habits here. Such an approach cannot be explained rationally, logic dictates that there is not enough money to sustain such a strategy over the month, but it nevertheless shows a deep need for a certain way of eating. By simulating normality at the beginning of the month at least, with regular spiralling downward to an increasingly restricted nutritional diet (for example, living on noodles or just toast) as finances are increasingly restricted, people demonstrate how much they value being able to choose their eating behaviours.
Embracing nutrition for sense and structure: This coping strategy, more than others, relies on people having certain skills and mind-set. Thus, people who have developed an affinity with cooking, eating, enjoying food and even managing limited food supplies, so love cooking that they are constantly motivated to improve their skills, even though their food supply is restricted. Such skills can facilitate practical solutions as long as household resources for preserving and cooking food are available and sustainable (they can be repaired if broken). Some interviewees developed this affinity and the corresponding skills for budgeting, cooking and enjoying the challenge of managing on less money, only after becoming unemployed and experiencing financial restrictions and loss of time structure for the first time in their lives. Eating and cooking here are experienced as deeply social activities: preparing food, decorating the table and eating together with others are often bound by culture and tradition. For them, learning where to get cheap and healthy food has become a meaningful and important duty, providing sense and structure to the day. Such people do not miss eating out as much as others do, and since food and cooking are considered to be very important and with a lot of effort put into them, enhancing the daily routine on special occasions such as birthdays becomes a particularly difficult endeavour under tight financial restrictions.
Enforcing networks: In order to maintain their food intake these people try to enforce their social networks, visiting parents, children and friends not only to reinforce social relations but to improve their nutritional wellbeing. Some interviewees even spoke of reviving family relationships which had previously been damaged by conflict, engaging with people they would despise under different circumstances, just so as to be able to eat substantial meals every now and then. However, this coping strategy is often quite short-lived, since it is difficult to sustain social relationships where one's financial conditions are limited, both because reciprocity is difficult and because social contacts and networks become one-sided and burdensome (to both sides).
Risky food financing: Due to insufficient economic resources some people try to enhance their food supply in ways which are potentially risky, such as exploiting their own body (for example, giving blood, for which one is paid in Germany) or through illegal work. In some cases the evident contradiction between risking one's health in order to ensure a healthy food supply was acknowledged by interviewees, but fatalistically accepted as unavoidable.
Beyond individual coping: food insecurity and social policy
We have provided some current quantitative data on food insecurity in Germany and supplemented them with qualitative evidence on attempts at nutritional coping strategies. Indeed, for all the different strategies which people adopted to try and cope one thing seems to hold true: as long as people have to rely on social security benefits, they are very likely to suffer from rigid constraints on social participation where food is concerned, even amounting to social exclusion. Such social participation in food practices in modern consumer societies is a complex problem for the poor, leading to daily experiences of exclusion that no individual coping strategy can compensate for satisfactorily.
Our qualitative data also show that the German government's delegation of responsibility to the third sector or to food banks to provide for household food security is not at all sufficient, and indeed disguises the problem. What is needed is the political will to fight increasing inequality, and government action which generates redistribution of wealth and thus household level capabilities of meeting food needs.
Nevertheless, the evidence provided sheds a first light on food consumption patterns, and food management practices, in unemployed German households. It highlights the urgent need for research to be extended both to address the complex interrelations between food choice and other aspects of poverty behaviours, and to include other population groups that are also at risk of food poverty, such as migrants from other European regions, refugees or homeless people. Understanding individual day-to-day practices and attempts at coping strategies will help to develop appropriate social policy strategies which do not undermine what people are already trying to do, and which ultimately minimise household food insecurity, not only in Germany but also throughout Europe. This will, of course, depend on the political will to address the issues. In practice, social transfers are more often part of consolidation plans designed to address the previous crisis than other areas of public spending (OECD, 2014: 43), and therefore spending cuts are more likely to hurt the poor (ibid.: 53). As long as wealth redistribution and sufficiency of income are not on the agenda of German and European policy makers, household food insecurity will remain a problem, and thus we unfortunately face good reasons to continue in this line of research.
Acknowledgement
This article was made possible by the research framework of the third ‘Reporting on Socioeconomic Development in Germany – soeb’,Footnote 6 funded by the German Federal Ministry of Education and Research.