Introduction
Genetic improvement of crop plants, including wheat relies heavily on the availability of diverse and superior genes/alleles. Wheat germplasm representing wide spectrum of genetic variability for different traits is also useful for identification of marker–trait associations through association mapping. However, it has been argued that modern plant breeding has led to narrowing of genetic diversity in crop cultivars leading to their genetic homogeneity and possible vulnerability to biotic and abiotic stresses. Therefore, it is important to understand the genetic structure and level of diversity in the available wheat cultivars, before initiating meaningful study on marker–trait associations.
Terminal heat stress during crop growth is a main environmental factor that reduces the grain yield (GY) because of early senescence and acceleration of grain filling activities in wheat (Paulsen, Reference Paulsen, Boote, Bennett, Sinclair and Paulsen1994) and shortening grain filling duration (GFD) along with constriction of carbon assimilation. Kernel weight loss was reported up to the tune of 23% when the temperature was increased from 15 to 20°C (day/night) to 40 to 15°C (day/night) on the third day after anthesis (Stone and Nicolas, Reference Stone and Nicolas1994). About 51% of Indo-Gangetic plain (IGP) might be reclassified as a heat-stressed, short-season production mega-environment by 2050 (Ortiz et al., Reference Ortiz, Sayre, Govaertsa, Gupta, Subbarao, Ban, Hodson, Dixon, Monasterio and Reynolds2008). Therefore, there is need to develop genotypes suited to these adverse environments. Availability of genetic diversity for these traits is pre-requisite to develop genotypes for the targeted environment. Studying variation among the germplasm lines of known potentialities can generate information helpful to the breeders to choose suitable parents for purposeful hybridization. Physiological as well as agronomical traits have become a target for plant breeders aiming to improve yield potential under environmental stress. Cell membrane stability (CMS), canopy temperature depressions (CTDs) are some of the traits, which can help in identification of donors at the early stage (Saadalla et al., Reference Saadalla, Shanahan and Quick1990; Reynolds et al., Reference Reynolds, Nagarajan, Razzaque and Ageeb1997). Incorporating molecular markers and physiological criteria could further facilitates the identification of elite germplasm, new alleles and expedite the breeding efforts in improving heat tolerance. Efforts have been undertaken to improve heat tolerance of wheat through traditional breeding programmes, but few studies have utilized both molecular characterization and physiological traits for the characterization of genetic diversity (Semenov and Halford, Reference Semenov and Halford2009). There is limited knowledge of the genetic basis of morpho-physiological traits and molecular marker linked to heat tolerance in wheat.
Heat tolerance, being a complex trait, it is not easy to identify heat tolerance wheat lines through phenotyping, therefore marker-assisted selection is considered as an effective tool in this context. Present study was undertaken to determine the genetic variation in 30 diverse Indian wheat genotypes using morpho-physiological traits associated with heat tolerance and classify them based on polymorphic molecular markers underlying the observed phenotypic traits. Information generated will be utilized in order to recommend suitable genotypes for wheat breeding programmes for the development of high-yielding, stable and heat-tolerant genotypes.
Material and methods
Plant material
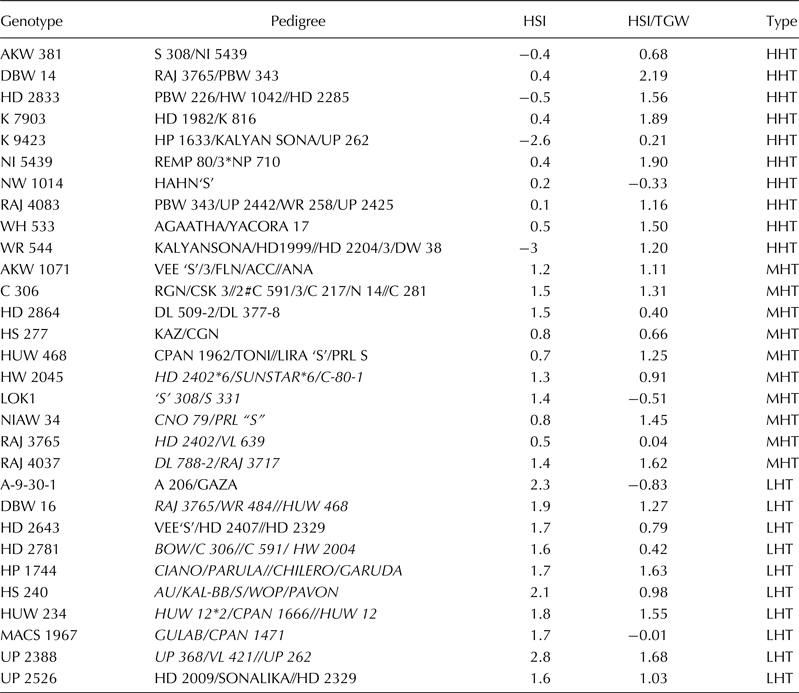
The experimental material consisted of 30 diverse wheat cultivars, procured from Germplasm Unit, ICAR-Indian Institute of Wheat and Barley Research, Karnal. Pedigree details of these lines are given in Table 1.
Genotypes used in this study categorized as per HSI value

Site of experiments
The experiments were conducted at Research farm of Indian Institute of Wheat and Barley Research, Karnal (latitude 29°43′N, longitude 76°48′E, altitude, 245 m) during 2011–2012 and 2012–2013 crop seasons. These genotypes were evaluated for two consecutive crop seasons and two conditions; non-stress (November 20 timely sowing) and stress (December 16 for late sowing) using RCBD with three replications. The plot size was 2.4 m−2 with four rows of 2 m length and 0.3 spacing. Fertilizer and irrigation were applied as per recommendations.
Phenotyping and data recording
Plants were scored for GY and its components, phenological and physiological traits viz: days to heading (DH), days to anthesis, days to maturity (DM), GFD, plant height (PHT), productive tillers (PTL), number of grains per spike (GN), grain weight per spike (GW), thousand grain weight (TGW) and GY, CTD and cell membrane stability (CMS). Phenological traits were recorded at 50% of the stage. GN and GW were determined on five randomly selected spikes from each plot. GY was measured after harvesting plots at maturity. TGW was measured by taking random samples of 500 grains from plot yield and weighed. Biomass (BM) or biological yield was measured after harvesting plots at maturity in field itself using spring balance. CTD1 was recorded at anthesis and CTD2 at 15 days after anthesis using infra-red thermometer (Everest make). CMS was estimated following method given by Blum and Ebercon (Reference Blum and Ebercon1981) by measuring cell electrolyte leakage.
To better characterize the heat stress effect, heat susceptibility index (HSI) was calculated The HSI is defined as
 $${\rm HSI} = [1 - (Y_{\rm s}/Y_{\rm t})/(1 - X_{\rm s}/X_{\rm t})],$$
where Y s is the grain yield under stress, Y t is the grain yield under non-stress, X s and X t are the mean yields of all genotypes under stress and non-stress conditions, respectively (Fischer and Maurer, Reference Fischer and Maurer1978).
DNA extraction and PCR amplification
About 5–10 seeds of each of the genotypes with identical dimensions were selected by visual observation, washed then surface sterilized by 0.1% HgCl2 for 2 min and germinated on filter papers in dark at room temperature. After germination, seedlings were grown for 9 days in growth chamber under conditions with 16 h light, 500 µmol m−2 s−1 fluorescent light, 22.15°C day/night temperature and 60% humidity.
DNA extraction was performed using CTAB (Doyle and Doyle, Reference Doyle and Doyle1990) with little modifications (Sharma et al., Reference Sharma, Sareen, Saini, Verma, Tyagi and Sharma2014). Young leaves of nine days old seedlings were grounded in 1.33 × CTAB buffer and incubated at 65°C for 30 min. The concentration and quality of the purified DNA was evaluated both by 0.8% agarose gel electrophoresis. PCR amplification was performed with 125 simple sequence repeats (SSRs) (Roder et al., Reference Roder, Korzun, Wendehake, Plaschke, Tixier, Leroy and Ganal1998) and 38 inter-simple sequence repeat (ISSR) markers (University of British Columbia, Vancouver, Canada). The PCR reaction were performed in 20 µl volume containing 25 ng template DNA, 1 × PCR buffer (10 mM Tris pH 9.0, 50 mM KCl, 1.5 mM MgCl2), 200 µM of each dNTP, 0.6 U Taq DNA polymerase (Merck Chemicals) and 10 µM primer each. PCR programme was run on Gradient thermal cycler S 1000 TM (BioRad). PCR amplification was performed with initial denaturation at 94°C for 5 min, followed by 35 cycle of 30 s at 94°C, 1 min at annealing temperature 55–60°C, 1 min elongation at 72°C and final extension at 72°C for 10 min. The amplified PCR products were electrophoresis in 0.5 × TAE buffer at 70 V on a 2.0% agarose gel. Gels were stained with ethidium bromide and DNA bands were visualized under UV light using Gel Documentation System (Alpha Imager, Systems and Control). The size of amplification bands were estimated by comparison with a 100-bp standard molecular weight (Merck Chemicals).
Data analysis
Analysis of variance (ANOVA), mean comparisons, correlation and dendrogram were performed using Statically Analysis System (SAS 9.3 NC).The DNA fingerprint patterns obtained were converted into binary data matrices containing arrays of 0s and 1s. The SSR and ISSR bands were scored visually for the presence (1) or absence (0) of bands of various mol. wt. sizes. Only polymorphic and reproducible bands were considered for the further analysis. The allele number, gene diversity, heterozygosity and polymorphic information content (PIC) (Botstein et al. (Reference Botstein, White, Skolnick and Davis1980) were calculated for both SSR and ISSR marker using Power marker software (Liu and Muse, Reference Liu and Muse2005). The similarity matrix and distance matrix were calculated and UPGMA tree was constructed by Tessel software (www.maizegenetics.net/tassel). The software XLSTAT showed principle component analysis and the software structure was applied to show the cluster of similar genotypes. Inter- and intra-variety genetic diversity was calculated by the POPGENE (Yeh et al., Reference Yeh, Yang, Boyle, Ye and Mao1999). Analysis of molecular variance (AMOVA) was calculated by arlequin31 (Excoffier et al., Reference Excoffier, Laval and Schneider2005).
Results
Phenotypic data analysis and genetic correlations
The ANOVA revealed substantial variation among genotypes for most of the traits studied. The conditions were also significantly different. However, G × E interaction was significant for DM, GFD and biomass (online Supplementary Table S1). Significant differences were recorded among genotypes for their performance under normal and stress environments.
The daily temperatures during the experimental period indicate that the grain growth period (GFD) in late sown experiments was featured by higher temperatures as compared with the normal sown wheat (online Supplementary Fig. S1). The mean minimum and maximum temperatures during grain growth period were higher by 2.3 and 2.6°C under stressed condition as compared with non-stressed (normal) condition. Total rainfall during grain growth period under timely and late sown conditions was 7.9 and 18.7 mm, respectively.
The HSI for GY ranged from −3.0 to 2.8 and for TGW between −0.8 and 2.2 (Table 1). Genotypes with HSI value <0.55 were considered as highly tolerant (HHT), those with values between 0.556 and 1.50 were moderately tolerant (MHT) and those with more than 1.5 were susceptible (LHT).
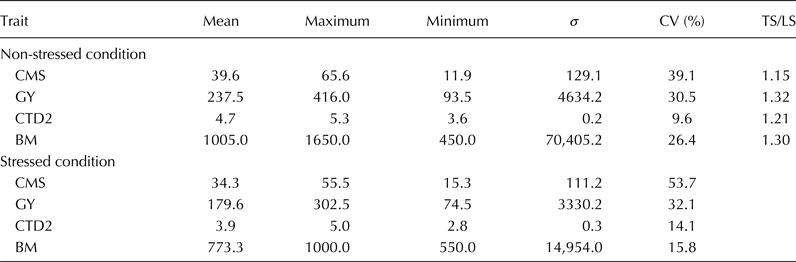
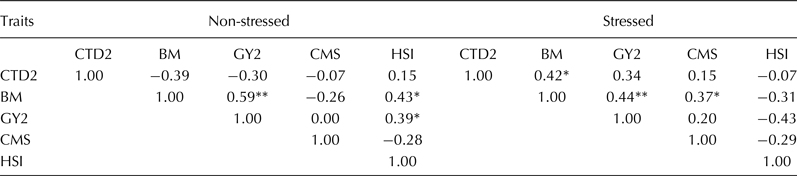
Various traits observed in this study under non-stressed and stressed conditions demonstrate that CMS, GY, CTD2 and BM showed a significant correlation with each other as shown in Table 2. Brief information of CTD2 and other traits in which CTD2 varied from 3.6 to 5.3 with mean of 4.7 in non-stress condition is given in Table 2. The average values of per cent reduction for CMS, CTD2 and BM under stress conditions were 15.5, 17.5 and 23.1, respectively (online Supplementary Table S2). Here the BM has shown the sensitivity towards the heat stress than CMS and CTD2. Pearson correlation coefficients were calculated for all the combinations (Table 3). GY (0.59) and HSI (0.43) showed the positive and significant correlation with BM in non-stress condition, while under stress condition, CTD2 was significantly correlated with BM (0.42) and BM had a positive correlation with GY2 (0.44) and CMS (0.37).
Descriptive statistics and variance parameters estimated for CMS, SI, GY, CTD2 and BM studied under stressed and non-stressed conditions at Karnal, Haryana during 2011–2012 & 2012–2013

CMS, cell membrane stability; GY, grain yield; CTD, canopy temperature depression; BM, biomass; TS, timely sown; LS, late sown.
Pearson correlation coefficients among functional traits evaluated for non-stress and stress conditions at the experimental farm, Karnal, Haryana during 2011–2012 and 2012–2013

*, **Significant at P = 0.05 and P = 0.01, respectively.
Genotypic data analysis
Out of 38 ISSR, 28 were found polymorphic and maximum of 12 alleles were observed. The mean value of PIC was 0.30 with a range of 0.12–0.41 for the markers UBC834 and UBC849, respectively. Its percentage of polymorphism was ranged between 83 and 100%. The maximum similarity matrix in ISSR was 82.4% and minimum distance matrix was 17.6% between the genotypes WR 544 and AKW381.
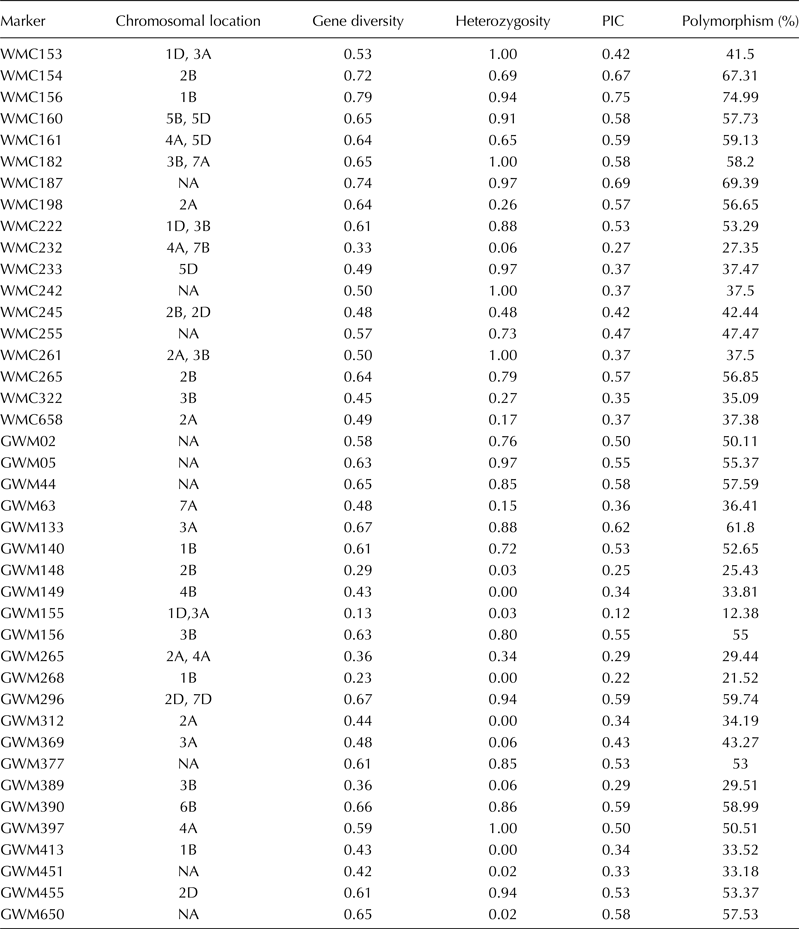
Similarly, out of 125 SSR only 41 found polymorphic were distributed across the different wheat chromosome (Table 4). Maximum number of allele amplified was 5.0 and mean value of PIC was 0.39 with a range of 0.13–0.75 for the markers Xgwm155 and wmc156, percentage of polymorphism was ~12.38–75% followed by average gene diversity of 0.46. Phenotypic traits values in 30 genotypes divided into high, medium and low heat tolerance groups (Table 1). Based on HSI index and phylogenetic analysis, unrooted neighbour-joining tree was constructed using Tessel Software showed three main clusters (online Supplementary Fig. S2).
Chromosomal location, gene diversity, heterozygosity, PIC and its percentage for 41 SSR markers

Heat tolerance patterns of SSR polymorphism and genetic diversity
In order to characterise the genetic diversity of the three HSI groups, total number of alleles and genetic diversity were determined (online Supplementary Table S3). Total number of alleles (138) and mean alleles per locus (5.52) were the highest for the HHT group and were similar to those in the MHT group (118 and 4.75, respectively) than for LHT groups.
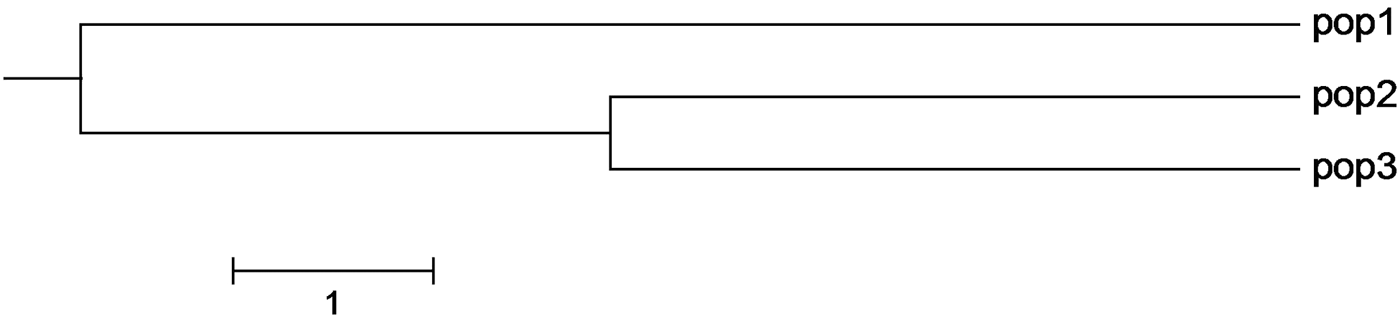
The results of AMOVA for three heat-tolerant groups are shown in online Supplementary Fig. S3. The variance component for all the groups represents only 5.32% of the total variations (P < 0.001). The large majority of genetic diversity was found within (97.3%) rather than among (3.7%) the groups. Pairwise F st values between the LHT and HHT groups were statistically significant (P < 0.05). Similar studies were reported in wheat (Shi et al., Reference Shi, Yang, Chen and Guo2007). The results of AMOVA for the stress tolerance effect on three groups are shown in online Supplementary Table S4 and variation within group component was highly predominant (91.21%). Overall, such genetic variation was reported in wheat cultivars from different regions of the world (Roussel et al., Reference Roussel, Koenig, Beckert and Balfourier2004; Prasad et al., Reference Prasad, Babar, Xu, Bai and Klatt2009). Similar results were obtained from AMOVA for the population effect using ISSR markers. For a better understanding of the genetic diversity within the population, the relatedness of the genotypes was investigated using population structure analysis. Three major subgroups of wheat varieties were identified using the program STRUCTURE. To estimate the relationship between the three Sub-Population. The genetic distance and Identity was calculated by the Nei's unbiased measure (Nei, Reference Nei1978) (Fig. 1) and confirmed by PCA (data not shown). Cluster I encompasses genotypes possessing HHT, while clusters II and III represent genotypes having MHT and LHT, respectively.
UPGMA dendrogram based on genetic distance, which represent the sub-population as obtained through STRUCTURE analysis.

Cluster analysis based on phenotypic data and molecular markers
The clustering differentiates tolerance and susceptible genotypes derived from susceptibility index data are shown in online Supplementary Fig. S5. Majority of the genotypes were grouped into two major clusters except for the genotypes K 9423 and WR 544, which did not fall in any group. Cluster I encompasses of 16 genotypes, while cluster II of 12 genotypes. Distance between clusters ranged between 0.001 and 0.76. Similar clustering was also obtained while data retrieved from other traits as shown in online Supplementary Figs S6–S8. The dendrogram derived from markers (ISSR and SSR) based data assigned the genotypes into three groups (online Supplementary Fig. S2). Principal component analysis was done to determine the relationship among the wheat genotypes in terms of their relative position to two coordinate axes. The plot of first and second components accounted for 34.63 and 25.57% of the variation, giving a cumulative variation of 60.19% (online Supplementary Fig. S9).
Cluster analysis based on markers data partly reflects the zone-wise basis of the 30 genotypes distribution pattern (Fig. 2). Similarly, clustering of genotypes according to the geographical origin also did not predict genetic differentiation very well in other studies (Kobiljski et al., Reference Kobiljski, Quarrie, Dencic, Kirby and Ivege2002; Yifru et al., Reference Yifru, Hammer, Huang and Röder2006; Sun et al., Reference Sun, Luo, Fu and Huang2013; Vinu et al., Reference Vinu, Singh, Vasudev, Yadava, Kumar, Naresh, Bhat and Prabhu2013). Similarly, SSR and ISSR-based cluster analysis also did not clearly differentiate our genotypes accordingly to the TOL level.
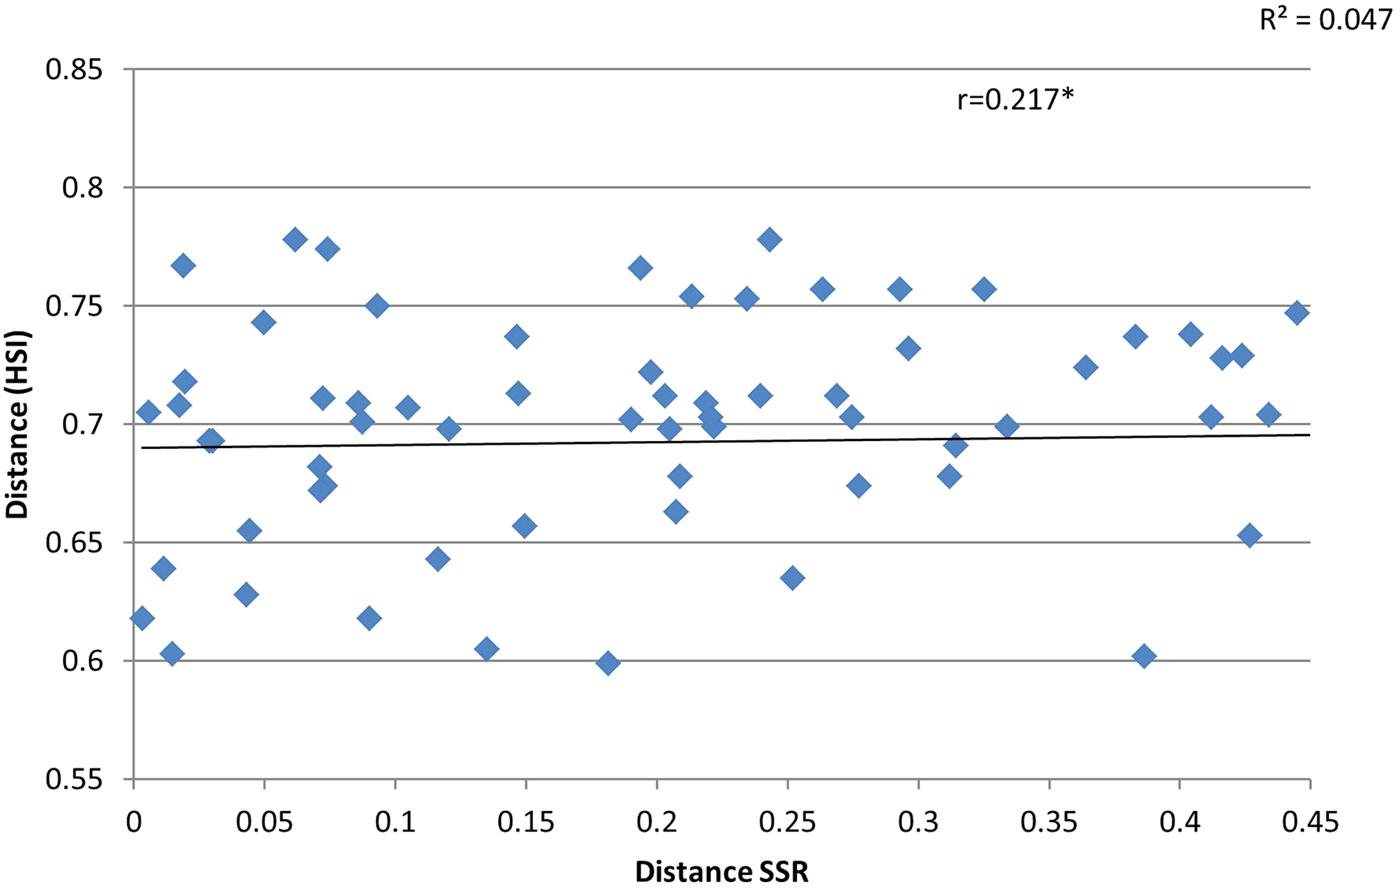
Relationship between phenotypic and genotypic distance in 30 wheat genotypes.

The graph plotted amongst the phenotypic and molecular distances showed a positive and significant relationship, which includes display low distance association (Fig. 2). Some asymmetry can be observed in the sense that phenotypic similarity can be associated with rather higher genetic divergence, whereas the reverse was not clearly observed (Rebourg et al., Reference Rebourg, Gouesnard and Charcosset2001)
Discussion
Terminal heat tolerance is an potential threat for global wheat production in perspective of global warming with a major effect on rice–wheat cropping system especially in Eastern Indo-Gangetic plains (IGP) of India (Joshi et al., Reference Joshi, Mishra, Chatrath, Ferrara and Singh2007). The primary goal of the study was to examine genetic diversity among 30 diverse wheat genotype along with their morphological, physiological and GY-related traits associated with heat tolerance. This study has shown that coefficient of variance for CMS was higher as compared with other traits in case of non-stress and stress conditions. Under non-stress conditions, the maximum significant correlation was found between DM and DH (0.96) while at stress, it was found between CTD1 and CTD2 (0.91). Reduction in BM under stress-conditions showed significant correlation with HSI. BM also showed a positive correlation with CTD1, GY and CMS. In case of non-stressed conditions, BM showed significant correlation with GN (0.35), GW (0.37), GY (0.59) and HSI (0.43). Particularly CMS, GY and biomass was higher for HHT under stress condition. Minimum HSI shown by the variety WR 544 was considered as highly tolerant wheat variety, while maximum HSI presented by UP 2388 categorized as highly susceptible.
Molecular analysis among the three groups showed that genetic diversity was higher in the HHT group than in the LHT. The HHT group was characterized with more CMS, GY, CTD2 and BM than the LHT group in both environments (online Supplementary Table S3). The lower level of polymorphism in the LHT group may be attributed to the narrower genetic diversity of this group, as six of them represent same area of adoption (NEPZ). The results of AMOVA for the three TOL groups revealed large variation among the genotypes within a group enabling diverse genotypes with HHT (Table 1) to be used in selecting parents for future wheat breeding programme.
The PIC values that estimate the discriminating ability of any locus by considering the number of alleles per locus and their relative frequency varied according to markers (Anderson et al., Reference Anderson, Churchill, Autrique, Tanksley and Sorrells1993). PIC for ISSR ranged from 0.12 to 0.41 with an average of 0.30. Similarly PIC for SSR ranged from 0.12 to 0.75 with an average of 0.39. This average PIC were similar to those reported in Italian emmer wheat accessions by Pagnotta et al. (Reference Pagnotta, Mondini and Atallah2005), but lower than the value of 0.62 was also reported by Teklu et al. (Reference Teklu, Hammer, Huang and Roder2006). Considering polymorphism, the chosen markers are very informative. The marker Xgwm63-7A (PIC = 0.364) and Xgwm133-6B (PIC = 0.618) have been previously reported to be linked with the QTL for heat tolerance in wheat (Mohammadi et al., Reference Mohammadi, Zali and Bihamta2008). Therefor these markers could be exploited in wheat breeding programme for heat tolerance.
Cluster analysis based on the SSR and ISSR data assigned the genotypes into three major groups and HHT genotypes are distributed all clusters, which specify that diverse genetic genotypes were identified in HHT category. Therefore, it is tempting to speculate that genetic basis of TOL in these ten genotypes is different.
Phenotypic clustering was also carried out for genotypes based on HSI and other traits (online Supplementary Figs. S5–S8). Twenty-eight wheat genotypes were grouped into two clusters of which 16 in cluster I (LHT) and 12 genotypes in cluster II (HHT and LHT) except for genotypes K 9423 and WR based on HSI (online Supplementary Fig. S5). Likewise clustering based on CMS, phenological traits and CTD also have two clusters with 27, 3 and 24, 5 and 1 separated genotype respectively CMS, 26 genotypes were grouped into two clusters of 14 and 12 genotypes and three tolerant genotypes and one moderate tolerant genotype were separated from the cluster of 26 genotypes. Unlike on the basis of molecular markers, genotypes were distributed randomly in the clusters and genetically dissimilar genotypes were identified with other groups, which showed that genetic basis of heat tolerance in these genotypes is different.
The results showed by gene differentiation (G st) was also one of the important parameter for variation among the population, inter variety genetic diversity (D st = 0.0158 for ISSR and 0.0199 for SSR) was very low, subsequently the coefficient of genetic differentiation G st (0.0631 in ISSR and 0.0837 in SSR) in both cases was also low. This shows that 6.3% variability was among the population, most of variation (93.7%) was present within the population. For SSR, (8.3%) variability was present among the population, and (91.7%) was present within the population. The genetic identity and distance based on molecular markers analysis reflected the relationship among genotypes from three different groups (online Supplementary Table S5). The minimum value of genetic distance between groups I and II was 0.0186 and the value of genetic identity was 0.9815 for SSR and groups II and III showed greater genetic distance (0.0304) and lowest genetic identity (0.9701) indicating that they are genetically dissimilar. In case of ISSR, greater genetic distance and lowest genetic identity was shown by groups II and III. Variability and genetic differentiation was found to be inversely proportional to gene flow (Matallana et al., Reference Matallana, Garcia, Gracia and Jaramillo2009; Wang et al., Reference Wang, Hou, Zhang, Yang, Feng, Li and Ren2012). Nm value <1 may restrict the gene flow among population, which lead to low variability among group. Hence, the value of Nm was (ISSR = 7.4, SSR = 5.4) higher, which leads to genetic exchange among the population might have low differentiation. On the basis of molecular characterization, HHT had shown the higher variance as compared with LHT. In our study, the results revealed large genetic variation among genotypes within a group. This indicates the long-term survival of the species and can be used for selecting the heat tolerant genotypes for further research.
In this study, correlation between phenotypic and genotypic distances was positive and significant (r = 0.22*) but low similarly, significant results with low correlation of phenotypic data with molecular diversity (r = 0.21**) was reported by Fufa et al. (Reference Fufa, Baenziger, Beecher, Dweikat, Graybosh and Eskridge2005) using 51 SSR markers and ten morphological traits in 30 bread wheat cultivars. This positive correlation is important since morphological traits continue to be an effective way of regularly evaluating several wheat elite lines derived in a breeding programme for breeders.
Conclusion
Our study identified significant genetic variation with regard to heat tolerance among 30 wheat genotypes based on phenotypic traits and molecular markers. However, ISSRs and SSRs were useful for characterizing genetic relatedness but could not distinguish the level of tolerance. Our results demonstrate that combination of molecular markers and morpho-physiological analysis could be useful approach to describe the genetic variation in heat tolerance. Genetically diverse wheat genotypes were identified as having high heat tolerance provides the great potential to bred heat tolerance wheat varieties. This information will be useful to identify new source of tolerance for breeding programme for improved wheat varieties suited the challenges posed by a changing climate.
Supplementary material
The supplementary material for this article can be found at http://dx.doi.org/10.1017/S1479262116000241.
Acknowledgements
This work funded by the Indian Council of Agricultural Research, New Delhi Grant-in-Aid under ICAR-Lal Bahadur Shastri Young Scientist Biennium Award scheme to first author. Thanks to Director, Indian Institute of Wheat and Barley Research, Karnal for providing the necessary facility. We acknowledge the PI (crop Improvement), IIWBR and GRU for supplying the seeds. This paper is IIWBR publication No. 83.