INTRODUCTION
Most of the Korean Peninsula, particularly the southern part, currently experiences a humid and temperate climate, so bouldery slope landforms are thought to have formed in past cold environments, mostly during the last glacial period (Jeon, Reference Jeon2000; Seong and Kim, Reference Seong and Kim2003). The term block stream refers to an accumulation of boulders covering steep slopes in regions dominated by periglacial climates and differentiated from gentle block field. Block streams form via frost cracking and wedging and extend downslope as linear depositional forms (White, Reference White1976, Reference White1981; Wilson, Reference Wilson2013). Their development consists of four main processes: (1) the production of boulders, (2) downslope transport, (3) sorting of boulders in a vertical profile during downslope transport, and (4) the presumed removal of fine-grained materials and cessation of downslope transport (Andersson, Reference Andersson1906, Reference Andersson1907). The term solifluction, a type of mass movement that causes boulders to move downslope, was first introduced in Anderson’s studies on Bear Island and in the Falkland Islands. This term is closely related to gelifluction when it occurs with the aid of ice (i.e., frozen water in voids).
Freezing and thawing of moisture in rockwall joints (i.e., frost shattering) is one way by which rock can be removed from outcrops (Walder and Hallet, Reference Walder and Hallet1986; Matsuoka, Reference Matsuoka2001). Angular blocks released by frost shattering accumulate at the foot of rockwalls as talus (Clark, Reference Clark1972; Boelhouwers, Reference Boelhouwers1999). Conversely, block streams containing rounded blocks are usually associated with deposits showing evidence of intense chemical weathering. In such cases, the boulders are produced by exhumation of corestones from mantles that are deeply chemically weathered (Caine and Jennings, Reference Caine and Jennings1968; Caine, Reference Caine1983; Boelhouwers et al., Reference Boelhouwers, Holness, Meiklejohn and Sumner2002). Autochthonous block field boulders were generated via deep chemical weathering processes during the warm pre-Pleistocene (Ballantyne, Reference Ballantyne2010). However, there are some arguments on the origin of rounded boulders in relation to periglacial landforms (Hall et al., Reference Hall, Thorn, Matsuoka and Prick2002; Hall and Thorn, Reference Hall and Thorn2011; Goodfellow et al., Reference Goodfellow, Skelton, Martel and Stroeven2014).
Unloading of ice during deglaciation is also an effective process of boulder production by way of slope retreat caused by debuttressing ice (Gardner, Reference Gardner1982; Johnson, Reference Johnson1984; Luckman and Fiske, Reference Luckman and Fiske1995; Marion et al., Reference Marion, Filion and Hétu1995; Muñoz et al., Reference Muñoz, Palacios and de Marcos1995; André, Reference André1997; Hinchliffe and Ballantyne, Reference Hinchliffe and Ballantyne1999).
Gelifluction moves blocks along a slope and away from their initial location (Smith, Reference Smith1949, Reference Smith1953; Caine and Jennings, Reference Caine and Jennings1968; Potter and Moss, Reference Potter and Moss1968; Clark, Reference Clark1972, Reference Clark1994; Clapperton, Reference Clapperton1975; Caine, Reference Caine1983; Aldiss and Edwards, Reference Aldiss and Edwards1999; Boelhouwers, Reference Boelhouwers1999; Boelhouwers et al., Reference Boelhouwers, Holness, Meiklejohn and Sumner2002). Caine (Reference Caine1983) showed that the tendency for boulders to be aligned in a downslope direction indicates that block streams were transported downslope in Tasmania. He proposed that both (a) a particle frictional mechanism relating to sediments or ice infilling voids and (b) a viscous flow mechanism involving remolded clay layers beneath the boulders contributed to the downslope movement of those block streams. Movement of boulders associated with mudflow during the thaw period has been reported from the Yukon, Canada (Sharp, Reference Sharp1942).
The accumulation of fine-grained alluvium often occurs downslope of block streams (Caine, Reference Caine1983; Clark, Reference Clark1994). These fine-grained materials are a significant component of the matrix in deposits associated with gelifluction, and the removal of these materials can hinder and/or completely stop the downslope movement of block streams. The removal of fines occurs when flowing liquid water becomes more active during intervals of warm climate (Andersson, Reference Andersson1906, Reference Andersson1907; Smith, Reference Smith1949, Reference Smith1953; Caine and Jennings, Reference Caine and Jennings1968; Potter and Moss, Reference Potter and Moss1968; Clapperton, Reference Clapperton1975; Caine, Reference Caine1983; Clark, Reference Clark1994; Boelhouwers, Reference Boelhouwers1999; Boelhouwers et al., Reference Boelhouwers, Holness, Meiklejohn and Sumner2002). Repeated freezing and thawing could result in the sorting of fine-grained materials because of differences in their thermal conductivity and heat capacity, and finer-grained deposits could then be flushed away by water during times of thaw (Aldiss and Edwards, Reference Aldiss and Edwards1999).
Cosmogenic exposure dating methods have been applied to establish the ages of active and relict bouldery landscapes in periglacial areas (Seong and Kim, Reference Seong and Kim2003; Barrows et al., Reference Barrows, Stone and Fifield2004; Cremeens et al., Reference Cremeens, Darmody and George2005; Hancock and Kirwan, Reference Hancock and Kirwan2007; Wilson et al., Reference Wilson, Bentley, Schnabel, Clark and Xu2008; Oh et al., Reference Oh, Park and Seong2012a, Reference Oh, Park and Seong2012b; Gunnell et al., Reference Gunnell, Jarman, Braucher, Calvet, Delmas, Leanni, Bourles, Arnold, Aumatire and Keddaouche2013; Goodfellow et al., Reference Goodfellow, Skelton, Martel and Stroeven2014). Stone runs in the Falkland Islands were dated using 10Be and 26Al, and the results indicate that they had experienced multiple cold stages (Wilson et al., Reference Wilson, Bentley, Schnabel, Clark and Xu2008). Studies involving 10Be and 26Al or 36Cl dating of the bouldery deposits of Mt. Maneo and Mt. Mudeung in Korea indicate that they were formed during the last glacial period (Seong and Kim, Reference Seong and Kim2003; Oh et al., Reference Oh, Park and Seong2012a, Reference Oh, Park and Seong2012b). Such studies, however, have been based on only a few samples (<10) so that the result was likely to be biased for site-specific conditions.
We investigated the timing of initiation and stabilization of bouldery landforms, such as block streams, talus deposits, and tors, on Mt. Biseul through a combination of geomorphological studies and 10Be surface exposure dating. We then compared these data to records of past climate reconstructed from other proxies such as cave speleothem and pollen, especially in terms of the production and settlement of boulders, which are one of the major landscapes on the southern Korean Peninsula.
STUDY AREA
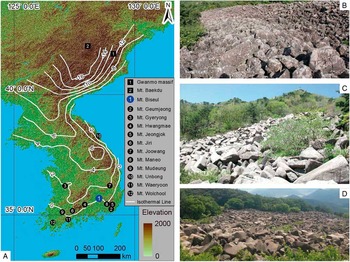
The Korean Peninsula lies in the midlatitudes of the Northern Hemisphere and experienced a periglacial climate during the last glacial period, with the exception of a few high-standing mountains, such as Mt. Baekdu and the Gwanmo massif cirques, which were subjected to glaciation (Fig. 1A; Oguchi and Tanaka, Reference Oguchi and Tanaka1998; Lee et al., Reference Lee, Seong, Kang and Choi2012; Rhee et al., Reference Rhee, Seong and Yu2015). The mean annual temperature during the last glacial period was near −1°C, the threshold for growth of speleothem, which is the best climate archive in Korea, and repeated freeze–thaw action promoted frost shattering (Jo et al., Reference Jo, Woo, Yi, Yang, Lim, Wang, Hai and Edwards2014). Intense frost weathering in association with frost shattering enhanced the production of boulders, which evolved into talus and block streams (Oguchi and Tanaka, Reference Oguchi and Tanaka1998; Jeon, Reference Jeon2000; Seong and Kim, Reference Seong and Kim2003; Oh et al., Reference Oh, Park and Seong2012a, Reference Oh, Park and Seong2012b). Since the Holocene, surface streams have removed the fine-grained material within voids and beneath boulders, leaving fossil landscapes with concave profiles (Fig. 1B–D).
(A) Distribution of glacial landforms (cirques represented by rectangles), periglacial landforms (block streams represented by circles), and isotherms during the present winter, December–January–February (white bold line), in the Korean Peninsula. (B) Block stream on Mt. Unbong (10). (C) Block stream on Mt. Biseul (1; study area). (D) Block stream on Mt. Maneo (8). (For interpretation of the references to color in this figure legend, the reader is referred to the web version of this article.)

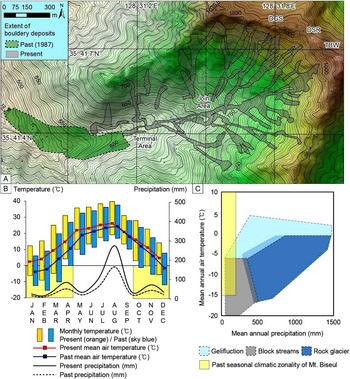
Mt. Biseul County Park, Daegu, Korea, is a basin strewn with talus and block streams (Fig. 2A). The surrounding bedrock consists mainly of igneous units from the Cretaceous Yucheon Group (mostly andesite and other igneous rocks), whereas the block streams and bedrock beneath the block streams are composed of biotitic granite of the Bulguksa Group (Korea Institute of Geoscience and Mineral Resources, 1971). The bouldery deposits are ~1400 m in length and can be divided into three sections: steep-slope talus deposits (slopes >30°), high-slope block streams (18°–25°), and low-slope block streams (8°–14°). The average size of the 30 boulders is 194×104 cm, and the isotropy of the boulders’ a-axis direction in relation to the downslope direction is >70% (Jeon, Reference Jeon2000). Tens of bouldery slope deposits, which developed in a fashion similar to stream channels, extend from a ridge in the northeast to an outlet in the southwest along valleys between ridges and tors. The present study focused on several areas that have the best-preserved block streams, such as DGS (Daegyunsa: Daegyun temple), DSR (Deungsanro: hiking trail), and TBW (Tobbawi: saw-boulder) (Fig. 2).
(A) Shaded relief map of the study area. Areas colored gray represent bouldery deposits (talus and block streams), and those colored green with dotted outlines represent rough extent of their past distribution. Each landform is identified from aerial photos (National Geographic Information Institute, 1987, 2015), satellite images, and digital elevation models with the help of cross-checks made in the field. DGS, Daegyunsa, Daegyun temple; DSR, Deungsanro, hiking trail; TBW, Tobbawi, saw-boulder. (B) Present thermal and precipitation regime of the study area over the last 30 yr based on observation at nearest meteorological station and interpolation using RegCM2 (Giorgi et al., Reference Giorgi, Marinucci and Bates1993a, Reference Giorgi, Marinucci, Bates and De Canio1993b; Ju et al., Reference Ju, Wang and Jiang2007) (Table 1). (C) Climatic zonality of periglacial landforms, modified from Harris (Reference Harris1994) with our study overlain. (For interpretation of the references to color in this figure legend, the reader is referred to the web version of this article.)

Some talus deposits are found between the most upstream of the block streams and below the cliff. The block stream boulders are subrounded, whereas the talus boulders are angular and subangular. The slope associated with the block streams is gentle (8°–25°), whereas that of the talus-covered areas is steep (>30°; Jeon, Reference Jeon2000). Broken pieces of boulder with high angularity are found on the talus indicating some boulders were provided by rockfall directly from the rockwall. These talus-covered surfaces are present at up to tens of meters of altitude. The slopes become gradually gentler downslope from the foot of the talus deposits. Tors exist in DSR, and between DGS and TBW, at altitudes of 880 m and 800 m, respectively. These tors supplied angular boulders to block streams with partial talus deposit covers on both areas. The block streams join at an altitude of ~730 m where a surface stream resurfaces. The combined block streams extend downslope to an altitude of ~450 m, but it is not possible to access the terminal area below ~600 m because it is covered by urban development.
Active block streams are restricted to a limited number of cold-climate regions at present because the activity of gelifluction decreases with increasing temperature (Harris, Reference Harris1994). The downslope movement of block streams in the study area ceased in the early Holocene (Jeon, Reference Jeon2000). Freeze-thaw activity occurred on the surface during the Younger Dryas, even at a surface temperature of 5°C and an altitude of 500 m (Shakesby and Matthews, Reference Shakesby and Matthews1993). The mean annual air temperature beneath the boulders is likely to be as much as 2.5°C–4.0°C lower than that of the surface because of Rayleigh-Bénard convection (the chimney effect) and wind-forced convection (Gorbunov et al., Reference Gorbunov, Marchenko and Seversky2004; Guodong et al., Reference Guodong, Yuanming, Zhizhong and Fan2007).
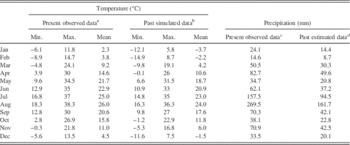
Numerical models and palynological studies show that surface temperatures on the Korean Peninsula during the last glacial period were 5°C–6°C lower than at present (Kim et al., Reference Kim, Yang, Nahm, Yi, Kim, Hong and Yun2008a; Yi and Kim, Reference Yi and Kim2010; Jo et al., Reference Jo, Woo, Yi, Yang, Lim, Wang, Hai and Edwards2014). A simulation of the last glacial maximum (LGM) climate over East Asia with a regional climate model (RegCM2) supports that the temperature of our study area decreased about 2°C during summer and 6°C during winter (Giorgi et al., Reference Giorgi, Marinucci and Bates1993a, Reference Giorgi, Marinucci, Bates and De Canio1993b; Ju et al., Reference Ju, Wang and Jiang2007). We inferred the thermal and precipitation regimes of the present study area during the last glacial period using the RegCM2 model from the present data (Table 1). Monthly air temperatures in the study area fluctuated around 0°C during a 5-month interval over the last 30 yr (Korea Meteorological Administration, 2015, http://web.kma.go.kr), implying that daily ground freezing occurred for 7 months of the year during the last glacial period (Fig. 2B). Annual precipitation in the study area is ~910 mm, half of which falls during the summer monsoon. A palynological study indicates that annual precipitation of the last glacial period decreased by as much as 40% (Yi and Kim, Reference Yi and Kim2010), from which we yielded winter precipitation levels of ~190 mm in the study area.
Reconstruction of paleoclimate of Mt. Biseul based on present temperature and precipitation. Max., maximum; Min., minimum.

a Observed monthly air temperature records averaged over the last 30 years in the study area (Korea Meteorological Administration, 2015; http://web.kma.go.kr).
b Estimation of past air temperature with climate simulation model of Ju et al. (Reference Ju, Wang and Jiang2007).
c Observed monthly precipitation records averaged over the last 30 years in the study area (Korea Meteorological Administration, 2015; http://web.kma.go.kr).
d Estimation of past precipitation with numerical model and palynological studies of Kim et al. (2008a), Yi and Kim (Reference Yi and Kim2010), and Jo et al. (Reference Jo, Woo, Yi, Yang, Lim, Wang, Hai and Edwards2014).
The thermal and precipitation regimes of the study area, as modeled previously, indicate zones of seasonal block stream formation and gelifluction during the last glacial period, according to Harris (Reference Harris1994) (Fig. 2C). In addition, microscale structures on soil and saprolite (Oh, Reference Oh1989, Reference Oh2006; Kee, Reference Kee2002) as well as mesoscale soil or pseudo–ice wedges and vertebrate burrows (Lim et al., Reference Lim, Lee, Yi, Kim, Chung, Lee and Choi2007) found in the southern part of the Korean Peninsula strongly support the idea that periglacial processes were more active during the last glacial period, particularly during the early part of the last glacial period (Marine Oxygen Isotope Stage [MIS] 4) and near the LGM (MIS 2) (Kim et al., Reference Kim, Lee and Choi1998, Reference Kim, Crowley, Erickson, Govindasamy, Duffy and Lee2008b).
HYPOTHESES OF THE EVOLUTION OF BOULDERY SLOPE DEPOSITS
Previous studies of block streams on Mt. Maneo and Mt. Mudeung suggest that the evolution of these landscapes began during an earlier phase (MIS 4) and stabilized in a later phase (MIS 2 and early Holocene) of the last glacial period (Seong and Kim, Reference Seong and Kim2003; Oh et al., Reference Oh, Park and Seong2012a, Reference Oh, Park and Seong2012b). Columnar joints are well developed in the andesite bedrock on Mt. Mudeung, and these structures could have promoted frost shattering, which would have caused the segregation of boulders. These boulders were initially deposited along short, steep slopes. The lack of sites dated in previous studies (Seong and Kim, Reference Seong and Kim2003; Oh et al., Reference Oh, Park and Seong2012a, Reference Oh, Park and Seong2012b) failed to determine whether the bouldery landforms were produced during transient periods under favorable conditions or throughout the last glacial period.
Conversely, block streams on Mt. Biseul were thought to have been produced by deep chemical weathering. The emergence of several corestones and saprolites has been observed at the terminal area of block streams (Jeon, Reference Jeon2000). Given the presence of a saprolite with subrounded boulders, block streams were thought to have been originally produced during a warm climate, were subsequently stripped of their top layer under periglacial conditions during the last glacial period, and have remained exposed until the present. A similar hypothesis for the evolution of the block streams involves an “autochthonous block field,” which proposes that a deep chemically weathered saprolite was generated during a pre-Pleistocene warm climate and that subsequent stripping of the saprolite and surface lowering since the early Pleistocene meant that surviving corestones were exposed at the surface (Ballantyne, Reference Ballantyne2010). It is proposed that penetration of a weathering front released additional boulders through frost wedging during the following cold periods, and the boulders were further exposed by continuous surface lowering.
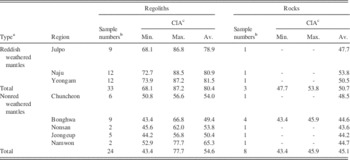
However, tens of deeply weathered granite mantles, which were introduced as saprolites on the Korean Peninsula, are being discussed whether they were produced by chemical weathering or not (Kim et al., Reference Kim, Kee and Yang2015). The Chemical Index of Alteration (CIA) values of reddish weathered mantles and of nonred weathered mantles are contrasted (Table 2). Only reddish weathered mantles in southwestern Korea show high CIA values, suggesting that they were mainly affected by chemical weathering (regolith, 80.4; rock, 50.7). In contrast, CIA values of most granite basins with nonred weathered mantles are extremely low, implying that chemical weathering was weak (regolith, 54.6; rock, 45.1). Because the geologic characteristics of our study area belong to the latter, production of the bouldery deposits was less likely to be caused by the deep chemical weathering.
Chemical Index of Alteration (CIA) results of weathered granite mantles on the Korean Peninsula. Av., average; Max., maximum; Min., minimum.

a Nonred weathered grus occupy most of granite weathered mantles on the Korean Peninsula, except partial reddish weathered mantles developed on some of southwestern Korea (Kim et al., Reference Kim, Kee and Yang2015).
b Plural samples from regolith and bedrock were collected and analyzed from each region (Kim et al., Reference Kim, Kee and Yang2015).
c CIA of regions was calculated with the results of major elements analysis by X-ray fluorescence (Nesbitt and Young, Reference Nesbitt and Young1982; Kim et al., Reference Kim, Kee and Yang2015).
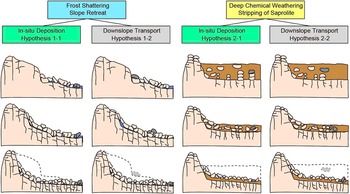
Various discussions about weathering procedures and landscape development in cold environments have been raised (Hall et al., Reference Hall, Thorn, Matsuoka and Prick2002; Whalley et al., Reference Whalley, Rea and Rainey2004; Dixon and Thorn, Reference Dixon and Thorn2005; Hall and Thorn, Reference Hall and Thorn2011). As we have first-order evidence showing the periglacial origin of boulders including boulders’ angularity and weathering processes in this study area, we divided two pairs of hypotheses on the evolution of bouldery slope deposits as follows (summarized in Fig. 3):
-
∙ Hypothesis 1-1: Frost shattering, slope retreat, and in situ deposition. Production of boulders occurs at the top slope, mostly at the rockwall or escarpment. Frost wedging by repeated freezing and thawing under periglacial conditions promotes physical weathering. Detached boulders are deposited in situ at the foot of the retreating rockwall, whereas fines are selectively washed by surface runoff. It is assumed that little significant downslope transportation of boulders occurs.
-
∙ Hypothesis 1-2: Frost shattering, slope retreat, and downslope transport. Production of boulders occurs in the same manner as in hypothesis 1-1, but the detached boulders are transported farther downslope by mass movement, particularly with the aid of gelifluction (Seong and Kim, Reference Seong and Kim2003; Cremeens et al., Reference Cremeens, Darmody and George2005; Wilson et al., Reference Wilson, Bentley, Schnabel, Clark and Xu2008; Oh et al., Reference Oh, Park and Seong2012a, Reference Oh, Park and Seong2012b).
-
∙ Hypothesis 2-1: Deep chemical weathering, stripping of a saprolite, and in situ deposition. Production of boulders initially occurs within the bedrock through chemical weathering under warm climate conditions (i.e., pre-Pleistocene). Subsequent stripping of a saprolite under cold climate conditions exposes the surviving corestones at the surface. This hypothesis also assumes little downslope transportation (Ballantyne, Reference Ballantyne2010).
-
∙ Hypothesis 2-2: Deep chemical weathering, stripping of a saprolite, and downslope transport. Production of boulders occurs in the same way as in hypothesis 2-1. However, the surviving corestones are transported downslope with the aid of gelifluction under periglacial conditions (Jeon, Reference Jeon2000).
(color online) Four hypotheses that explain the evolution of bouldery deposits in the study area. Hypothesis 1-1: Strong physical weathering, especially frost shattering during cold (i.e., glacial) periods, segregates the boulders from cliffs. The segregated boulders are deposited as talus, and the cliff gradually retreats. Hypothesis 1-2: Strong physical weathering (as with hypothesis 1-1) occurs, but the boulders move downslope. Hypothesis 2-1: Deep chemical weathering produces a saprolite under warm climate conditions, possibly extending back to the Tertiary. The saprolite is subsequently stripped by periglacial hillslope processes such as gelifluction or diffusive processes during cold periods. The corestones are exposed, transported, and finally stabilized, surviving as in situ deposited boulders (Ballantyne, Reference Ballantyne2010). Hypothesis 2-2: Deep chemical weathering (as with hypothesis 2-1) occurs, but the boulders move downslope. Dashed curves represent each initial slope composed with bedrock or regolith. Dashed lines indicate initial surfaces or initial position of boulder.

Hypothesis 1-1 can be tested by examining the linear regression between boulder exposure age and distance downslope or altitude variations. An increase in age with distance from the present rockwall is expected because of in situ deposition of boulders detached from a retreating rockwall. Boulders present at the greatest distance from the rockwall should yield the oldest exposure age. Hypothesis 1-2 can be tested in a similar fashion. Because gelifluction, which transports boulders downslope, is the main process associated with this model, we can distinguish between hypotheses 1-1 and 1-2 based on geomorphological evidence (e.g., roundness, a-axis isotropy, joint frequency, and boulder size). For hypothesis 2-1, an inverse relationship between exposure age and downslope distance is expected because stripping of buried saprolite layers might expose boulders earlier at high altitudes than at low altitudes. We can also discriminate between hypotheses 2-1 and 2-2 using geomorphological evidence that indicates downslope transport.
METHODS
Terrain analysis: slope and directional fabric
We subdivided the study area into regions of talus and block stream deposits based on locations and geomorphic characteristics (e.g., slope and longitudinal profile). ArcMap 10.0 was used to analyze 12 slope profiles in the study area, including DGS, DSR, and TBW, with a digital elevation model (DEM; 10 m resolution). We also checked all slope variations in the field, as the low resolution of the DEM may have resulted in difficulties in detecting small-scale slope change.
We also estimated the dynamics of slopes by examining the volume of talus and the area of the rockwalls, with an assumption that all bouldery deposits were derived from rockfall talus (Francou, Reference Francou1988; Hinchliffe and Ballantyne, Reference Hinchliffe and Ballantyne1999; Curry and Morris, Reference Curry and Morris2004). We calculated the total volume of bouldery deposits produced by frost shattering with ArcMap. Distributions of bouldery deposits were extracted from satellite images, and their depth was measured in previous studies (Jeon, Reference Jeon2000). Slope was calculated with DEM, and the volume of the void was estimated with multiple pictures taken from different angles. The volume of boulder was divided by the area of present rockwalls to estimate the distance over which they retreated.
Several geomorphological characteristics can also be considered as evidence for difference modes of block stream evolution, such as a-axis isotropy in relation to slope direction, the size and roundness of boulders, and the density or frequency of boulder joints, as these are related to the direction of downslope movement and the degree of weathering (Caine and Jennings, Reference Caine and Jennings1968; Caine, Reference Caine1983). Thus, we can use such characteristics to test the various hypotheses on the production and downslope transportation of boulders. Analysis of directional fabric was conducted on 20 boulder samples at each of 7 locations (4 located on block streams and 3 on talus; 140 boulder samples in total); each boulder was examined for its orientation and a-axis length to find evidence for downslope movement.
10Be surface exposure dating
High-energy cosmic rays promote nuclear reactions in the atmosphere and the lithosphere, resulting in the production of cosmogenic nuclides (e.g., 10Be, 14C, 21Ne, 26Al, and 36Cl). Cosmogenic radionuclide dating (the most commonly used method of surface exposure dating) has been successfully used to date various bouldery landforms including block streams and block fields (Seong and Kim, Reference Seong and Kim2003; Barrows et al., Reference Barrows, Stone and Fifield2004; Cremeens et al., Reference Cremeens, Darmody and George2005; Hancock and Kirwan, Reference Hancock and Kirwan2007; Wilson et al., Reference Wilson, Bentley, Schnabel, Clark and Xu2008; Oh et al., Reference Oh, Park and Seong2012a, Reference Oh, Park and Seong2012b; Gunnell et al., Reference Gunnell, Jarman, Braucher, Calvet, Delmas, Leanni, Bourles, Arnold, Aumatire and Keddaouche2013; Goodfellow et al., Reference Goodfellow, Skelton, Martel and Stroeven2014).
Twenty-four samples were obtained from 9 locations (13 samples at 4 locations for block streams, 7 samples from 3 talus deposits, and 4 samples from 2 tors) for 10Be dating. Locations were selected based on terrain analysis to avoid reworked bouldery deposits identified by sedimentologic characteristics in the field. The samples were chipped from the top surfaces of boulders where the attainability and nuclear reactions of the cosmic rays are maximized. In the case of the tors, the top surfaces of the granite domes or residual pillars were collected, as these have been exposed to an open sky with little shielding. Other talus and block stream samples were collected from large and stable boulders that showed minimal signs of erosion and postdepositional toppling.
We prepared the samples at the Geochronology Laboratory, Korea University, following the standard method for 10Be extraction (Kohl and Nishiizumi, Reference Kohl and Nishiizumi1992; Kim et al., Reference Kim, Seong, Byun, Weber and Min2016). Rock samples were pulverized using an iron mortar to grain sizes between 250 and 710 μm. An HCl-HNO3 mixture was used for removing carbonates, organic matter, and iron ore. An HF-HNO3 mixture was used for removing other minerals except quartz via repeated leaching in a heated ultrasonic bath. Handpicking and magnetic separation were performed between each leach to remove precipitated fluorides and magnetic minerals. A pure quartz sample (~20 g) was spiked with a carrier with a low background level of 10Be (2×10–15 10Be/9Be) and then dissolved with highly concentrated HF and HNO3 on a hot plate. Fluoride was fumed out using HNO3 and HClO4. Be was purified using anion and cation exchange columns and was finally precipitated at pH >7 and neutralized with NH4OH. The precipitated BeOH was dried overnight at 60°C and oxidized at 800°C for 10 minutes in the furnace to destroy ammonium salts and remove any water. BeO was mixed with Nb powder, loaded, and pressed into a target. Targets were measured using the accelerator mass spectrometer at the Korea Institute of Science and Technology.
Measured 10Be/9Be ratios were normalized using a 10Be standard (5-1; 1.432×10⁻¹¹ 10Be/9Be) prepared by Nishiizumi et al. (Reference Nishiizumi, Imamura, Caffee, Southon, Finkel and McAninch2007) with a 10Be half-life of (1.387±0.03)×106 yr (Chmeleff et al., Reference Chmeleff, von Blanckenburg, Kossert and Jakob2010; Korschinek et al., Reference Korschinek, Bergmaier, Faestermann, Gerstmann, Knie, Rugel and Wallner2010). The whole process blank yielded a 10Be/9Be ratio of 4.3×10⁻¹⁵, which was subtracted from the measurements. The normalized ratio was converted into exposure age using the CRONUS-Earth online calculator version 2.2 (Balco et al., Reference Balco, Stone, Lifton and Dunai2008) assuming a 10Be production rate of 4.49±0.39 atoms/g/yr at sea level at high latitudes (Stone, Reference Stone2000; Balco et al., Reference Balco, Stone, Lifton and Dunai2008).
RESULTS
Terrain analysis: slope and directional fabric
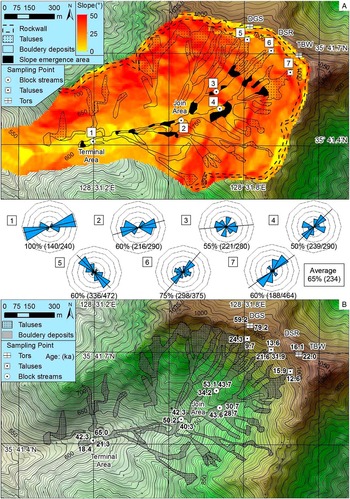
All slope angles in the study area tend to decrease gradually downslope (Fig. 4A). Tors, ridges, and rockwalls occupy the uppermost ~100 m sections of the slopes. Talus deposits fed by rockfall from tors or rockwalls extend to ~200 m in distance (or tens of meters in altitude) and have steep slopes with gradients exceeding 30° in the talus deposits of TBW. From the foot of the talus deposits, at an altitude of ~900 m, slopes with gradients of <25° appear continuously and decrease gradually toward the block streams. Several exceptions appear in the tors in DSR, and partially talus-covered areas in DGS and TBW, which are fed by those tors. The slope becomes gentler (<15°) below an altitude of 730 m where block streams join and are present down to their terminal area at an altitude of 600 m. Rockwall retreated by 18.8±6.6 m on average along the whole cliff, and detached boulders were transported downslope ~1301.1 m. Several areas show concave-down curvature in their low-slope block streams. This concavity is likely because of boulder subsidence caused by the removal of fine-grained sediments beneath and between boulders, itself a result of surface stream erosion. This may disturb the directional fabric of the deposit, for example by toppling or overturning and exposure of multiple boulders.
(A) Result of the slope and fabric analyses based on 20 points at each of the seven study locations. The dotted areas represent talus supplied from rockwalls, and the black filled areas denote small-scale talus deposits supplied from tors and areas that have undergone subsidence through the removal of fines. The solid lines and blue two-dimensional fabric diagrams represent slope directions and frequency of the a-axis directions, respectively. Percentage values denote the a-axis isotropy of boulders with a downslope direction (±30°), and values in parentheses represent the mean and maximum length (cm) of the a-axis isotropy of boulders at each location. (B) Results of the 10Be exposure age dating of bouldery deposits (ka). DGS, Daegyunsa, Daegyun temple; DSR, Deungsanro, hiking trail; TBW, Tobbawi, saw-boulder. (For interpretation of the references to color in this figure legend, the reader is referred to the web version of this article.)

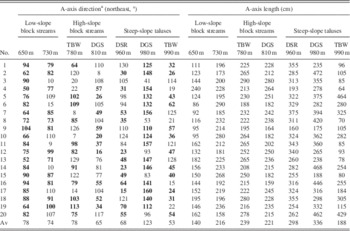
The size and directional fabric of the boulders were analyzed with two-dimensional fabric diagrams (Fig. 4A). Fabric isotropy ranges from 65% to 100% at each location, and the mean isotropy is 79%. Given that a greater isotropy of boulders is likely to mean that they have been more stable since their initial formation (Caine, Reference Caine1983), boulders that were sampled for exposure dating in locations with high isotropy are likely to have experienced minimal postburial reworking. The a-axis length of boulders tends to decrease with distance downslope (Table 3), most likely as a result of physical weathering and erosional processes such as attrition and abrasion. The a-axis length of boulders from TBW shows double peaks at 1–2 m and >4 m.
Directional fabric of boulder deposits. DGS, Daegyunsa, Daegyun temple; DSR, Deungsanro, hiking trail; TBW, Tobbawi, saw-boulder.

a Directions of the a-axis of boulders described. Bold values have a-axis isotropy with downslope direction of sampling sections (±30°).
10Be surface exposure dating
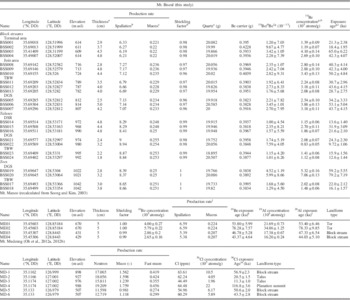
We collected 24 samples from tors, talus deposits, and block streams to constrain the timing of last exposure (or stabilization) of the boulders by means of cosmogenic 10Be dating (Table 4; Fig. 4B). All bouldery deposits were exposed after 65 ka (MIS 4), suggesting that the segregation of boulders and the evolution of the landscape were initiated at the beginning of the last glacial period. The oldest boulder was found in the terminal area of the block streams. Exposure dates of other samples from the block streams range from 65.0 ka (MIS 4) to 18.4 ka (MIS 2). The youngest age (9.7 ka; early Holocene) was from a boulder at the top of the DGS talus deposit. The ages of other talus deposits ranged from 31.9 ka (MIS 3) to 9.7 ka. The total age range of all bouldery deposits ranged from 65 to 9.7 ka, implying that the study area experienced periglacial conditions during the whole of the last glacial period. Tors with different morphologies showed different exposure ages—on average, the more angular tors were younger. The tors of DGS were exposed at 79.2 ka and 59.2 ka (MIS 5a and 4), whereas the two samples from tors of TBW were exposed at 22.0 ka and 16.1 ka (MIS 2), close to the LGM and the late glacial period.
10Be exposure dating data and other cosmogenic exposure ages of bouldery landforms published in Korea. DGS, Daegyunsa, Daegyun temple; DSR, Deungsanro, hiking trail; m asl, meters above sea level; TBW, Tobbawi, saw-boulder.

a Tops of the boulders’ exposed surfaces.
b Constant production rate model of Stone (Reference Stone2000) was used.
c Constant production rate model of Heisinger et al. (Reference Heisinger, Lal, Jull, Kubik, Ivy-Ochs, Knie and Nolte2002a, Reference Heisinger, Lal, Jull, Kubik, Ivy-Ochs, Neumaier, Knie, Lazalev and Nolte2002b) was used.
d Factors for correcting geometric shielding measured on intervals of 10°.
e Density of granite (2.7 g/cm3) was used.
f Ratios of 10Be/9Be were normalized with 07KNSTD reference sample 5-1 (2.71×10⁻¹¹±9.58×10⁻¹⁴) of Nishiizumi et al. (Reference Nishiizumi, Imamura, Caffee, Southon, Finkel and McAninch2007) and 10Be half-life of 1.38×10⁶.
g Uncertainties are calculated at the 1σ confidence level.
h A mean value of process blank samples (4.39×10⁻¹⁵±9.17×10⁻¹⁶) was used for correction of background.
i Ages are calculated assuming zero erosion using the CRONUS-Earth online calculator of Balco et al. (Reference Balco, Stone, Lifton and Dunai2008).
j Production rate assumed with 3% of sea level 10Be production by muon following Lal (Reference Lal1991).
k Recalculated 10Be exposure age dating of Mt. Maneo from Seong and Kim (Reference Seong and Kim2003).
l Recalculated 26Al exposure age dating of Mt. Maneo from Seong and Kim (Reference Seong and Kim2003).
m Result of 36Cl exposure age dating of bouldery deposits in Mt. Mudeung (Oh et al., Reference Oh, Park and Seong2012a, Reference Oh, Park and Seong2012b).
DISCUSSION
Effective ages of taluses and block streams
We constructed plots of altitude versus boulder exposure age (Fig. 5A; Table 4). Our ages show a degree of scatter at each location. The 10Be exposure age of boulders in block streams is dependent on several factors, such as inheritance from previous exposure intervals, boulder-specific erosion, and pre- or postdepositional reworking. The first possibility (i.e., inheritance) can be disregarded because the oldest age of any boulder from the block streams (65.0 ka) is younger than the age of the tors (79.2 ka), which represent the provenance of the boulders. Although we collected samples from the surfaces of boulders showing little evidence of surface erosion, some of the boulders might indeed have experienced surface erosion given that the occurrence of erosion is stochastic, which may cause underestimation of real age.
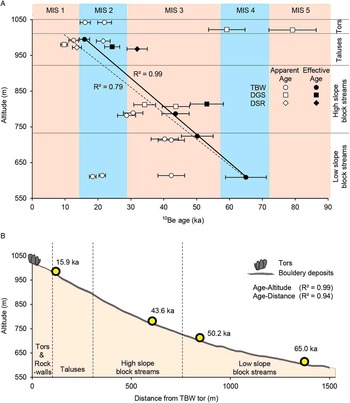
(A) Plot showing 10Be exposure ages of tors, talus, and block streams versus altitude. Black filled circles, diamonds, and rectangles represent the effective exposure ages of each section. Exposure ages show a strong relationship with altitude and downslope distance, with the exception of two boulders at the lowest altitudes, which were possibly reworked. R 2 values of the best-fit linear regression exceed 0.7 for all block streams and talus deposits (dashed line). Values increase to 0.79 for samples of TBW only and 0.99 when only the effective exposure ages of TBW are included (solid line). (B) Relationship between effective ages of bouldery landforms for TBW area and altitude and downslope distance. The strong correlation between exposure age and altitude or downslope distance supports hypothesis 1-2 (combination of rockwall retreat and downslope transport) for the evolution of bouldery slope landforms at Mt. Biseul. DGS, Daegyunsa, Daegyun temple; DSR, Deungsanro, hiking trail; TBW, Tobbawi, saw-boulder. (For interpretation of the references to color in this figure legend, the reader is referred to the web version of this article.)

It has been proposed that boulders were transported in a low-turbulence state, maintaining their directional fabric as they arrived at the valley axis onward (Wilson et al., Reference Wilson, Bentley, Schnabel, Clark and Xu2008). Although the sampled boulders in the study area seem to have been stabilized in place after arrival in the valley, toppling of boulders could have occurred during downslope transport by heaving and sorting (Potter and Moss, Reference Potter and Moss1968; Aldiss and Edwards, Reference Aldiss and Edwards1999; Boelhouwers, Reference Boelhouwers1999). Some boulders could have been substantially reworked by subsidence during warm climate intervals, given their open-work fabric, which formed when fine materials were washed away by surface streams (Andersson, Reference Andersson1906, Reference Andersson1907; Smith, Reference Smith1949, Reference Smith1953; Caine and Jennings, Reference Caine and Jennings1968; Potter and Moss, Reference Potter and Moss1968; Clapperton, Reference Clapperton1975; Caine, Reference Caine1983; Clark, Reference Clark1994; Boelhouwers, Reference Boelhouwers1999; Boelhouwers et al., Reference Boelhouwers, Holness, Meiklejohn and Sumner2002). To avoid such effects, we only collected samples from boulders that were not in depressions. Interestingly, all ages were greater than the Holocene, when precipitation increased in the region (Jo et al., Reference Jo, Woo, Yi, Yang, Lim, Wang, Hai and Edwards2014), implying that postdepositional reworking was rare.
When considering all factors that control the duration of the exposure of boulders in block streams, including stochastic frost shattering and toppling during downslope transport, we suggest that the oldest age of boulders from a single location is likely to be the most reliable. This is strongly supported by the linear relationship between the oldest boulder age and downslope distance (Fig. 5B). The exposure ages of the boulders have a tendency to increase inversely with altitude and increase with distance downslope. Boulders with younger ages might have been exposed later than the effective age of a location (e.g., 65.0 ka in the terminal area). It is also likely that the boulders in the study area were supplied to a slope no earlier than 79.2 ka (the oldest age of the tors in the upslope region). On the other hand, talus deposits have the youngest exposure ages, most of which are centered on the late glacial period, with some centered on MIS 2. In the case of TBW, tors and talus show similar exposure ages, indicating that the talus deposits were directly supplied from disintegrated tors or rockwalls.
Although we favor that the oldest age of boulders is near to the real age of boulders at a location, given the stochastic processes of erosion and toppling of boulder surfaces during transport and deposition, the oldest age may be able to be interpreted as minimum. However, unlike common expectation, overestimation of real age caused from prior exposure is less possible because there is no single boulder older than the oldest age of tor present in source region.
There is a good linear relationship between altitude and age (Fig. 5A). R 2 values increase to 0.79 when the data from all TBW (the main stream) samples are included and to 0.99 when only their effective ages are included. We also plotted the effective ages of all samples from block streams in the TBW area against distance downslope from the tors (Fig. 5B). The strong correlation between the distance and effective ages (R 2=0.94) provides good evidence of horizontal movement in these bouldery deposits. These linear relationships between distance, altitude, and exposure age tell us that hypotheses 1-1 and 1-2 are more likely than hypotheses 2-1 and 2-2.
Processes of block stream evolution
We propose a model for the evolution of block streams on Mt. Biseul based on landscape characteristics and exposure ages. The tors of DGS have remained exposed since early MIS 5a when periglacial conditions in the area were initiated (Jo et al., Reference Jo, Woo, Yi, Yang, Lim, Wang, Hai and Edwards2014). Their tops have been preserved for the last ~80 ka, whereas their sides have been plucked out until MIS 2, with steep cliffs present as sheeting joints (Fig. 6A). In contrast, the top surfaces of the TBW tors had almost disintegrated and collapsed because of frost weathering by around the end of the last glacial (Fig. 6B). Seasonal freezing under periglacial conditions caused severe frost weathering of bedrock, and the detached boulders were loaded above the talus slopes via rockfall. At certain locations, some of the weathered saprolite could have been washed away, leaving its corestones exposed (Jeon, Reference Jeon2000). However, such locations are limited to low-altitude areas and are seldom found above the terminal zone of 600 m in the study area. The linear regression between exposure age and downslope distance also favors hypotheses 1-1 and 1-2.
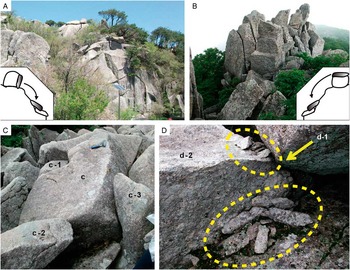
Differences in the breakup modes for tors, which represent the first-order provenance of the angular to subangular boulders within talus deposits and block streams. (A) Tors on DGS have top surfaces that have been long preserved but sides that were recently detached. (B) Tors on TBW were strongly shattered by frost weathering, and the disintegrated angular boulders were transported to form talus deposits downslope. (C) Breakup of boulder into pieces because of frost shattering; the pieces can be fitted back together (jigsaw pattern). The pieces are well preserved with little reworking, although they moved downslope. (D) Rockfall talus and shattered fragments during impact (ellipsoid with yellow hashed outline). Boulder d-1 had fallen onto d-2 and was broken into pieces in the upstream part of the talus deposits. (For interpretation of the references to color in this figure legend, the reader is referred to the web version of this article.)

Periglacial conditions dominated throughout the last glacial period until the late glacial period, when boulders were continuously supplied to the valleys as the rockwall retreated. Given the lack of chemically weathered material found in sediments in this study area, the subrounded boulders found in the downslope areas are also thought to have been mainly produced by frost shattering. The high isotropy with respect to the boulders’ a-axes and the increase in the degree of weathering with distance downslope in the block streams indicate that the boulders were transported downslope. All things considered, we suggest that hypothesis 1-2 is more applicable to the study area. The boulders continued moving downslope from their source area with the aid of gelifluction. Some experienced disturbances during their transition, resulting in a decrease in exposure age.
Several boulders have been broken apart by frost shattering during downslope transport or in their stabilized location. Evidence for frost shattering includes the fact that they have similar joint surfaces and are dovetailed if fitted together (jigsaw pattern; Fig. 6C). The surfaces that were newly exposed by frost shattering showed no difference in the degree of weathering from the originally exposed surface, indicating that most of the cracking features occurred during downslope transport or in situ (i.e., in the boulders’ present location). However, they are well preserved with little evidence of diffusive reworking despite the relatively long distances they had been transported. The relatively small change in slope may further support the idea that the large boulders experienced minimal burial or multiple exposures by toppling or turnover during downslope transport (Wilson et al., Reference Wilson, Bentley, Schnabel, Clark and Xu2008). Because of an increase in temperature toward the late glacial period and the Holocene, the occurrence of frost weathering and gelifluction decreased or ceased, which in turn stopped the downslope transport of block streams, leaving the last rockfall talus deposits in the upslope region (Fig. 6D). This view is supported by the early Holocene age of the talus.
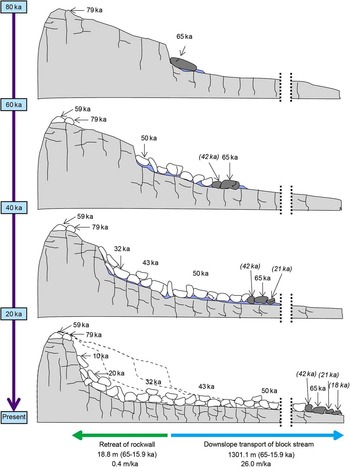
Rockwall retreat via frost shattering and the downslope transport of block streams (hypothesis 1-2) is likely to be the principal mechanism for the evolution of the bouldery deposits at Mt. Biseul. We estimated the horizontal distances of rockwall retreat and boulder transportation. The rockwall retreated by 18.8±6.6 m on average along the whole cliff over the period 65–15.9 ka, yielding a retreat rate of 0.4±0.1 m/ka (Fig. 7). This rate of rockwall retreat under periglacial conditions is similar to rates reported in other studies on active and paleo–block streams (Söderman, Reference Sӧderman1980; Olyphant, Reference Olyphant1983; Sass and Wollny, Reference Sass and Wollny2001). Conversely, if the landscape evolved as in hypothesis 1-1, the retreat distance should have exceeded 1301.1 m, which covers the distance from the terminal area of the block stream to the present rockwall. However, such a volume of bouldery mass (~0.26 km3) is not found in the downslope areas. Therefore, hypothesis 1-1, which relates specifically to in situ deposition, is rejected.
Evolution model of rockwalls and bouldery deposits, talus deposits, and block streams on Mt. Biseul. The major processes of the model are rockwall retreat by frost shattering (dotted lines) and downslope transport with gelifluction (sky-blue-colored layer). The distance and rate of rockwall retreat were calculated using the volume of bouldery deposits, the area of rockwalls, and 10Be exposure ages. Retreating rockwalls provided boulders to the slope and talus. The foot of talus and slope deposits was destabilized and moved downslope via gelifluction under periglacial conditions. These processes persisted until the last glacial maximum and the start of the Holocene. (For interpretation of the references to color in this figure legend, the reader is referred to the web version of this article.)

The total transportation distance of the block streams (i.e., the distance between the location of the paleorockwall at 65 ka and that at 15.9 ka) over the period 65–15.9 ka is ~1301 m, and the corresponding rate of downslope transportation is ~26.0 m/ka. However, the distance and transportation rate should be regarded as minimum estimates because some detritus materials produced in the past could have already left the study area. Our rate of block stream downslope movement is ~2–8 times lower than the rate in active block streams in Kunlun Shan, China (60–210 m/ka), which has a similar climate regime at present to the present study area during the last glacial period (Harris et al., Reference Harris, Cheng, Zhao and Yongqin1998). Given the effect of slope angle on transport via gelifluction, the rate of downslope transport in active block streams decreases to ~86 m/ka for a slope angle of 16°, which is still ~3.3 times greater than the rate reported in this study. Differences between the two areas include total precipitation (Korea: 545 mm/yr, 188 mm/winter; China: 320 mm/yr) and seasonal intensity (higher in Korea), altitude, boulder size, and the amount of fine materials, which are likely to have caused the differences in their rates of block stream movement. In particular, the lack of fine materials in the present study area resulting from the dominance by frost shattering is likely to have led to less rapid downslope movement.
Alternatively, the transport rate of block streams was likely to be unsteady because of the change in the amount of fine materials as well as temperature and humidity. The East Asian summer monsoon was intensified toward the end of the last glacial period and the Holocene (Jo et al., Reference Jo, Woo, Yi, Yang, Lim, Wang, Hai and Edwards2014), which, in turn, removed the fine material between boulders more efficiently. The transport rate was faster in the early last glacial period than in the later part and the Holocene.
Paleoclimate implications of the periglacial bouldery deposits in the southern Korean Peninsula
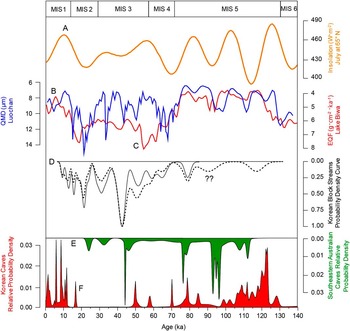
We used the effective ages of bouldery deposits to test the hypotheses on landscape evolution of block streams, considering the possibility of reworking. Samples affected by postdepositional subsidence were avoided for dating. However, other agents of reworking, such as frost shattering and toppling during downslope transport, may also occur in association with any specific climate condition. Thus, we analyzed all boulders to investigate any clues on past climate conditions. The probability density of the exposure ages of boulders was plotted alongside selected paleoclimatic data for the last glacial period (Fig. 8), including Northern Hemisphere summer insolation; quartz median diameter (QMD) from Luochan, Loess Plateau, China; eolian quartz flux (EQF) from Lake Biwa, Japan; and the growth rate of southeastern Australian and Korean speleothems (Berger Reference Berger1978; Ayliffe et al., Reference Ayliffe, Marianelli, Moriarty, Wells, McCulloch, Mortimer and Hellstrom1998; Xiao et al., Reference Xiao, An, Liu, Inouchi, Kumai, Yoshikawa and Kondo1999; Jo et al., Reference Jo, Woo, Yi, Yang, Lim, Wang, Hai and Edwards2014). It is difficult to match our data to high-resolution records of climatic variations, which were more sensitive to any change in past climate. The probability density of our data can be correlated to other results of Korean block streams (Fig. 8D), QMD in Luochan (Fig. 8B), EQF in Lake Biwa (Fig. 8C), growth rate of the southeastern Australian speleothems (Fig. 8E), and antiphase of Korean speleothems (Fig. 8F).
Summary of paleoclimatic data for the last glacial period. (A) Northern Hemisphere summer insolation (Berger, Reference Berger1978). (B) QMD (quartz median diameter) of Luochan, Loess Plateau, China (Xiao et al., Reference Xiao, An, Liu, Inouchi, Kumai, Yoshikawa and Kondo1999). (C) EQF (eolian quartz flux) of Lake Biwa, Japan (Xiao et al., Reference Xiao, An, Liu, Inouchi, Kumai, Yoshikawa and Kondo1999). (D) Probability density curves of exposure ages of bouldery deposits on the Korean Peninsula. The curve for Mt. Biseul (this study) is presented as a gray-colored section. The curve that refers to other study areas (Mt. Maneo, Mt. Mudeung, and Mt. Bukhan) is shown as dashed lines (recalculated from Seong and Kim, Reference Seong and Kim2003; Wakasa et al., Reference Wakasa, Matsuzaki, Horiuchi, Tanaka and Matsukura2004; Oh et al., Reference Oh, Park and Seong2012a, Reference Oh, Park and Seong2012b). Contrast between Mt. Biseul and other mountains is focused on Marine Oxygen Isotope Stage (MIS) 5, which is presented with question marks (??). (E) Growth frequency record with a relative probability density curve for southeastern Australian speleothems. (F) Growth frequency record with a relative probability density curve for Korean speleothems. (For interpretation of the references to color in this figure legend, the reader is referred to the web version of this article.)

Most tors or rockwalls (MIS 5a and 4), block streams (MIS 4 and 3), and talus deposits (MIS 2 and early Holocene) evolved in chronological succession throughout the last glacial period. The tor in DGS was likely to be first exposed at ~79.2 ka (MIS 5a) when climate proxies indicate a decrease in temperature (Fig. 8), which is coeval with the first emergence of tors in other areas of Korea (Seong and Kim, Reference Seong and Kim2003; Wakasa et al., Reference Wakasa, Matsuzaki, Horiuchi, Tanaka and Matsukura2004; Oh et al., Reference Oh, Park and Seong2012a). Block streams began to develop at ~65 ka (MIS 4) at the start of the last glacial period. According to the strong linear relationship between exposure ages of boulders and distances from rockwall (Fig. 5B), there must have been boulders produced no later than 65 ka at below the present terminus (~600 m), which were destroyed by urban development in the early 1990s (Jeon, Reference Jeon2000). Boulder supply from the rockwall increased during late MIS 4 and early MIS 3, corresponding to a rapid increase in QMD and EQF variations and a decrease in Korean speleothem records (Fig. 8). The production of boulders reached a maximum during middle MIS 3 to late MIS 2, which is coincident with a period of slow speleothem growth in Korea and an increase in quartz size or flux in East Asia. It is also coincident with an increased rate of speleothem in southeastern Australian caves. Although there are different lag times between these geomorphological and geologic proxies because of differences in growth or activity thresholds in temperature and precipitation (Harris, Reference Harris1994; Xiao et al., Reference Xiao, An, Liu, Inouchi, Kumai, Yoshikawa and Kondo1999; Vaks et al., Reference Vaks, Bar-Matthews, Ayalon, Matthews, Frumkin, Dayan, Halicz, Almogi-Labin and Schilman2006; Ersek et al., Reference Ersek, Hostetler, Cheng, Clark, Anslow, Mix and Edwards2009; Dobinski, Reference Dobinski2011), there are strong links around East Asia, indicating that those areas were wholly experiencing a cold climate regime during the last glacial period. Hence, several patterns with higher frequency and higher intensification are clearly noticeable overall in East Asia and coincide with the winter-summer monsoon seesaw. Block stream activity was generated by the periglacial activity throughout the last glacial period, was further strengthened during the winter monsoon extended period with the monsoon seesaw, and almost ceased in the early Holocene because of an increase in temperature.
Cosmogenic exposure dating of block streams on Mt. Mudeung (36Cl) and Mt. Maneo (10Be and 26Al) show similar results to those from our study area (Table 4). The tors of Mt. Maneo on rockwall have remained exposed since 78.2 ka (MIS 5a), and block streams were initially developed no later than 46.7 ka (MIS 4; recalculated from Seong and Kim, Reference Seong and Kim2003). The fact that there is a good relationship between the exposure ages determined from both 10Be and 26Al dating shows that there were few postdepositional changes in boulder aspect. Block streams on Mt. Mudeung, supplied via rockfall retreat from planar surfaces developed during the last interglacial period (MIS 5), were initiated no later than 56.9 ka and stabilized no later than 11.3 ka (early Holocene), with little downslope movement after the initial toppling of bedrock (Oh et al., Reference Oh, Park and Seong2012a, Reference Oh, Park and Seong2012b). Columnar joints in the andesite most likely promoted frost shattering, which caused detachment of the jointed boulders and caused the initial rockfall. As with Mt. Biseul, a pattern of increasing age with increasing distance from the rockwall was found (Fig. 5B). The relationship between age and distance downslope, along with the patterns in rockwall and block stream exposure age, indicates that bouldery deposits on Mt. Mudeung evolved during the last glacial period under similar climate conditions and via the same processes (frost shattering, rockwall retreat, and downslope transportation) as those at Mt. Biseul.
Although only a few samples were studied from the two mountains, all show significantly similar patterns of exposure age of each landform type (Table 4) and its relationship with downslope distance as those found for Mt. Biseul. This implies that the block streams with various geologies on the southern Korean Peninsula are relict features that experienced the same evolution history, having been initiated at the beginning of the last glacial period (early MIS 4), transported downslope, and stabilized during the last glacial period, especially between MIS 4 and MIS 2 (or the early Holocene). Given the similarities in the evolutionary histories of rockwall retreat and block stream development in the three study areas, it seems that the mountainous region of the Korean Peninsula began to experience periglacial conditions at the beginning of last glacial period (MIS 4). Several older exposures of tors throughout MIS 5 are found in other regions (“??’ in Fig. 8D). It means that the possibility still remains that tors and boulders exposed over 80 ka might have existed. According to the simple regression between the distance from rockwall and exposure ages (Fig. 5B), boulders exposed around 90 ka might have presented in the past terminal area of the block streams (Fig. 2). Other climatic proxies (Fig. 8) are also consistent with the possibility that periglacial conditions promoting frost shattering were fulfilled around 90 ka.
CONCLUSIONS
It has been hypothesized that the boulders that make up block streams on Mt. Biseul were initially produced as corestones by deep chemical weathering during an interval of warm climate and were supplied by physical stripping of a saprolite deposit under cold climate conditions (Jeon, Reference Jeon2000). However, only small-scale saprolite deposits and a limited number of round corestones are found in this area, and these are limited to low-altitude zones. Instead, angular boulders were found throughout the area. The upper slopes are covered with only angular talus deposits, whereas low-altitude slopes are mostly covered with more rounded and weathered boulders, suggesting that strong physical weathering in the upper slope areas produced most of the boulders, which then were transported to the downslope regions. We tested four hypotheses for the evolution of bouldery deposits on Mt. Biseul by investigating the characteristics of the boulders, their relationship to topography, and their 10Be exposure ages. Our results suggest that hypothesis 1-2 (i.e., a mechanism involving frost shattering, slope retreat, and downslope transport) explains the development of bouldery landforms in the study area.
Detachment of boulders from the rockwalls apparently began in early MIS 4 or MIS 5a, mostly via physical weathering because of a rapid drop in temperature. Talus continued to be supplied to block streams, which showed maximum activity from MIS 3 to MIS 2. Since the increase in temperature associated with the early Holocene, the block streams have been dormant. Over the last glacial period, the rockwall retreated horizontally by ~18.8 m at a rate of 0.4 m/ka, and block streams moved downslope horizontally over 1301.1 m at a rate of 26.0 m/ka.
Similar patterns in exposure ages of bouldery landforms and positive relationships of the age of block streams to downslope distance have been reported from Mt. Mudeung and Mt. Maneo, indicating that a common evolutionary mechanism for bouldery landforms existed across the southern Korea Peninsula since the beginning of last glacial period. It is noteworthy that the activity of block streams in the study area is out of phase with the growth rate of speleothems in an adjacent cave, which dramatically decreased during MIS 3 to MIS 2 under a cold and arid climate. Our study demonstrates that bouldery landforms in the mountains of Korea provide clues on how the landscape responded to change in climate in the past.
ACKNOWLEDGMENTS
This work was supported by the Ministry of Education of the Republic of Korea and the National Research Foundation of Korea (NRF-2015S1A5A2A01010253 to Y.B. Seong). We are thankful for the constructive and helpful comments of Dr. David Fink, Dr. Derek Booth, two anonymous reviewers, and Dr. Yawar Khan.