Seasonal influenza viruses are estimated to cause 290,000–650,000 deaths annually worldwide.1 In the 2017/2018 season alone, the US Centers for Disease Control and Prevention estimated that influenza was responsible for 48.8 million illnesses, 22.7 million medical consultations, 959,000 hospital admissions, and 79,400 deaths in the United States.2 In Canada during the same season, influenza outbreaks were reported in 193 hospitals and 1,107 long-term care facilities.3
The reservoir for seasonal influenza is infected humans, and people are at risk of contracting influenza from any other person they come into contact with including housemates, coworkers, social contacts, and, for healthcare personnel (HCP), patients. Because they are exposed to many acutely ill patients, HCP (particularly those in acute-care hospitals) may be at higher risk of contracting communicable diseases, including influenza.1A meta-analysis by Kuster et alReference Kuster, Shah and Coleman4 suggested that HCP had a higher incidence of laboratory-confirmed influenza than working-age adults, with incidence rate ratios of 5.4 (95% confidence interval [CI], 2.8–8.0) and 3.4 (95% CI, 1.2–5.7) for vaccinated and unvaccinated populations, respectively. However, cohort studies during the 2009 influenza pandemic reported no difference in the risk of influenza for HCP compared with other working age adults.Reference Alagappan, Silverman and Hancock5–Reference Tandale, Pawar and Gurav9 Whether this holds true for seasonal influenza is unknown. We undertook a study to determine whether HCP were at higher risk of seasonal influenza than adults working in non–healthcare-related businesses.
Methods
This study was a multisite prospective cohort study of HCP and other working-age adults conducted during the 2010/2011, 2011/2012, and 2012/2013 influenza seasons in Canada. HCP were recruited from 6 Toronto acute-care hospitals (N = 37,700 HCP). Non-HCP were recruited from 20 Toronto businesses in a 1:4 ratio with HCP to achieve the sample size (N = 1,320 HCP and 330 non-HCP person seasons, respectively) necessary to detect a relative risk ≥2.0. Non-HCP were required to be indoor personnel without occupational exposure to large numbers of children (eg, teachers) or adults (eg, cashiers) (see Supplementary Information online).Reference Kuster, Coleman and Raboud8 In the early fall of each year, adults aged 18–69 years were enrolled who (1) planned to be available for the full season (eg, not retiring or planning an absence of >2 weeks), (2) had an e-mail address and regular access to a computer, (3) worked ≥20 hours per week, and (4) were not taking >3 school or university courses. Participants were invited, but not required, to re-enroll in subsequent seasons. Influenza seasons were defined as starting the earlier of the first Monday following November 1 or the beginning of influenza activity (≥5% positive at regional reference laboratory) and ending whichever was the later of the first Monday following April 30 or 2 weeks after the end of the season (<3% positive for 2 consecutive weeks). The study was approved by the research ethics boards of all participating hospitals, the University of Toronto, and Ryerson University.
At enrollment, participants completed a baseline questionnaire and were trained on study procedures including the completion of weekly reports and illness diaries, the self-collection of mid-turbinate swabsReference Larios, Coleman and Drews10, Reference Smieja11 within 48 hours of developing symptoms compatible with an acute respiratory illness (ie, any new respiratory symptom including stuffy or runny nose, cough, or sore throat), any illness with a fever, or if they were feeling generally unwell. Hands-on training with swabs was provided with written instructions and a link to a training video included in study packages. Swabs were tested for influenza viruses by polymerase chain reaction (PCR) at the Mount Sinai Hospital laboratory using standard methods,12 and participants were informed of the results. During the influenza season, participants received weekly e-mails and reminder e-mails if weekly reporting of symptoms was not completed.
Participants were requested, but not required, to have serum samples collected at enrollment (if not being vaccinated) or 21 (±7) days after vaccination against influenza and again 2 weeks (+14 days) after the end of the season or study withdrawal. Blood samples were tested at the end of the season using hemagglutination inhibition (HAI) assays. Two HAI assays were performed per aliquot using a protocol adapted from World Health Organization methods13 at the Queen Elizabeth II Health Sciences Centre, Halifax, Nova Scotia, and the median of the 2 assays was used in analyses. HAI assays were conducted for strains included in the relevant season’s vaccine as well as nonvaccine strains representing >10% of samples tested at the Canadian National Microbiology Laboratory (Winnipeg, Manitoba) in that season.
Cases of influenza included those testing positive by PCR or meeting criteria for seroconversion over the season. Seroconversion was defined as a 4-fold or greater increase in HAI titers in the postseason compared to preseason and postvaccination blood samples, with a postseason titer of ≥1:40.Reference Petric, Comanor and Petti Cathy14
Multivariable analyses were conducted using generalized estimating equations with exchangeable correlation, robust standard errors, and logit link to account for clustering of data by individual for those who participated for multiple seasons. The focal variable (HCP), potential confounding variables (season, hospital, swab submission, and blood-sample submission), variables that differed significantly between HCP and non-HCP, and variables associated with the outcome at P values of ≤0.20 on bivariate analysis were included in the full model. A sensitivity analysis to assess the impact of including people who seroconverted as well as PCR diagnosed cases used the same methods but did not include the swab or blood submission as potential confounders. An exploratory analysis subdividing HCP into those who did and did not have direct patient care used the same model-building methods as the original analysis. All analyses were conducting conducted using Stata SE version 14.2 statistical software (StataCorp, College Station, TX).
Results
Overall, 474 participants were recruited in 2010/2011, 614 participants were recruited in 2011/2012, and 656 participants were recruited in 2012/2013, with 79% HCP and 21% non-HCP (P = .84 comparing the proportion of non-HCP annually). Furthermore, 82 people participated in all 3 seasons, 204 participated in 2 of 3 seasons, and 1,090 participated in 1 season only, with no difference in the distribution of repeat participation for HCP and non-HCP (P = .40). Of the 1,378 HCP enrolled in this study, 523 (38.0%) were nurses, 91 (6.6%) were physicians, 278 (20.2%) were administrative staff, 358 (26.0%) were other professionals (eg, respiratory therapists, pharmacists), and 128 were other nonprofessional staff (eg, porters, food service staff). Importantly, 661 participants (48.0%) reported providing direct patient care. Of 1,744 participants, 915 (52.5%) provided both pre- and postseason blood samples.
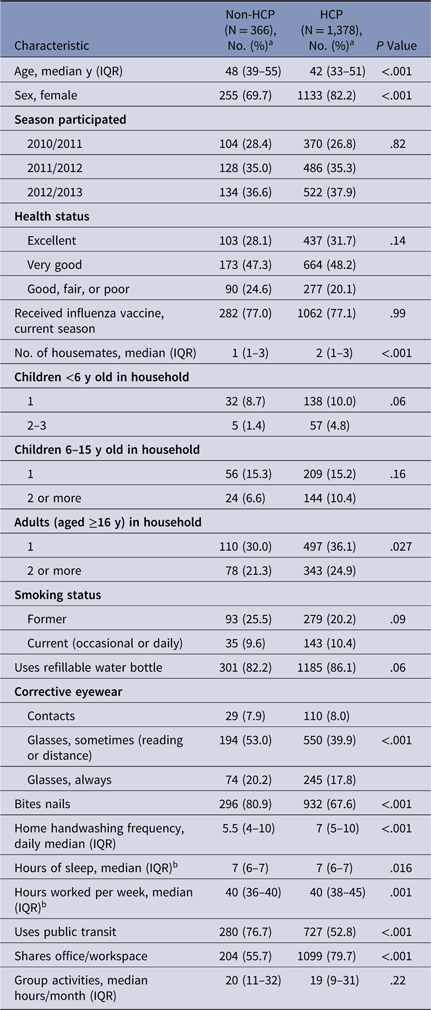
Compared to HCP, non-HCP were older, more likely to be male, had fewer housemates, and were more likely to use corrective eyewear, to bite their nails, to work alone in an office, and to use public transit (Table 1). They also reported washing their hands less frequently while at home, they slept more hours per day, and they worked fewer hours per week than HCP. However, they were equally likely to be vaccinated against influenza (77%), to participate in group activities (clubs, church, etc), to agree to serology (718 of 1,378 [52.1%] vs 197 of 366 [52.7%]; P = .56), and participated for an equal length of time in the study (median days, 200 vs 198; P = .42). HCP were somewhat less likely to submit swabs for influenza testing (638 of 1,378 [46.3%] vs 193 of 366 [52.7%]; P = .03).
Characteristics of Study Participants by Workplace Category—Toronto, Ontario, 2010/2011, 2011/2012, and 2012/2013 Influenza Seasons

Note. HCP, healthcare personnel; non-HCP, non healthcare personnel; IQR, interquartile range;
a May not add to total due to missing responses.
b Although the medians for hours of sleep per day and hours worked per week are the same, distributions are nonnormal and different between the groups. Mean hours of sleep (standard deviation) were 6.78 (0.82) for non-HCP and 6.66 (0.96) for HCP. Mean hours worked were 38.87 (10.97) for non-HCP and 42.35 (10.32) for HCP.
During the 3 influenza seasons, there were 106 cases of influenza in 101 individuals: 1 person contracted influenza twice in the same season (influenza A(H1N1) and influenza B) and is included only once in this analysis, and 4 people contracted influenza twice but in different seasons. Most cases were detected by PCR testing of self-collected nasal swabs (70 of 105, 66.7%), 35 (33.3%) were detected through seroconversion only, and 12 of 105 had positive swabs and seroconverted. Of the 35 cases detected by serology alone, 12 did not report any respiratory or systemic symptom over the winter suggesting their infections were asymptomatic (11.4% of all cases).
The overall attack rate was 6.0% (4.6%–8.1% per season), and for symptomatic PCR-confirmed influenza it was 4.0% (2.7%–5.8% per season). In vaccinated and unvaccinated participants, the symptomatic attack rates were 3.2% and 6.7%, respectively. Vaccine effectiveness rates for all laboratory-confirmed cases, adjusted for age, sex, season, and health status were 80.9% (95% CI, 54.6 to 91.9) in 2010/2011, 67.6% (95% CI, 29.8 to 85.0) in 2011/2012, and 32.7% (95% CI, −28.7 to 64.8) in 2012/2013. The adjusted vaccine effectiveness rates using symptomatic cases were similar: 66.6% (95% CI, −4.4 to 89.3) in 2010/2011, 71.7% (95% CI, 27.9 to 88.9) in 2011/2012, and 30.3% (95% CI, −48.0 to 67.2) in 2012/2013.
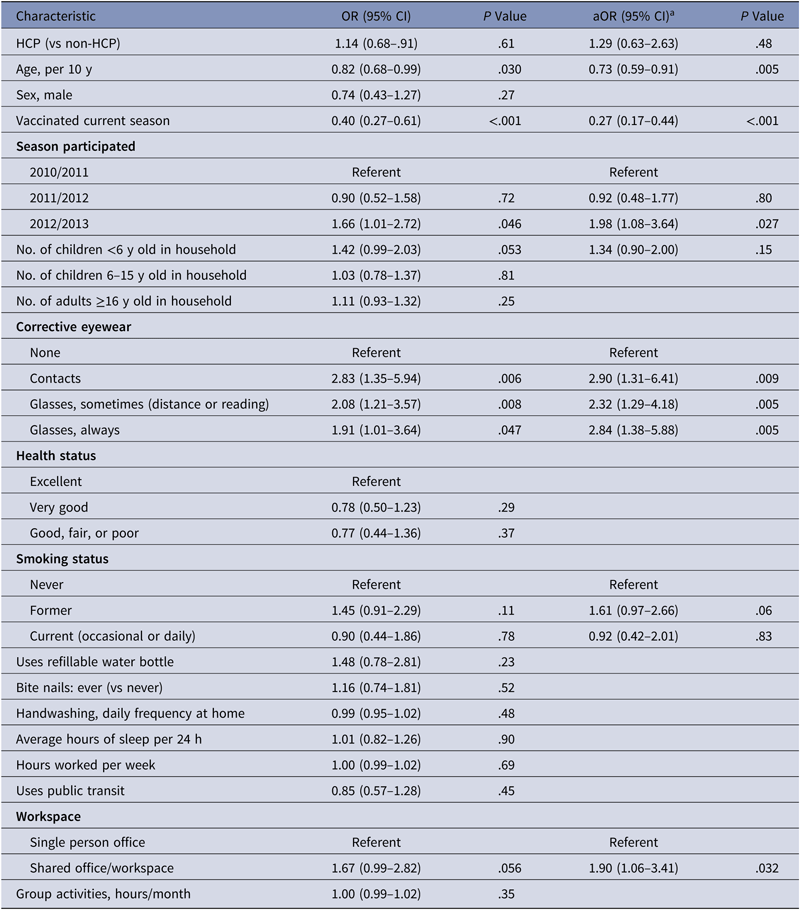
The per-season influenza attack rates were similar between HCP and non-HCP overall (6.2% and 5.5%, respectively; P = .62), and they did not differ significantly in the vaccinated subgroup (4.5% HCP vs 5.0% non-HCP; P = .75) or in the nonvaccinated subgroup (11.7% HCP vs 7.1% non-HCP; P = .23). Adjusted vaccine effectiveness estimates were nonsignificantly higher for HCP (64.5%; 95% CI, 43.6 to 77.6) than for non-HCP (27.4%; 95% CI, −21.5 to 76.2). As shown in Table 2, the adjusted odds ratio (aOR) of influenza was similar (aOR, 1.29; 95% CI, 0.63 to 2.63) for HCP and non-HCP. The odds of influenza were significantly lower for participants who were vaccinated against influenza (aOR, 0.27; 95% CI, 0.17 to 0.44) and decreased with age (aOR, 0.73; 95% CI, 0.59 to 0.91 per 10 years). The odds of influenza were higher for participants who shared their workspace with others (aOR, 1.90; 95% CI, 1.06 to 3.41) and who used corrective eyewear (OR, 2.32–2.90, depending on category).
Factors Associated With Influenza Infection, Influenza Cohort Study—Toronto, Ontario, 2010/2011, 2011/2012, and 2012/2013 Influenza Seasons

Note. CI, confidence interval; HCP, healthcare personnel; OR, odds ratio; aOR, adjusted OR.
a Odds ratios and P values for multivariable analysis are shown for the focal variable (HCP vs non-HCP) and explanatory variables with P ≤ .20 in the multivariable analysis. Estimates are adjusted for other variables in this column as well as number of swabs submitted, whether submitted serum samples or not, work site, sex, number of children aged 6–15 y in home, number of adult housemates, nail biting, handwashing, hours of sleep, hours of work, and use of public transit.
Analysis of cases detected by PCR alone resulted in a similar estimate (aOR, 1.33; 95% CI, 0.58 to 3.03) for the odds of influenza between HCP and non-HCP (see Supplementary Table S1 online). Again, people who were vaccinated against influenza were at significantly lower odds (aOR, 0.43; 95% CI, 0.25 to 0.73), and those who wore corrective eyewear were at significantly higher odds (aOR, 2.68; 95% CI, 1.15 to 6.28) of influenza. Although sharing an office was positively associated with influenza as detected by nasal swab, the association was not statistically significant in this subanalysis (aOR, 1.57; 95% CI, 0.80 to 3.80).
We detected no significant difference in the odds of influenza for HCP with (aOR, 1.13; 95% CI, 0.51 to 2.49) and without (aOR, 1.38; 95% CI, 0.67–2.88) direct physical patient contact compared with non-HCP. Other covariates had similar parameter estimates as in the original model (see Supplementary Table S2 online).
Discussion
During the 2010/2011, 2011/2012, and 2012/2013 influenza seasons, there was no difference in the risk of laboratory-confirmed influenza for adults working in acute care hospitals compared with those working in non–healthcare-related indoor office work in Toronto, Canada after adjusting for vaccination and other factors. It is possible that we were unable to detect the occupational risk to HCP because nonoccupational exposures overwhelm that risk. It may also be that adherence to hand hygiene and other standard precautions in addition to hospital screening for influenza with droplet and contact precautions for identified patients may effectively reduce occupational risk to HCP. It is also possible that occupational risk in HCP is counterbalanced by better adherence by HCP than other adults to protective measures outside the workplace.
Our results are compatible with those of previous studies. When comparing symptomatic influenza only, the meta-analysis by Kuster et alReference Kuster, Coleman and Raboud8 estimated an attack rate of 4.8% (95% CI, 3.2–7.2) per season for vaccinated HCP, with an incidence rate ratio (IRR) of 1.6 (95% CI, 0.5–2.7) compared to other vaccinated adults. We estimated a symptomatic attack rate of 4.5% (95% CI, 3.4–5.9) per season for vaccinated HCP with adjusted odds of 1.3 (95% CI, 0.6–3.0). Williams et alReference Williams, Schweiger and Diner15 reported a single-season (2006/2007) serologically confirmed attack rate of 7.0% in vaccinated adults (not just HCP), with an OR of 1.09 (95% CI not provided) comparing HCP to non-HCP. Similarly, pooled results from 5 cohort studies conducted during the 2009 influenza pandemic found no significant difference between HCP and non-HCP (pooled OR, 0.87; 95% CI, 0.46–1.27), though there was evidence of heterogeneity.Reference Alagappan, Silverman and Hancock5–Reference Tandale, Pawar and Gurav9 One potentially important difference between cohorts comparing influenza risk in HCP and others is the definition of HCP and non-HCP. We defined HCP as all personnel in acute-care hospitals and restricted non-HCP to those without occupational exposure to large numbers of people. Williams et alReference Williams, Schweiger and Diner15 defined HCP as those who worked with “unwell” patients on a daily basis in acute-care hospitals and non-HCP as other hospital personnel and those not working with unwell patients in other settings. Other investigators have defined HCP by where they work in the hospital or by whether they have contact with patients and/or provide patient care. Differing definitions may result in differing risk of exposure to both infected patients and coworkers and may result in different relative estimates of risk for influenza. However, our exploratory analysis comparing the risk of influenza for HCP with and without direct patient contact to non-HCP found no significant difference in the 3 groups.
In the current study, 11% of cases were detected by serology alone without any respiratory symptoms reported in weekly diaries. This rate is lower than the 29%–30% of cases reporting no symptoms in other recent studies based on serology alone,Reference Alagappan, Silverman and Hancock5, Reference Williams, Schweiger and Diner15 but it is similar to a meta-analysis in which an estimated 16% of influenza infections were asymptomaticReference Leung, Xu, Ip and Cowling16 as well as to 2 household contact studies reporting that 10%–11% of contacts shed influenza viruses without discernable symptoms.Reference Ip, Lau and Leung17, Reference Loeb, Singh and Fox18 Because only half of our subjects submitted serum samples, asymptomatic infection is underestimated in our study. However, our threshold for swab submission was deliberately set very low. Participants were asked to submit a swab when they had only 1 respiratory symptom or an unexplained fever, even if they did not think that they had an infection. Thus, we might have included infections as symptomatic that would be considered asymptomatic in other studies. In a household study conducted in Hong Kong, 13% of cases of PCR-confirmed influenza reported only 1 symptom, most often a runny nose (32%), fever (26%), or headache (19%).Reference Ip, Lau and Leung17 Having only 1 symptom would have excluded participants from testing for influenza in many studies. This factor is a concern for infection control practitioners because as many as 25% of persons infected with influenza (including patients, visitors, and staff) may be asymptomatic or pauci-symptomatic and not overtly ill. In the study by Lau et al,Reference Ip, Lau and Leung17 mean viral loads for asymptomatic/pauci-symptomatic infections were similar to those for persons with influenza-like illness symptoms for influenza A(H3N2) and were only 1–2 log lower for people with influenza A(H1N1) or B.
Although having children <18 years of age living in the household was associated with influenza infection in studies conducted in Germany, the United States, and Australia,Reference Alagappan, Silverman and Hancock5, Reference Marshall, Kelso and McBryde19, Reference Williams, Schweiger and Diner15 we did not find a statistically significant association in either our previous study, done during the 2009 influenza pandemic,Reference Kuster, Coleman and Raboud8 or in this study. However, our study participants were exposed to significantly fewer children at home than participants in the 2 studies that provided sufficient data for comparison.Reference Alagappan, Silverman and Hancock5, Reference Williams, Schweiger and Diner15 We did find a trend to an increased risk of infection with exposure to a larger number of children under 16 years of age in the household; thus, our data should not be interpreted to suggest that exposure to children is not a risk factor for influenza in adults.
Sharing workspace with other people was associated with higher odds of influenza infection in this study. This variable was used as a proxy for close contact and/or shared airspace with coworkers. We did not measure air flow in workspaces or attempt to assess the degree of crowding. Nonetheless, our data suggest the potential for transmission of influenza in shared workspaces. Further research is needed to assess whether the risk is sufficient to warrant mitigating interventions during either seasonal or pandemic influenza epidemics.
The association between using corrective eyewear and risk of influenza infection was also seen in our previous study of pandemic influenza, but it remains unexplained. This question was asked, as was use of refillable water bottles and fingernail biting, as proxy measures for hand contact with facial mucous membranes. This association suggests that eye glasses either do not effectively protect from ocular contamination by droplets or that the protection against droplets is overwhelmed by an increased risk of touching near the eyes. It is also compatible with the demonstrated success of experimental transocular influenza infectionReference Bischoff, Reid, Russell and Peters20 if, indeed, eyeglass and contact lens wearers are more likely to touch their eyes. However, we are unaware of evidence that this hypothesis is correct. In fact, a cross-sectional study of Japanese adults found that wearing eyeglasses (but not contacts) was not associated with more frequent self-reported hand-to-face touching, although it was reported to be associated with an increased risk of acute respiratory illness.Reference Fukunaka, Sawada and Nishiura21
This study has several strengths. It was conducted over 3 influenza seasons and included adults from the same city, which should have reduced confounding due to differences in the circulating influenza strains and rate of infection in the community. This study also has several limitations. Despite our attempts to recruit from workplaces in similar geographic areas to reduce variability in potential public transit exposure, such exposure was different in HCP and other adults, and we might not have been able to detect its impact. Numerous other differences between the 2 groups that may have been incompletely corrected for in our multivariable analysis. The high rate of vaccination in our cohort may have reduced our ability to identify differences between HCP and non-HCP; however, we have no evidence that vaccination would have a differential effect between the groups. Also, the rate of influenza infection will have been higher than we have reported because only 52% of participants had both pre- and postseason serology testing.
In summary, we were unable to detect an increased risk of influenza infection in HCP compared to other working adults, despite selecting a group of non-HCP without other occupational risks (eg, exposure to many young children or adults). Factors associated with increased risk of influenza infection in our working adults included absence of vaccination, younger age, and wearing glasses or contact lenses. These findings should not be perceived to mean that HCP should not receive influenza vaccine. Influenza vaccine is recommended for all adults because it confers significant individual benefits. More importantly, HCP vaccination reduces the risk of influenza and mortality from influenza in the vulnerable adults they care for. Because people with influenza are infectious before they develop symptoms,Reference Ip, Lau and Leung17, Reference Loeb, Singh and Fox18 may be asymptomatic or pausi-symptomatic,Reference Ip, Lau and Leung17, Reference Leung, Xu, Ip and Cowling16 or attend work while symptomatic,Reference Jiang, McGeer and McNeil22 a policy of exclusion from work while symptomatic will be inadequate to protect patients.
Acknowledgments
We offer our sincere appreciation to our dedicated research staff and to all participants for their contributions to the study. We also wish to acknowledge the contributions of nonauthor members of the Canadian Healthcare Worker Study Group: Steven Drews, Linn Holness, Janet Raboud, Joanne Langley, Tony Mazzulli, Kathryn Nichol, Leon Genesove, John Oudyk, Lisa McCaskell, and Nancy Johnson.
Financial support
This work was funded by the Ontario Workplace Safety and Insurance Board (grant no. 10031) and the Canadian Institutes of Health Research (grant no. 111187).
Conflicts of interest
No authors report a conflict of interest relevant to this article.
Supplementary material
To view supplementary material for this article, please visit https://doi.org/10.1017/ice.2019.334