INTRODUCTION
Humpback whales (Megaptera novaeangliae, Borowski 1781) are a cosmopolitan species that migrate from summer feeding grounds in temperate or polar waters to winter breeding grounds in tropical waters (Kellogg, Reference Kellogg1929). The western North Atlantic humpback whale population consists of several discrete feeding sub-populations that are located in the Gulf of Maine, eastern Canada, west Greenland, Iceland and Norway (Katona & Beard, Reference Katona and Beard1990; Stevick et al., Reference Stevick, Allen, Clapham, Katona, Larsen, Lien, Mattila, Palsbøll, Sears, Sigurjónsson, Smith, Vikingsson, Øien and Hammond2006). Humpback whales exhibit strong maternal site fidelity to these different feeding areas, and therefore there is little exchange between feeding grounds (Clapham & Mayo, Reference Clapham and Mayo1987; Katona & Beard, Reference Katona and Beard1990; Larsen et al., Reference Larsen, Sigurjonsson, Oien, Vikingsson and Palsbøll1996). For this reason, humpback whales in the Gulf of Maine are treated as a separate sub-population from whales in other North Atlantic feeding grounds (International Whaling Commission (IWC), 2002). The Gulf of Maine feeding ground ranges from Cape Cod and Massachusetts Bay up to the coastal waters off Maine and southern Nova Scotia.
Among the Gulf of Maine feeding sites, Massachusetts Bay has received far less visual and acoustic survey attention compared to adjacent areas such as Stellwagen Bank National Marine Sanctuary (SBNMS) or Jeffrey's Ledge (Pittman et al., Reference Pittman, Costa, Kot, Wiley, Kenney, Battista, Clark and Pittman2006), particularly at times of the year falling outside of the humpback whale feeding season (Payne et al., Reference Payne, Wiley, Young, Pittman, Clapham and Jossi1990; Clapham et al., Reference Clapham, Baraff, Carlson, Christian, Mattila, Mayo, Murphy and Pittman1993; Weinrich, Reference Weinrich1998). Visual surveys that were conducted in Massachusetts Bay from mid-April to October over a period of eleven years, and during January and February over a four-year period, suggest that relatively greater numbers of humpback whales are consistently found in the bay during the summer feeding season than during winter months (Clapham et al., 1993). However, because of the limited survey effort in early spring and late autumn, this study could not reliably evaluate the coarse migratory movements of whales into and out of Massachusetts Bay.
The objectives of acoustic surveys conducted in the Gulf of Maine prior to this study, were to characterize the occurrence of singing activity at different spatial and temporal scales, not necessarily to determine the seasonal occurrence of humpback whales. For example, in Georges Bank (east of Cape Cod and south of Massachusetts Bay), during mid-May to early June, singing occurred on a daily basis over the spring–summer survey period (Clark & Clapham, Reference Clark and Clapham2004). In SBNMS, peaks in singing activity were detected during the autumn and spring (e.g. October to December and April to May), and an obvious reduction in song occurrence was detected during the summer to early autumn and during the winter to early spring (e.g. June to September and January to March; Vu et al., Reference Vu, Risch, Clark, Gaylord, Hatch, Thompson, Wiley and Van Parijs2012). Singing is a male breeding display and therefore song detection only identifies the presence of reproductive males; other age-classes and sex-classes (i.e. females and non-reproductive males) are not vocally detected when acoustic monitoring relies solely on the detection of song. However, several humpback whale vocalization types, including song and non-song sounds (e.g. feeding and social vocalizations), have been documented on feeding grounds (Thompson et al., Reference Thompson, Cummings and Ha1986; Cerchio & Dahlheim, Reference Cerchio and Dahlheim2001; Clark & Clapham, Reference Clark and Clapham2004; Palmer et al., Reference Palmer, Parks, Wiley, Weinrich, Tackaberry, Bocconcelli and Friedlaender2010; Stimpert et al., Reference Stimpert, Au, Parks, Hurst and Wiley2011). Thus, to quantify the seasonal occurrence of humpback whales using passive acoustic monitoring, both song and non-song vocalizations should be used as evidence of humpback whale presence, particularly for those times of year when singing activity is minimal, thus detecting all vocalizing whales not just singing males.
In this study, we used data from passive acoustic monitoring arrays in Massachusetts Bay and SBNMS to determine the daily presence of acoustically active humpback whales, and to understand the long-term seasonal dynamics of humpback whales in this area. By detecting both song and non-song vocalizations, we demonstrate that humpback whales occur in the Massachusetts Bay and SBNMS area for a greater proportion of the year than previously reported, suggesting that this may represent an important near-year-round habitat for some subset of the population.
MATERIALS AND METHODS
Acoustic recording
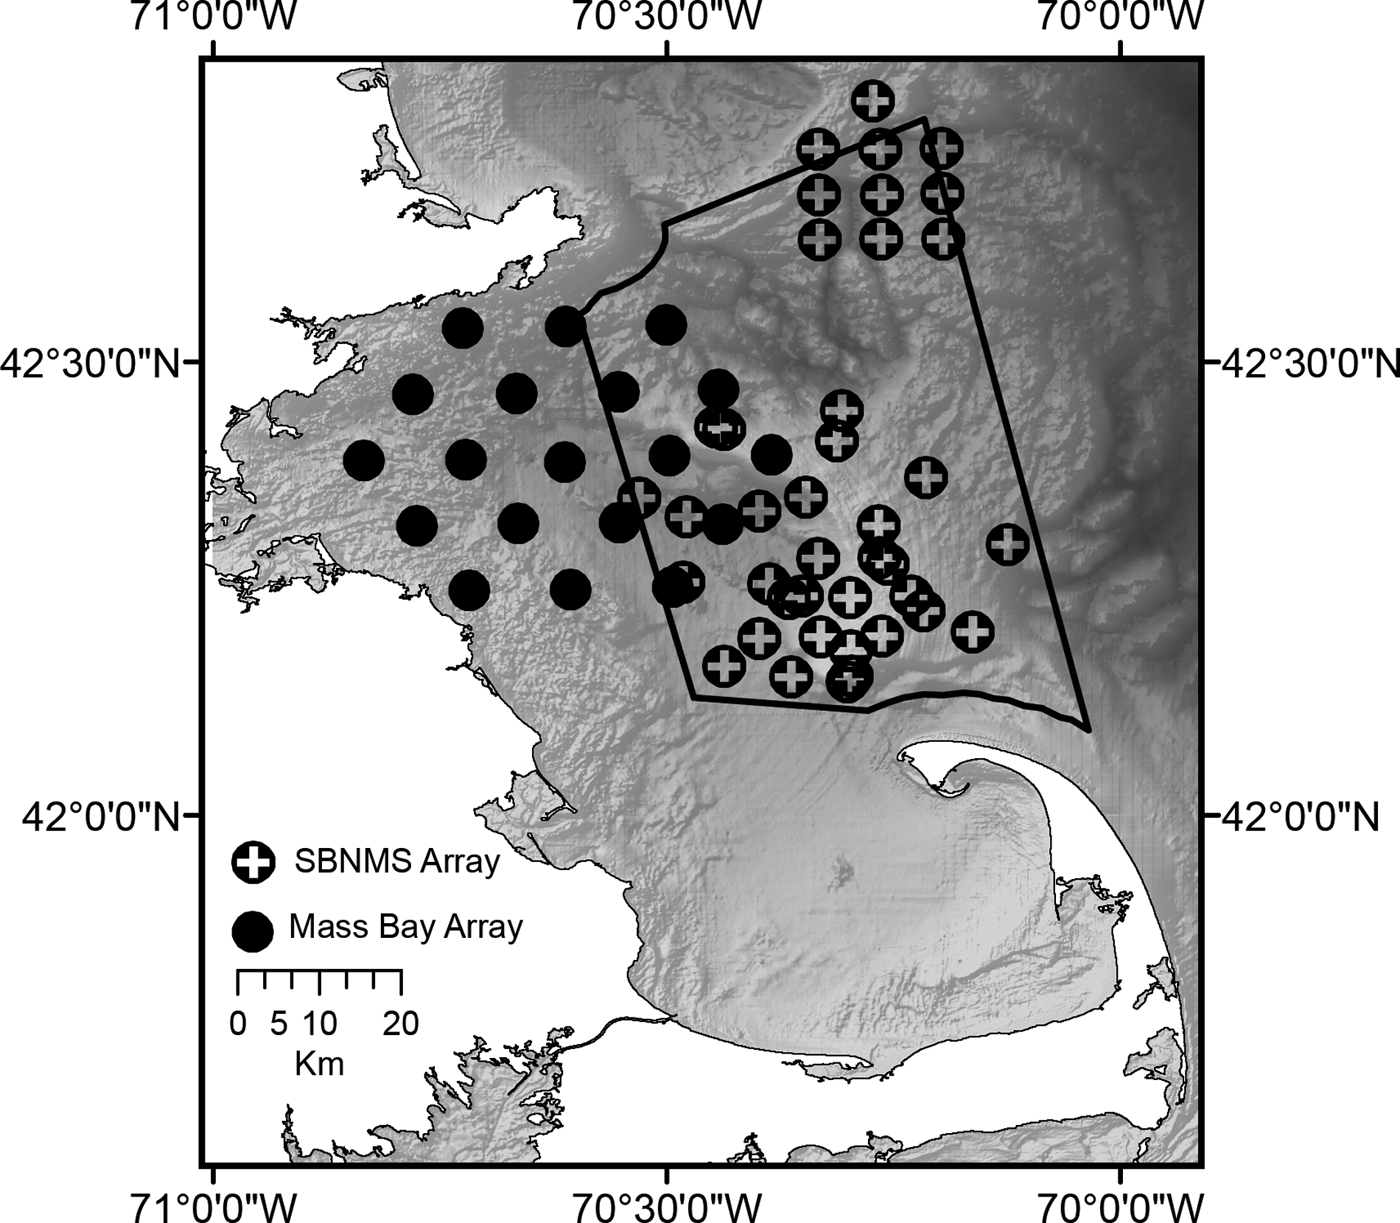
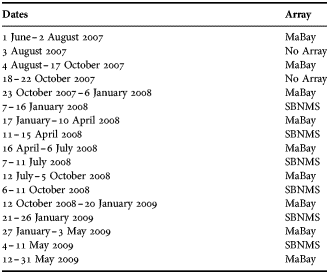
As part of an ongoing effort to understand and monitor the acoustic ecology of Massachusetts Bay as an important marine mammal habitat (e.g. Clark et al., Reference Clark, Tremblay, Fowler, Diamond, Ponirakis, McCarthy, Morano, Muirhead, Murray, Rowland, Vannicola and Warde2008, Reference Clark, Ellison, Southall, Frankel, Ponirakis, Tremblay, Warde and Spaulding2009a, Reference Clark, Ellison, Southall, Hatch, Van Parijs, Frankel and Ponirakisb; Hatch et al., Reference Hatch, Clark, Merrick, Van Parijs, Ponirakis, Schwehr, Thompson and Wiley2008; Van Parijs et al., Reference Van Parijs, Clark, Sousa-Lima, Parks, Rankin, Risch and Van Opzeeland2009; Morano et al., Reference Morano, Rice, Tielens, Estabrook, Murray, Roberts and Clark2012a, Reference Morano, Salisbury, Rice, Conklin, Falk and Clarkb), an array of marine autonomous recording units (MARUs; Calupca et al., Reference Calupca, Fristrup and Clark2000) was deployed from June 2007 through to May 2009. MARUs were deployed in several different array configurations (Figure 1; Table 1). The array centred in Massachusetts Bay contained 19 MARUs deployed in a hexagonal configuration (approximately 9 km between MARUs), and covered Massachusetts Bay and the western edge of SBNMS (referred to as the MaBay array in Figure 1 and Table 1). The arrays in SBNMS, contained 8–10 MARUs (with 5–11 km between units), and were deployed in various locations within SBNMS (referred to as the SBNMS arrays in Figure 1 and Table 1).
A map of Massachusetts Bay and Stellwagen Bank National Marine Sanctuary (SBNMS; outlined by the black dashed line), and locations of the MaBay and SBNMS MARU arrays. The MaBay array (black circles) was centred in Massachusetts Bay and contained 19 MARUs deployed in a hexagonal configuration covering Massachusetts Bay and the western edge of SBNMS. The arrays in SBNMS (circles with a cross) contained 8-10 MARUs and were deployed in various locations within SBNMS.

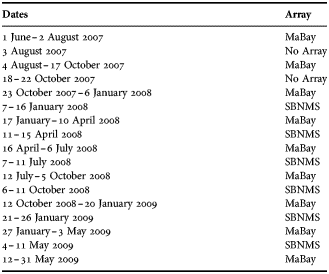
The deployment dates for each array that was used for acoustic data collection. The array labelled MaBay recorded 94% of the data (685 days) used in analysis. The arrays labelled SBNMS recorded 5% of the data (40 days) used in analysis.
All MARUs recorded continuously during deployments lasting 90–100 days at a sampling rate of 2000 Hz, had an effective bandwidth of 15–800 Hz (due to high-pass and low-pass filters), a flat frequency response (±1 dB) in the 15–585 Hz band, and uniform sensitivity in the 15–800 Hz band. At the end of each deployment, MARUs were retrieved, refurbished (data extracted and batteries replaced), and re-deployed.
Due to varying weather conditions and logistical constraints there were 46 days during the two-year, 731-day study period, for which no data were collected on the MaBay array. Acoustic data from the SBNMS arrays were used to fill in 40 days of these MaBay recording gaps, leaving 6 days for which there were no data (3 August 2007 and 18–22 October 2007). By this process, a total of 725 days (99%) of acoustic data were collected during the 731-day study effort; 685 days (94%) from the MaBay array and 40 days (5%) from SBNMS arrays.
Daily presence
Spectrograms of the acoustic data were reviewed to determine the daily occurrence of acoustically active humpback whales using the MatLab-based acoustic analysis software, XBAT (BRP, 2012), using a Hanning window, 512 pt FFT and 26% overlap. Analysts, with expertise in baleen whale bioacoustics, confirmed daily presence of humpback whales, if either humpback song (Payne & McVay, Reference Payne and McVay1971; Clark & Clapham, Reference Clark and Clapham2004) or the relatively shorter un-patterned non-song vocalizations referred to as social or feeding sounds (Silber, Reference Silber1986; Thompson et al., Reference Thompson, Cummings and Ha1986; Chabot, Reference Chabot1988; Cerchio & Dahlheim, Reference Cerchio and Dahlheim2001; Dunlop et al., Reference Dunlop, Noad, Cato and Stokes2007; Dunlop et al., Reference Dunlop, Cato and Noad2008) were detected.
Humpback vocalizations were detected and verified in a three-step process. First, vocalizations were opportunistically detected by analysts while reviewing daily potential North Atlantic right whale (Eubalaena glacialis) up-calls based on an automatic up-call detection process (Urazghildiiev et al., Reference Urazghildiiev, Clark, Krein and Parks2009) or potential fin whale (Balaenoptera physalus) 20 Hz song notes or down-sweep calls based on an automatic detection process (Urazghildiiev et al., Reference Urazghildiiev, Clark and Krein2008), as part of ongoing research on these species in this geographic region (Morano et al., Reference Morano, Rice, Tielens, Estabrook, Murray, Roberts and Clark2012a, Reference Morano, Salisbury, Rice, Conklin, Falk and Clarkb). Humpback whale song and non-song vocalizations occur at frequencies greater than 20 Hz and therefore were easily distinguished from fin whale song. North Atlantic right whale up-calls occur at similar frequencies to some humpback whale vocalizations (50–350 Hz; Clark et al., Reference Clark, Gillespie, Nowacek, Parks, Kraus and Rolland2007), however, up-calls are not produced as a sequence of calls and, therefore, can be distinguished from the humpback whale song and non-song sequences that were detected in this study (see Supplemental Figures 1–2 for exemplars of humpback whale vocalizations used in this study as evidence of humpback whale presence). Second, if a humpback vocalization was not detected opportunistically for the day, the analyst searched through the acoustic data for a humpback song or non-song vocalizations starting at midnight. Once a humpback vocalization was confirmed, the analyst stopped reviewing the acoustic data for that day. If no vocalization was detected then the analyst continued reviewing the acoustic data until the end of the day, thereby confirming there was no humpback acoustic detection on that day. Third, after the analysis team completed steps one and two, one of us (A.M.) verified the entire two-year daily occurrence dataset and reconfirmed that the vocalizations were either humpback whale song or non-song vocalizations. The positive daily detection of a humpback vocalization was taken as evidence of humpback whale daily presence in the Massachusetts Bay or SBNMS areas. When humpback vocalizations were not detected, we assumed that humpback whales were absent in the study areas on that day. This assumption may introduce the possibility of a type II error (false negative), but we believe it to be reasonable based on previous combined acoustic and visual surveys on other baleen whales (Clark et al., Reference Clark, Brown and Corkeron2010).
We did not measure the detection range of the MARUs with respect to humpback whales. However, Morano et al. (Reference Morano, Rice, Tielens, Estabrook, Murray, Roberts and Clark2012a) estimated that the detection range of the Mass Bay array was 25 km for right whale contact calls, and therefore the recording area was approximately 4000 km2, which covered Massachusetts Bay and approximately 80% of SBNMS. Right whale contact calls have a source level between 147 and 154 dB re 1 μPa (Parks & Tyack, Reference Parks and Tyack2005), whereas humpback whale vocalizations have source levels that vary from 151–173 dB re 1 μPa for humpback whale song (Au et al., Reference Au, Pack, Lammers, Herman, Deakos and Andrews2006) and from 162–190 dB re 1 μPa for humpback whale feeding and social vocalizations (Thompson et al., Reference Thompson, Cummings and Ha1986). Since humpback whale vocalizations are produced at either a similar or greater source level than right whale contact calls, we think it is reasonable to assume the detection range of the MaBay and SBNMS arrays, with respect to humpback whales, is similar to that estimated by Morano et al. (Reference Morano, Rice, Tielens, Estabrook, Murray, Roberts and Clark2012a).
Weekly and monthly presence
The daily presence data were used to calculate percentage values for weekly and monthly presence. The data were divided into two years based on the deployment cycle, where Year 1 consisted of data from 1 June 2007 to 31 May 2008 and Year 2 consisted of data from 1 June 2008 to 31 May 2009. The latter portion of Year 1 contained February 2008, and 2008 was a leap year; therefore February had an additional 29th day. However, despite this extra calendar day, due to gaps in the 2007 recordings the total number of days recorded during Year 1 was 360 days. Year 2 contained the portion of 2008 that was unaffected by the leap year, and therefore was a regular year with 365 days of continuous recordings. Each year was further divided into 52 weeks and 12 calendar months.
The percentage of time that humpback whales were detected per week, was referred to as the ‘weekly-presence’, and calculated as:
 $${\rm weekly - presence = }\displaystyle{{{\rm number of days per week with whale presence}} \over {{\rm number of days recorded per week}}} \times 100$$
The number of days recorded per week was seven, except for the following weeks: 3–9 August 2007 (six days recorded), 12–18 October 2007 (six days recorded), and 19–25 October 2007 (three days recorded). The percentage of time that humpback whales were detected per month, was referred to as the ‘monthly-presence’, and calculated as:
 $${\rm monthly - presence = }\displaystyle{{{\rm number of days per month with whale presence}} \over {{\rm number of days recorded per month}}} \times 100$$
For all months, except August and October 2007, the entire month was recorded. August 2007 was missing one day (30 days recorded) and October 2007 was missing five days (26 days recorded).
Statistical analysis
To characterize the weekly and monthly seasonal occurrence, several statistical tests were applied to the weekly-presence and monthly-presence data. A Mann–Whitney U-test was used to determine any yearly differences in weekly-presence and monthly-presence values. A Kruskal–Wallis test followed by Mann–Whitney U multiple comparisons tests with Bonferroni-adjusted significance levels (Rice, Reference Rice1989; Zar, Reference Zar1999), were used to determine any significant weekly or monthly differences in presence.
RESULTS
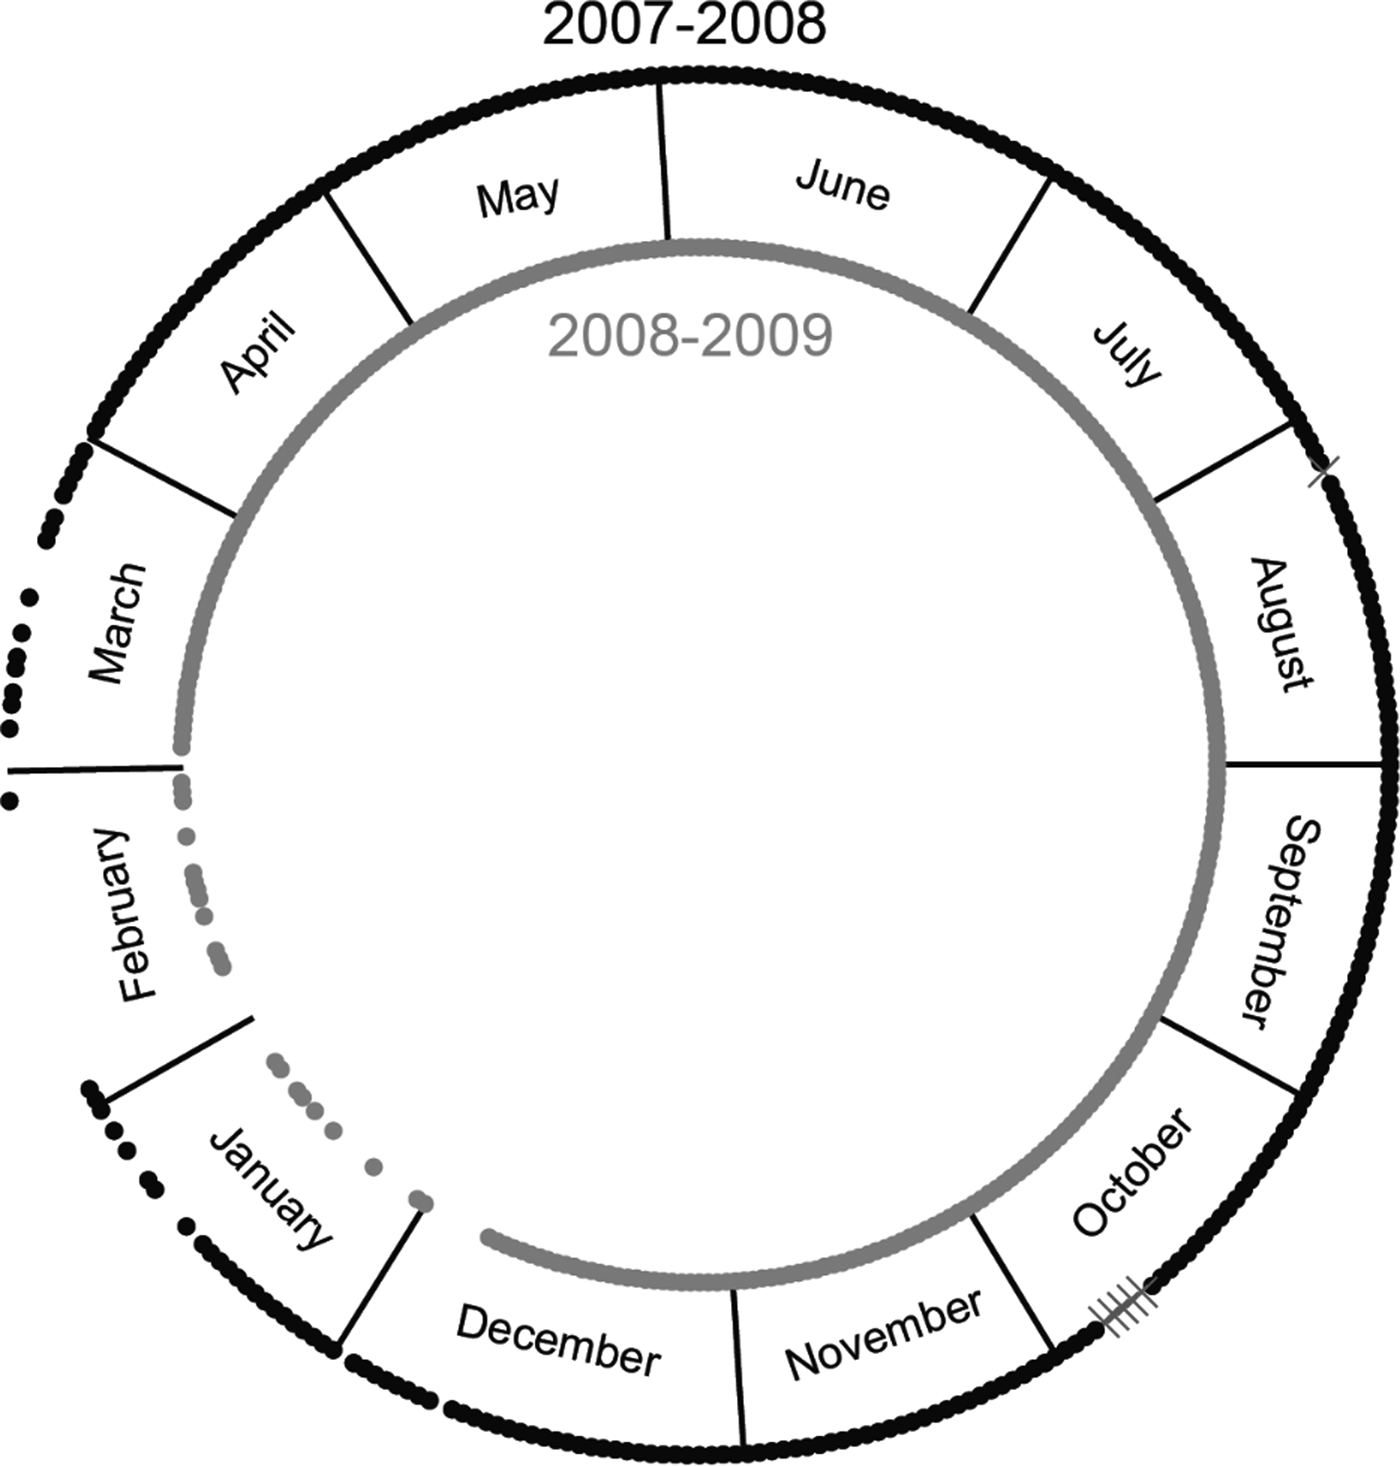
Humpback whale vocalizations were detected on 633 out of 725 days (87%; Figure 2) of the two-year study period, indicating a consistent and near continuous presence of humpbacks in the Massachusetts Bay region. However, in both years, there was a time period, predominantly during the winter months, within which the daily presence of humpback whales was variable (Figure 2). From a broad temporal perspective, it is clear that humpback whales consistently and continuously occur in Massachusetts Bay from April through to November, and then their presence becomes variable during the late-December through to late-March period (Figures 4–6).
Daily presence of humpback whales during the two-year study period; the black outer circle is Year 1 (2007–2008) and the grey inner circle is Year 2 (2008-2009). For Year 1, days with humpback whale presence are represented with black dots, days without humpback vocalizations are blank, and the black x's represent days without data (3 August 2007 and 18–22 October 2007). For Year 2 the days with humpback whale presence are represented with grey dots, days without humpback whale vocalizations are blank. In both years daily presence is consistent for April through to November, and is variable from December to March.
Humpback whale presence
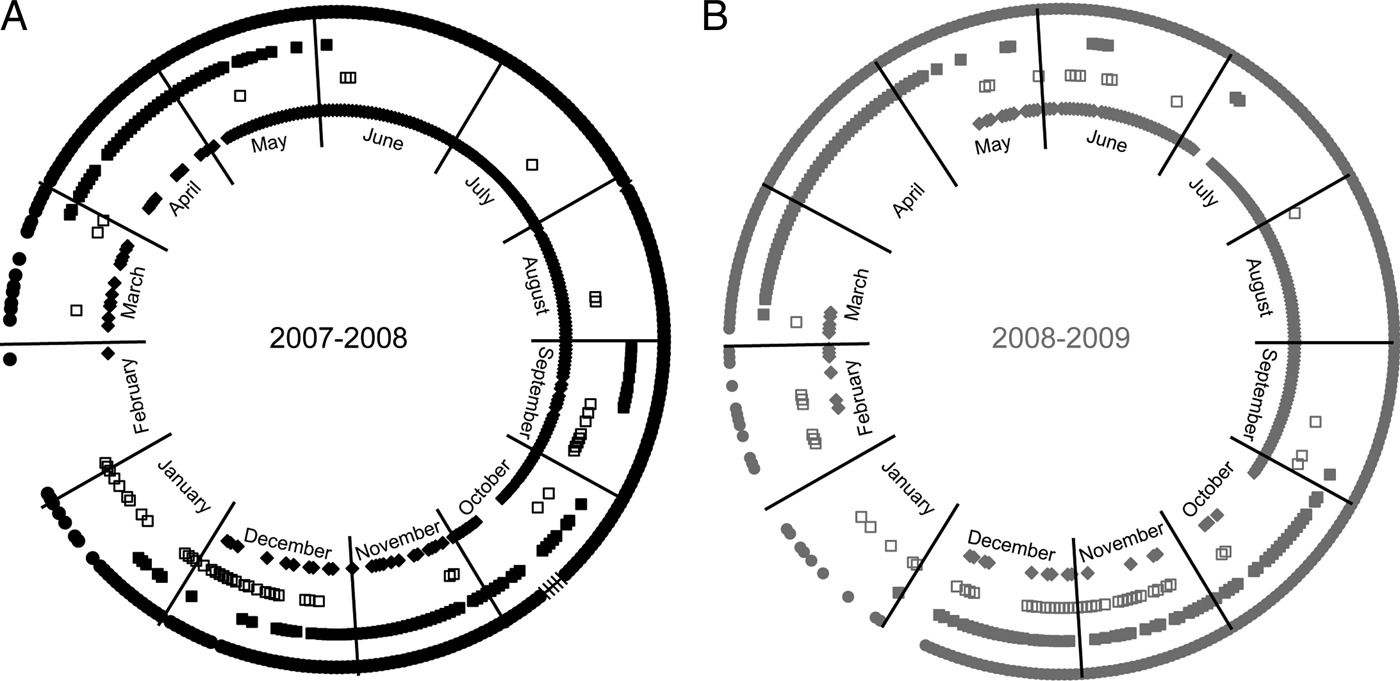
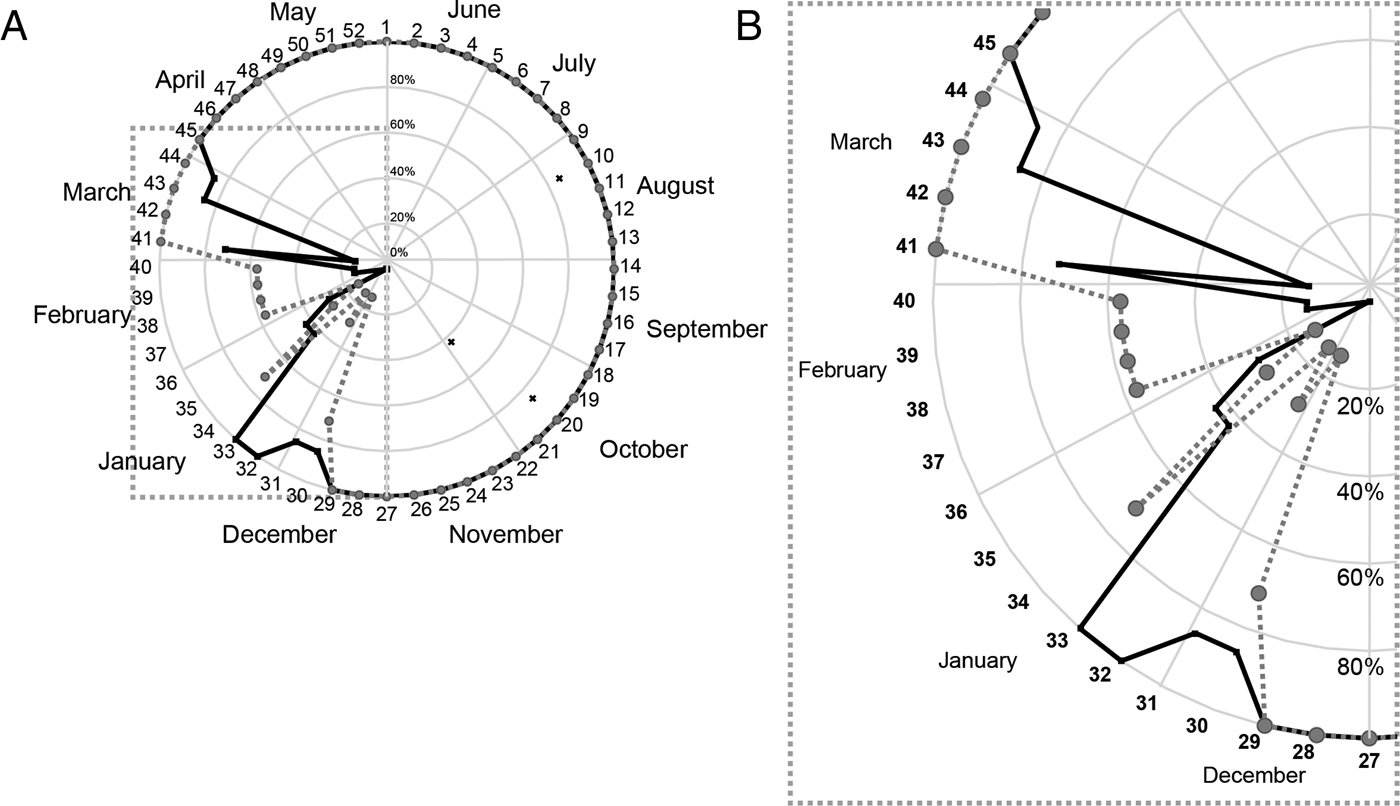
In Year 1 (outer circle in Figure 2), humpback whales were acoustically detected on 315 of the 360 days of recorded data (87.5%), and no whales were detected on 45 days (12.5%). Daily presence was continuous from 31 March to 22 December (261 of 360 recording days, 72.5%). However, from 23 December to 30 March, daily presence was variable (99 of 360 recording days, 27.5%). In Year 2 (inner circle in Figure 2) humpback whales were acoustically detected on 318 of the 365 days for which there were data (87.1%), and no whales were detected on 47 days (12.8%). Daily presence was constant from 4 March to 25 December (297 of 365 recording days, 81.4%), and variable from 26 December to the 3 March (68 of 365 recording days, 18.6%). Daily presence was based on the detection of song, song fragments, and/or non-song sequences (Figure 3A, B). In both years, song and song fragments were mostly detected in the autumn and early winter (September–January and from March–May). In contrast, non-song sequences were mostly detected in the spring and summer (May–September).
Daily presence data consisted of humpback whale song, fragments of song, and non-song vocalizations: (A) the outer circle is Year 1, daily presence again represented by black dots, the second circle were days with humpback whale song detections represented by black boxes, the third circle were days with humpback whale song fragments represented by hollow block boxes, and the fourth circle were days with non-song vocalization detections represented by black diamonds; (B) the outer circle is Year 2, daily presence again represented by grey dots, the second circle were days with humpback whale song detections represented by grey boxes, the third circle were days with humpback whale song fragments represented by hollow grey boxes, and the fourth circle were days with non-song vocalization detections represented by grey diamonds.
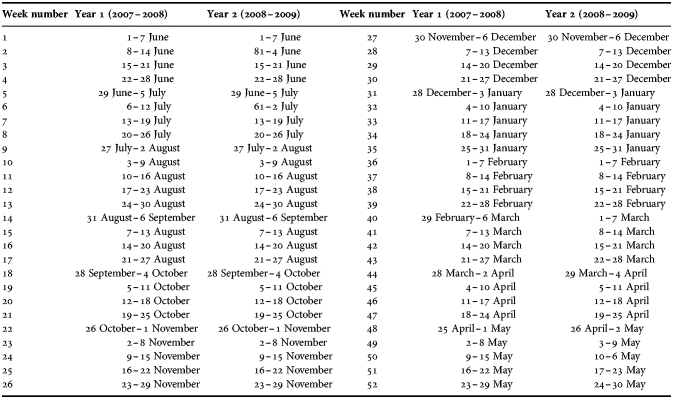
During Year 1, acoustically active humpback whales were detected in every day of every week (100%) until the last two weeks in December (Weeks 30–31), when they were detected in six days of the week (86%, Figure 4A, B; Table 2). Weekly-presence then increased to 100% for the first two weeks of January (Weeks 32–33) before falling to 43% for the last two weeks (Weeks 34–35). It continued to decrease to 29% for the first week of February (Week 36) and 0% for the next two weeks (Weeks 37–38). At the end of February and beginning of March (Weeks 39–40) weekly-presence increased to 14%. For the rest of March (Weeks 41–44) weekly-presence fluctuated drastically; it increased to 71%, decreased to 14%, and increased again to 86%. In Year 2, weekly-presence dropped below 100% at the end of December: 71% and 14% for Weeks 30 and 31, respectively. It fluctuated over the next five weeks (Weeks 32–36) from 29%, to 14%, up to 71%, down to 29%, and back to 14%. Weekly presence stabilized at 57% for the remaining weeks of February (Weeks 37–39) and the first week of March (Week 40).
The weekly presence of humpback whales during the two-year study period with black x's to indicate the percentage of days in the week with recordings (during 2007) if it was less than 100% (A) Year 1 weekly presence is represented by black dots connected with a solid line. Year 2 weekly presence is represented by grey dots connected by a dashed line; (B) during Year 1 (black), weekly-presence was 100% until mid-December; then weekly presence fluctuated over the next seven weeks while generally decreasing to 0% in mid-February, after which weekly presence again fluctuated over the next six weeks while generally increasing until reaching 100% in the second week of April. In Year 2 (grey) weekly-presence dropped from 100% to 14% during the last two weeks of December; then weekly presence fluctuated over the next five weeks before stabilizing at 57% for the remainder of February and returning to 100% by the second week of March.
The week numbers and corresponding dates of Year 1 and Year 2.
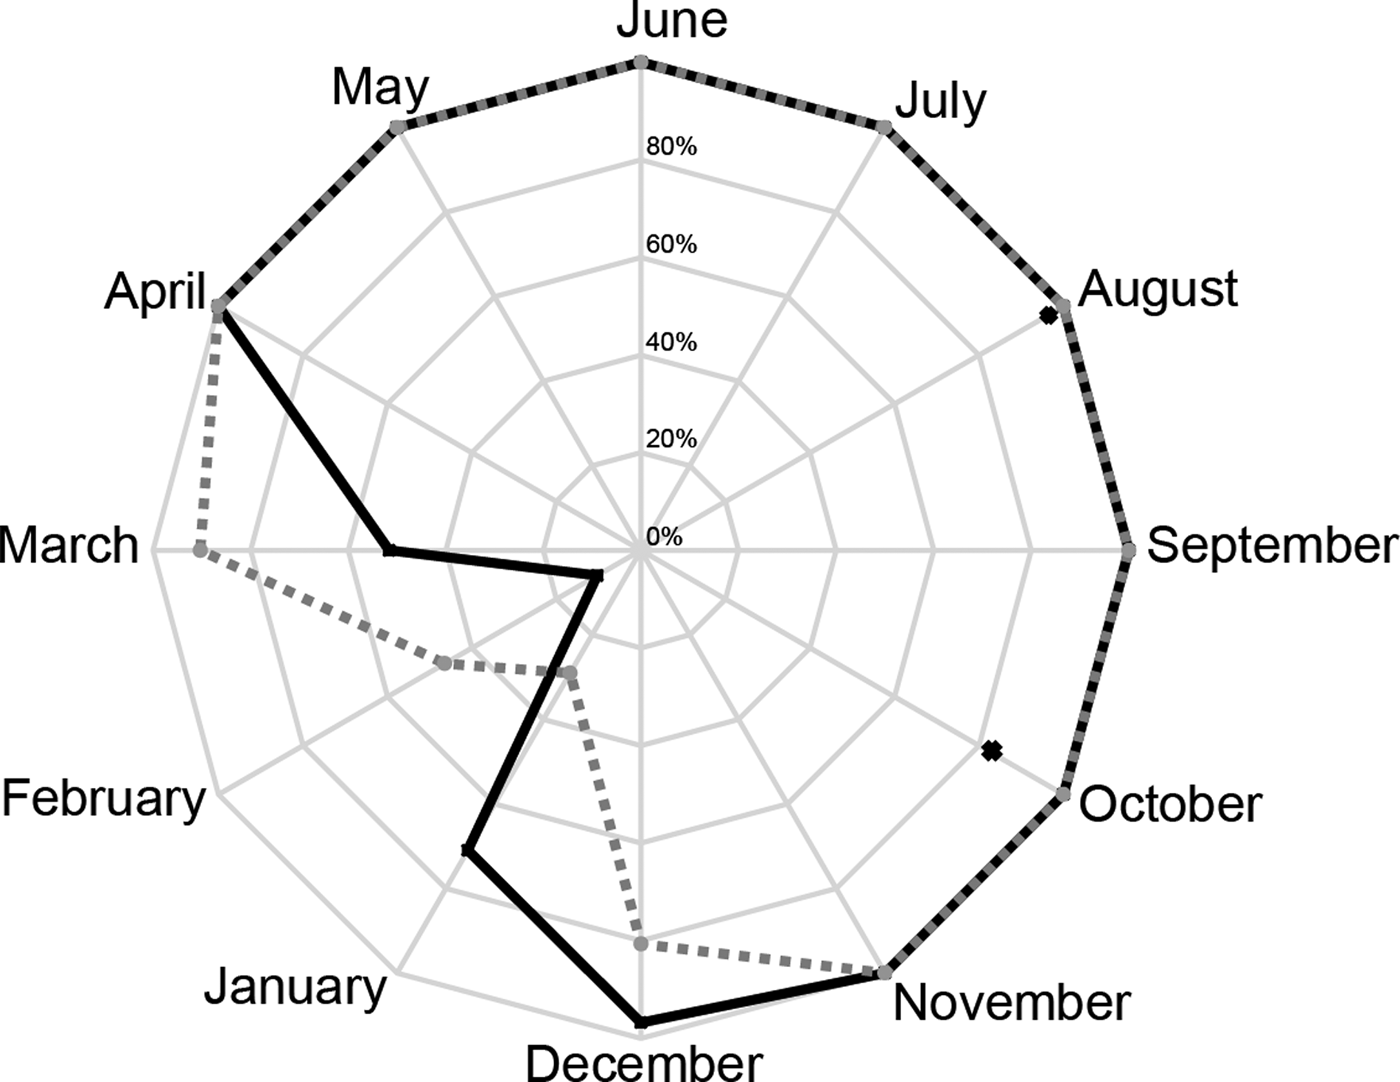
Monthly presence was 100% for April through to November (in both years) (Figure 5). In December of Year 1, monthly presence decreased to 97%, decreased in January to 71%, and was the lowest (10%) in February. Monthly presence increased to 52% in March and returned to 100% in April. In Year 2, monthly presence decreased to 81% in December, and was its lowest in January (29%). Monthly presence increased to 46% in February, 90% in March, and 100% in April.
Monthly-presence of humpback whales during the two-year study period with black x's to indicate the percentage of days in the month with recordings (during 2007) if it was less than 100%. Year 1 monthly presence is represented by black dots connected with a solid line, and grey dots connected by a dashed line represent Year 2 monthly, presence. Monthly-presence was 100% for April through to November (in both years). However, the minimum monthly presence in Year 1 was in February, whereas in Year 2 it was a month earlier in January.
Seasonal occurrence
When weekly presence and monthly presence for the entirety of both years were compared, there was no significant difference between the years (Weekly: Mann–Whitney U-test, U (1,0.05) = 0.2019, P = 0.6532; Monthly: Mann–Whitney U-test, U (1,0.05) = 0.000, P = 1.0000). Pooling the data from both years did reveal a significant difference in weekly presence (Kruskal–Wallis test, X 2(51,0.05) = 86.3580, P = 0.0015), and monthly presence (Kruskal–Wallis test, X 2(11,0.05) = 22.6309, P = 0.0199). From these analyses three types of time periods were defined: (1) maximum-presence period, when weekly presence and monthly presence are 100%; (2) variable-presence period, when weekly presence and monthly presence fluctuate between 99% and 40%; and (3) minimal-presence period, when weekly presence and monthly presence are less than 40%.
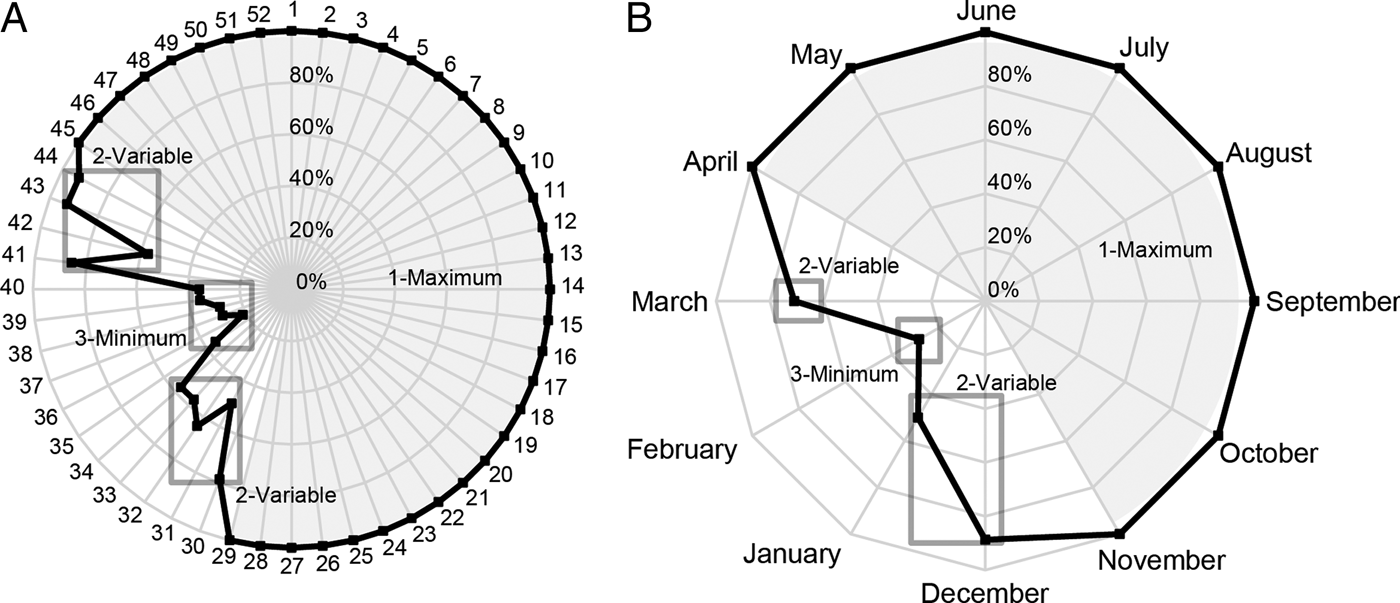
Maximum presence (shaded grey in Figure 6A, B) occurred during the April through to November time period (Weeks 1–29 and 45–52), when at least one acoustically active humpback whale was detected every day. Variable presence occurred during the December through to January period (Weeks 30–34; Figure 6) and in March (Weeks 41–44), when the average weekly presence was 70.6% (±32.73% SD) and the average monthly-presence was 69.9% (±25.54% SD). Minimal presence (Figure 6) occurred in February (Weeks 36–40). The average weekly presence for this time period was 30.89% (±22.63% SD) and the average monthly presence was 28.39% (±25.52% SD).
The average (A) weekly-presence and (B) monthly-presence over the two-year study period. Different periods of humpback whale presence were identified: (1) a period of maximum-presence during April–November (Weeks 1–29 and 45–52) when weekly and monthly-presence were 100% (shaded grey); a period of variable-presence, in December through to January (Weeks 30–34) with decreasing occurrence and in March (Weeks 41–44) with increasing occurrence, when weekly and monthly-presence fluctuated between 94% and 40%; and (3) a period of minimal presence in February (Weeks 36–40), when weekly and monthly-presence were less than 40%. These time periods had significantly different levels of humpback whale presence and represent a cyclical pattern between periods of maximum presence (in spring–autumn) and shorter periods of variable and minimum presence (in winter–early spring).
When analysed at a weekly scale each time period was significantly different from the others (Weekly: Kruskal–Wallis test, X 2(2,0.05) = 81.7986, P < 0.0001; maximum presence versus variable presence: Mann–Whitney U-test, U (1,0.016) = 55.7782, P < 0.0001; maximum presence versus minimal presence: Mann–Whitney U-test, U (1,0.016) = 84.4032, P < 0.0001; variable presence versus minimal presence: Mann–Whitney U-test, U (1,0.016) = 84.4032, P = 0.0021). At a monthly scale, the time period with maximum presence was significantly different than the two time periods with variable and minimal presence (Monthly: Kruskal–Wallis test, X 2(2,0.05) = 22.2807, P < 0.0001; maximum presence versus variable presence: Mann–Whitney U-test, U (1,0.016) = 20.3263, P < 0.0001; maximum presence versus minimal presence: Mann–Whitney U-test, U (1,0.016) = 16.9412, P < 0.0001; variable presence versus minimal presence: Mann–Whitney U-test, U (1,0.016) = 20.3263, P = 0.0956).
Yearly variation in winter presence
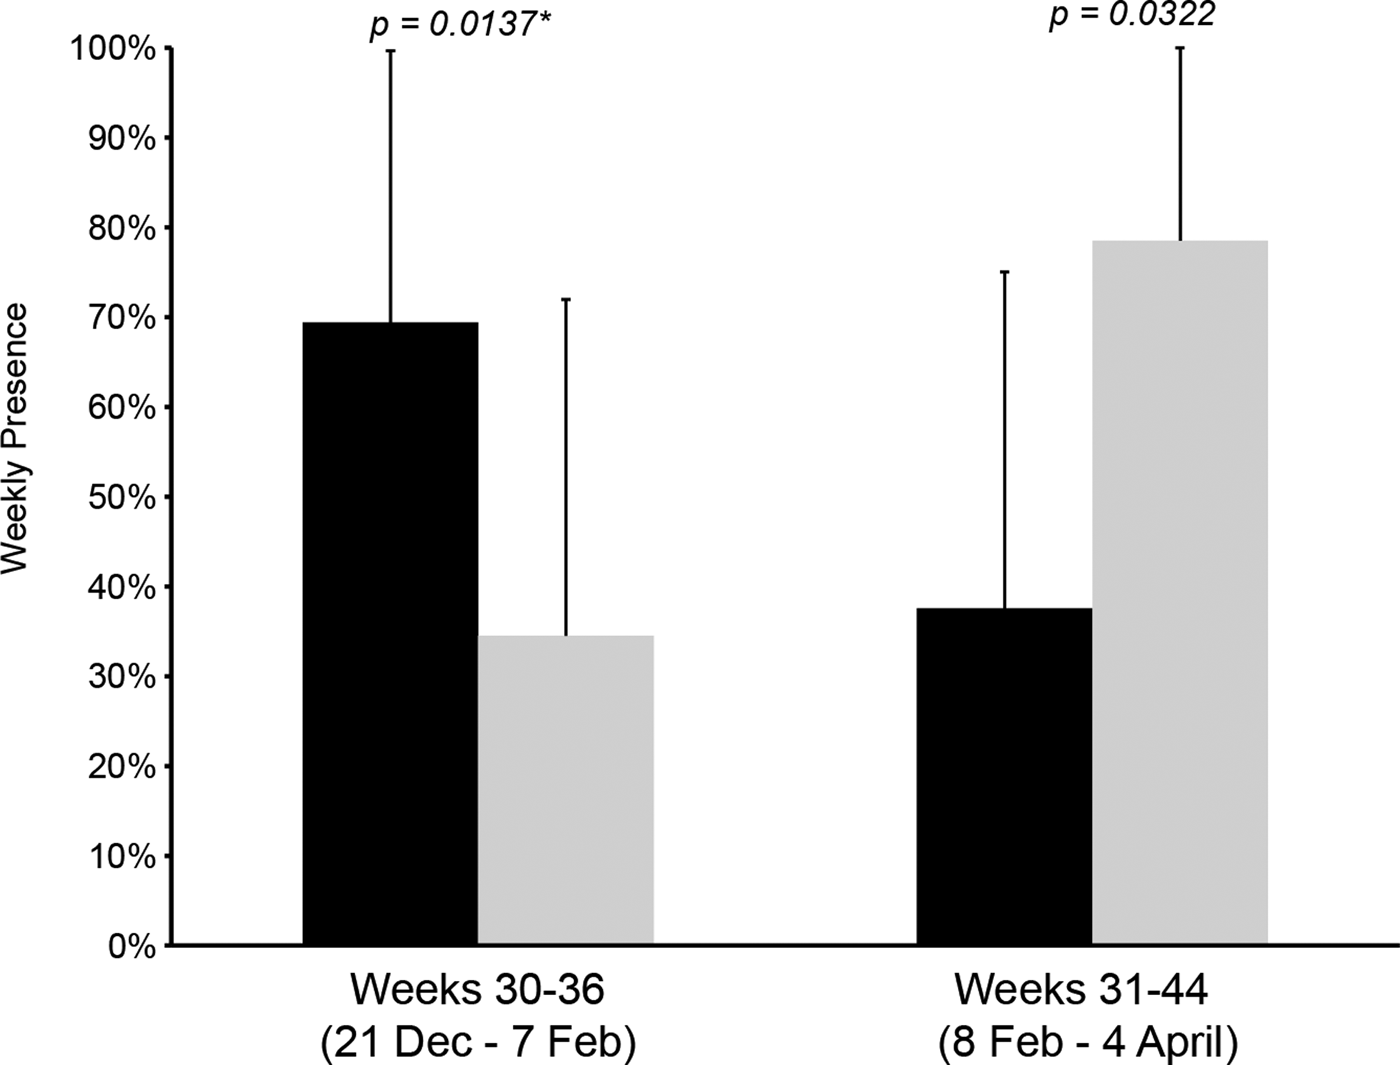
Comparing the two years strictly within the time periods when weekly presence was not maximum (i.e. variable presence and minimal presence; Weeks 30–44) did result in a significant difference between the two years (Kruskal–Wallis test, X 2(3, 0.05) = 11.0059, P = 0.0117; Figure 7). Week 36 had the lowest two-year average weekly presence (21.29%), and represented the minimum by which these time periods could be divided into two time segments: Weeks 30–36 (21 December–7 February) and Weeks 37–44 (8 February–3/4 April). During Weeks 30–36, the weekly presence for Year 1 was generally greater than Year 2, and Year 1 had a significantly higher average weekly presence (69.43% (±30.25% SD) than Year 2 (34.51% (±25.91%) (Mann–Whitney U-test, U (1,0.025) = 6.0817, P = 0.0137). During Weeks 37–44, the years switched: Year 2 had greater weekly presence than Year 1, and a higher average weekly presence (78.52% (±22.97% SD) than Year 1 (37.57% ±37.47% SD), although this difference was not statistically significant after applying a Bonferroni correction (Mann–Whitney U-test, U (1,0.025) = 4.5872, P = 0.0322).
Histogram showing the average weekly presence for Weeks 30–36 and for Weeks 31–44 from Year 1 (black) and Year 2 (grey). During Weeks 30–36, Year 1 had a significantly greater, average weekly presence than Year 2. Conversely, during Weeks 31–44, Year 2 had a greater average weekly presence than Year 1 (not statistically significant once a Bonferroni correction was applied).
DISCUSSION
Humpback whales were present in Massachusetts Bay for an extensive portion of a two-year period from 1 June 2007 through to 31 May 2009. Using the detections of song and non-song vocalizations as the measure of occurrence revealed that humpback whales were present for 87% of days of each study year, which is a greater proportion than previously detected using only song (49.5%: 158 days of presence out of 319 recording days for 2006 and 52.2%: 144 days of presence out of 276 recording days for 2008; Vu et al., Reference Vu, Risch, Clark, Gaylord, Hatch, Thompson, Wiley and Van Parijs2012). There was a limited portion of each year (13%) when humpbacks were vocally inactive, which we presume indicates an absence of humpback whales. However, if there were whales present, but either vocalizing and not detected, or not vocalizing, then the daily presence over the year would be greater than 87%.
Trends in the daily presence data indicate that song and song fragments accounted for a majority of the daily presence data during the autumn and early winter months, whereas non-song sequences accounted for a majority of the daily presence data during the spring and summer months. In terms of song, these trends correspond to the peaks in singing found by Vu et al. (Reference Vu, Risch, Clark, Gaylord, Hatch, Thompson, Wiley and Van Parijs2012). However, because of the data collection method used in this study, these trends cannot be statistically evaluated and are only suggestive. Further data collection and statistical analysis are necessary to confirm that these trends are significant.
At both temporal scales of analysis (weekly and monthly) humpback whale presence oscillated between a lengthy period of constant presence and relatively shorter periods of inconstant presence. However, the weekly analysis revealed significant seasonal variations in humpback whale presence during three distinct time periods: (1) maximum presence from spring to early winter; (2) variable presence in early winter and early spring; and (3) minimum presence in mid-winter. Thus, from the perspective of passive acoustic monitoring, monthly analysis reveals consistent versus variable presence of humpback whales, whereas analysis at a weekly scale reveals fluctuations in presence during transitions between maximum and minimum levels of presence.
The continuous presence of humpback whales over a span of nine months, from spring to early winter, expands our current understanding of the time frame over which humpback whales are utilizing this area as a feeding ground and potentially as an extension of the breeding ground (Clapham et al., Reference Clapham, Baraff, Carlson, Christian, Mattila, Mayo, Murphy and Pittman1993). The consistency in presence during this time period, as opposed to other times of the year, suggests that a higher level of vocal activity could be attributed to a proportionately greater number of animals (Clapham et al., Reference Clapham, Baraff, Carlson, Christian, Mattila, Mayo, Murphy and Pittman1993).
The variability in humpback whale presence during the early winter to early spring period corresponds to the migration of humpback whales out of and into Massachusetts Bay (Katona & Beard, Reference Katona and Beard1990). Fluctuations in humpback whale presence represented both a significant reduction, and then an increase, in presence, and therefore most likely corresponded to a majority of the whales leaving, and subsequently returning, to Massachusetts Bay during the annual migration. At the weekly time scale, the fluctuation in presence was consistent with the staggered nature of humpback whale migration; during migration humpback whales exhibit temporal segregation between different age, sex and reproductive classes (Dawbin, Reference Dawbin1966; Dawbin, Reference Dawbin1997; Robbins, Reference Robbins2007).
The minimum presence during winter presumably represents a limited number of whales that remained in Massachusetts Bay forgoing the annual migration; previous visual surveys detected small numbers of mostly juvenile humpback whales during the winter (Clapham et al., Reference Clapham, Baraff, Carlson, Christian, Mattila, Mayo, Murphy and Pittman1993; Robbins, Reference Robbins2007). On the other hand, this minimal presence may be due to individuals who have delayed the start of their migration south, rather than animals that are over-wintering. Finally, a small portion of the winter presence, 11 days (10 days in January 2008 and 1 day in January 2009) were the result of song or song fragments detected on SBNMS arrays, and therefore could be from singer(s) located outside of Massachusetts Bay.
Yearly differences in humpback whale presence during this time of year may be the result of fluctuations in migration timing between years. Minimum presence occurred one month earlier in the second year than the first year (e.g. January rather than February). This difference illustrates how the timing of the annual migration may shift between years, perhaps by as much as four to six weeks, and that more than two years of acoustic monitoring are necessary to fully characterize the yearly variation in migration timing. Alternatively, the yearly difference may be the result of humpback whales foraging in areas outside of Massachusetts Bay, and therefore out of our acoustic detection range.
This study illustrates that humpback whales are present and vocally active in Massachusetts Bay throughout the year. It is still unclear how many individuals remain in the area throughout the winter, why some individuals forgo the annual migration, and how those individuals are utilizing this particular habitat during winter. Additionally, the extent to which humpback whale breeding activities extend into the Massachusetts Bay feeding grounds continues to be a mystery. Thus, while Massachusetts Bay is an important feeding habitat for humpback whales during the spring through to autumn period, it also serves as a winter habitat for some proportion of the Gulf of Maine sub-population, and is potentially an extension of the breeding habitat.
ACKNOWLEDGEMENTS
We thank the dedicated and tireless team of the Bioacoustics Research Program analysts involved in the acoustic data collection effort that made this study feasible: K. Conklin, S. Dedrick, C. Diamond, B. Estabrook, J. Evans-Wilent, B. Howard, C. McCarthy, J. Morano, C. Muirhead, D. Nelson, C. Pelkie, M. Pitzrick, D. Ponirakis, A. Rahaman, B. Roberts, E. Rowland, D. Salisbury, J. Tielens, A. Warde, and K. Wurzell. As well, thank S. Van Parijs, D. Risch, and E. Vu for kindly sharing acoustic data from the Stellwagen Bank National Marine Sanctuary. We also thank F. Channell, D. Doxey, W. Krkoska, J. Michalec, E. Moore, C. Tessaglia-Hymes, C. Tremblay, J. Walluk for the MARU deployments, recoveries and refurbishments, and C. Tremblay for coordinating project logistics. Finally, we thank Dr Phillip Clapham and an anonymous referee for comments that greatly improved this manuscript.
FINANCIAL SUPPORT
Funding for this work was provided by Excelerate Energy LLC; Neptune LNG LLC, a subsidiary of GDF Suez Energy North America, Inc.; and a grant from the National Oceanographic Partnership Program (CWC, grant number N00014-07-1-1029).
Supplementary materials and methods
The Supplementary material referred to in this article can be found online at journals.cambridge.org/mbi.