I. INTRODUCTION
The bone structure is highly hierarchical and heterogeneous with nanoscale components, which can be considered as a nanocomposite of collagen fibril matrix reinforced by nanosized mineral platelets.Reference An and Draughn1, Reference Cowin2 In cortical bone, collagen fibrils are assembled into a lamellar structure. At the microscale, the osteon is a key microstructural unit in adult cortical bone of many species, which consists of concentric lamellae surrounding a central canal, or Haversian canal. The osteon undergoes continuous resorption and rebuilding known as bone remodeling, and the newly formed osteons are surrounded by osteon remnants called interstitial bone.Reference An and Draughn1 Each osteon is generally encased by a cement line (CL), which separates the osteon from the interstitial bone or other osteons.
Numerous studies have been devoted to characterizing and modeling bones at different length scales,Reference An and Draughn1, Reference Cowin2 and the investigation of bone at small scales would strike at the most fundamental aspects of bone behavior. In the last decade, nanoindentation has become a popular technique to characterize the mechanical properties of bone at small scales.Reference Cowin2–Reference Tai, Dao, Suresh, Palazoglu and Ortiz10 It was found that the interstitial bone is statistically stiffer, harder, and more calcified than the osteon.Reference Gourion-Arsiquaud, Burket, Havill, DiCarlo, Doty, Mendelsohn, Meulen and Boskey5, Reference Gupta, Stachewicz, Wagermaier, Roschger, Wagner and Fratzl6, Reference Rho, Zioupos, Currey and Pharr8 Although the osteon is more mineralized around the canal than its periphery, the trend of the mechanical properties within an osteon is still in controversy.Reference Gupta, Stachewicz, Wagermaier, Roschger, Wagner and Fratzl6, Reference Rho, Zioupos, Currey and Pharr8, Reference Fratzl11 For example, Rho et al. reported that the modulus E and hardness H significantly decrease from the canal to the CL,Reference Rho, Zioupos, Currey and Pharr8 whereas Gupta et al. observed that E changes sinusoidally within each lamella but with a roughly constant mean throughout an entire osteon.Reference Gupta, Stachewicz, Wagermaier, Roschger, Wagner and Fratzl6
Compared to the osteon and interstitial bone, the CL is much less studied because of its challengingly small dimension (<5 μm).Reference Skedros, Holmes, Vajda and Bloebaum12 The relative mineralization in the CL is still in controversy. For example, Burr et al. found that the CL is less mineralized than the surrounding bone,Reference Burr, Schaffler and Frederickson13 whereas Skedros et al. recently found that the CL is more mineralized.Reference Skedros, Holmes, Vajda and Bloebaum12
Toughness and fatigue resistance are critical for the biological function of bone, and they generally depend on the crack nucleation and propagation behavior.Reference Skedros, Holmes, Vajda and Bloebaum12–Reference Vashishth17 Toughening mechanisms have been proposed at different hierarchical levels in bone structure, and these mechanisms are generally based on dissipating deformation energy at different length scales. At the nanoscale, strain energy is largely dissipated through the viscoelastic-plastic deformation in the soft collagen matrix.Reference Ji and Gao18–Reference Ji and Gao20 At the submicron and micron scales, Peterlik et al. showed that the variation of the collagen fibril angles across the bone increases the energy dissipation by enlarging the plastic zone around the crack tip.Reference Peterlik, Roschger, Klaushofer and Fratzl21 Furthermore, microcrack formation in the plastic zone around the main crack would contribute to the energy dissipation,Reference Zioupos and Currey22 and the crack bridging with uncracked ligaments in the crack wake zone would reduce the driving force for crack propagation.Reference Nalla, Kinney and Ritchie23
At the microscale, it was observed that the fracture toughness and fatigue lifespan of cortical bone increases with the number of osteons.Reference Evans and Riolo24 The CL plays an essential role in the bone fracture mechanics for arresting or deflecting cracks,Reference Skedros, Holmes, Vajda and Bloebaum12–Reference Vashishth17 suggesting that the properties of CL are critical for the structural integrity of the cortical bone microstructure.Reference Mohsin, O’Brien and Lee14, Reference Lee25, Reference Taylor and Lee26 Although the underlying mechanism is still not well understood,Reference Mohsin, O’Brien and Lee14, Reference O’Brien, Taylor and Lee15, Reference Boyce, Fyhrie, Glotkowski, Radin and Schaffler27 a weak CL compared to the surrounding bone tissues has been speculated to explain the effect of CL in bone fracture mechanics.Reference Skedros, Holmes, Vajda and Bloebaum12–Reference Vashishth17 The CL’s ability to arrest cracks was found to depend on the crack length, as cracks over a critical length would penetrate the CL and even the entire osteonReference Mohsin, O’Brien and Lee14, Reference O’Brien, Taylor and Lee15 and lead to eventual failure of bone. A more compliant CL compared to the surrounding bone was implied (never mentioned though) in the experimental study of Gupta et al.Reference Gupta, Stachewicz, Wagermaier, Roschger, Wagner and Fratzl6 To our best knowledge, a weaker CL compared to the surrounding bone has never been experimentally verified.
In this study, to verify the speculation that the CL is a weak and more compliant interface, we characterized the mechanical properties of the CL and the surrounding region in ovine and bovine femurs using nanoindentation arrays. Such an investigation is believed to be the first systematic study of the mechanical properties of the CL. From the results of each nanoindentation array, modulus and hardness maps are developed and compared with optical micrographs and scanning force microscopy images. The characterization of mechanical properties of CL will provide the constitutive basis for bone modeling involving the CL, which will have an impact on advancing the bone micromechanics.
II. MATERIALS AND METHODS
A. Sample preparation
An 18-month-aged bovine and a 9-month-aged ovine femur were acquired from a local farmers market. Both samples were immediately soaked in phosphate buffer saline (PBS) solution and then wrapped using plastics and stored at −20 °C.Reference An and Draughn1 Then, the samples were cut at the mid-diaphysis using a LecoVC-50 diamond saw (Leco Inc., St. Joseph, MI) at a slow rate of 260 ft/min to prevent over-heating and severe deformation. Afterwards, the bone specimens were embedded in a Leco resin (part number 811-163)/hardener (part number 811-165) mixture (Leco Inc., St. Joseph, MI) with a 24 h curing time. To quickly remove the heat generated by the exothermic polymerization, a copper cylinder with a thin aluminum foil placed on top of it was put below the Leco plastic mounting cup so that the aluminum foil came in direct contact with the epoxy. The maximum temperature during the entire epoxy curing process was below 37 °C, which was measured by an alcohol thermometer embedded in the epoxy.Reference Tang, Ngan and Lu28 After mounting, the samples were ground successively with silicon carbide grits 240, 320, 400, and 600. The sample was polished afterwards with a 1 μm α-Al2O3 paste, then a 50 nm γ-Al2O3 paste, and then on a plain micro-cloth under tap water. Finally, the sample was ultrasound sonicated for 10 min in a PBS bath; the plain micro-cloth polishing and sonication steps were repeated until the lamellae were clearly visible, as described by Hoffler et al.Reference Hoffler, Guo, Zysset and Goldstein29, Reference Hoffler, Guo, Zysset and Goldstein30 Before any indentation, the bovine sample was air-dried in a desiccator for 10 days, while the ovine sample was indented immediately after polishing and sonication.
B. Nanoindentation testing
Nanoindentation was performed using an Agilent Nano Indenter G200 (Agilent Technologies, Inc., Santa Clara, CA) with continuous stiffness measurement (CSM) and NanoVision scanning options.Reference Li and Bhushan4 To test the CL with width of only several microns,Reference Skedros, Holmes, Vajda and Bloebaum12, Reference Skedros, Holmes, Vajda and Bloebaum31 we used a cube-corner tip rather than a Berkovich tip. The tip area function was calibrated using fused silica, and a constant E was achieved at a depth range of 50–1500 nm. For each specimen, a CL region was selected for indenting. Each CL region contains an osteon, interstitial bone, and the interfacial CL. In the bovine sample, osteons are generally surrounded by well-defined interstitial bone, whereas in the ovine sample, the interstitial bone is not well-defined probably because of the early age of slaughter.Reference Skedros, Hunt and Bloebaum32
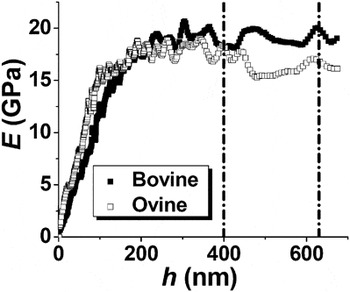
Before performing any indentation array, the nanoindenter was stabilized to achieve a thermal drift rate below 0.05 nm/s. For all array indentations, the indentation strain rate was 0.1 s−1. The CSM option in the Agilent G200 Nanoindenter allows the depth profiles of the mechanical properties to be tested. Two typical E depth profiles are shown in Fig. 1, indicating two regions: (i) region 1, in which E increases with increasing h; (ii) region 2, in which E reaches a plateau.
Two typical modulus depth profiles for bovine and ovine osteons, where the black lines indicate the range over which the properties were averaged.

Here, the existence of region 1 may be mainly due to the surface roughness and the bone heterogeneity effects. It is well known that the hardness will be underestimated if the indentation is not significantly larger than the surface roughness due to the contribution of the incompact surface to the indented volume.Reference Walter and Mitterer33 Using atomic force microscopy, the surface roughness of the ovine and bovine samples was found to be in the range of 10–20 nm, which is about 10% of the transition between regions 1 and 2. Another reason for the existence of region 1 may be the bone heterogeneity effect. Yao et al. identified a bone heterogeneity characteristic length scale of 200 nm, which is on the order of the diameter of individual collagen fibrils, and the mechanical heterogeneity of bone is pronounced below the length scale.Reference Yao, Dao, Carnelli, Tai and Ortiz34
Thus, to minimize the surface roughness and the bone heterogeneity effects, the indentation data in region 2 should be used to provide a better representation of the material properties. Based on numerous preliminary indentations, the transition between regions 1 and 2 varies between 100 and 400 nm. Therefore, 700 nm was chosen as the maximum of h, so that enough data in the plateau can be averaged to achieve statistical significance for each indentation. We calculated E and H by averaging over h = 400–630 nm, namely the common plateau region for all indentations.
The array indentation spacing should be carefully chosen to achieve a high spatial resolution while avoiding a significant interference between nearby array indentations. In some previous nanoindentation studies,Reference Gupta, Stachewicz, Wagermaier, Roschger, Wagner and Fratzl6 the array indentation spacing was so small that the nearby indentations overlapped each other. For example, in the study by Gupta et al.,Reference Gupta, Stachewicz, Wagermaier, Roschger, Wagner and Fratzl6 namely the only previous study that implies a more compliant CL, a Berkovich indenter was used with a 1-μm indentation spacing, and the indentation depth h should be at most 180 nm to prevent any direct indentation overlapping; however, h was between 124 and 251 nm. In our study, because the maximum cube-corner-indentation depth was 700 nm, the indentation spacing was chosen to be 2.25 μm, that is, about 2 times the effective indentation diameter.
The average modulus E and hardness H for each array indentation were then used to assemble property maps (contour plots) for a better visualization and comparison with the optical and topographical images.
III. RESULTS AND DISCUSSIONS
A. Comparison of optical micrograph, topography, and property maps
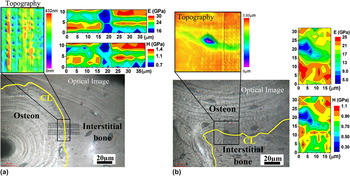
Figure 2(a) shows the optical image, topography, and property maps for a bovine CL region. The indents and CL are visible on the optical image and the property maps, indicating a significantly softer (lower H) and more compliant (lower E) region, ≈5–9 μm in width, around the CL compared to the surroundings.
The cement line (CL) regions depicted by topography, optical micrograph, hardness (H) map, and modulus (E) map. (a) The bovine sample. (b) The ovine sample. Here, the CLs are highlighted using yellow lines.

Figure 2(b) shows the results for an ovine CL region, also indicating a softer and more compliant region around the CL. Moreover, the topography in Fig. 2(b) indicates a 600–700 μm valley (below the osteon level) in the optical position of the CL. A lacunae in which an osteocyte (a type of bone cell) was located can also be observed close to the CL in the osteon, which is about 2.3 μm deeper than the osteon level, that is, much deeper than the valley bottom. The existence of a valley at the ovine CL is likely because of the preferential, chemical/mechanical attacking at the CL during mechanical polishing, as the CL is softer than the surrounding tissues. However, the topographical valley at the CL is much less pronounced for the bovine sample [see Fig. 2(a)], which is probably due to a shorter polishing time compared to the ovine sample. As discussed in the Appendix, the valley (surface curvature) does not significantly affect the measured H and E.
It should be pointed out that, although the softer and more compliant regions in Fig. 3 match the optical locations of the CLs, the regions are generally wider than 4.5 μm, which was argued to be the upper limit of the CL width.Reference Skedros, Holmes, Vajda and Bloebaum12, Reference Skedros, Holmes, Vajda and Bloebaum31 The possible reasons for an apparently wider CL are (i) a surface anomaly, such as the lacunae in Fig. 2(b), which is not the case for the bovine sample as no such anomaly can be seen in the optical image; (ii) indentation convolution, that is, some indentations individually cover both the CL and the neighboring bone, so that the measurements convolute both contributions; and (iii) the co-existence of a soft, compliant, and thin osteon lamella near the CL.Reference Gupta, Stachewicz, Wagermaier, Roschger, Wagner and Fratzl6, Reference Skedros, Holmes, Vajda and Bloebaum12 In fact, each osteon consists of concentric thick–thin lamellae pairs, and it was reported that thin lamellae lie in valleys and thick lamellae rest on peaks after polishing because of the thin lamellae being softer.Reference Gupta, Stachewicz, Wagermaier, Roschger, Wagner and Fratzl6 The indentation convolution and the coexistence of thin osteon lamella are the major reasons for an apparently wider CL in the E and H maps in Fig. 2.
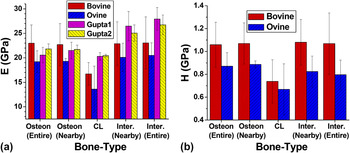
The average (a) modulus and (b) hardness of the CL, osteon, and interstitial (Inter.) bone for the bovine and ovine samples. The modulus results for two CL regions of a human femur are also plotted in (a), which are extracted from the study of Gupta et al.Reference Gupta, Stachewicz, Wagermaier, Roschger, Wagner and Fratzl6 Here, “nearby” refers to the 6.75-μm-wide region nearby the CL within the associated bone tissue, and “entire” refers to the entire indented region within the associated tissue.

In summary, Fig. 2 illustrates that the CL corresponds to a softer, more compliant, and continuous region that is not a result of local artifacts or property fluctuations. According to our best knowledge, this is the first comprehensive mechanical study on the CL, which distinguishes the CL from the osteon and interstitial bone. In the following, the measurements in the osteon, CL, and interstitial bone are averaged for a more quantitative comparison between different bone microstructures.
B. Comparison of the average properties for the different structures in the CL region
Figure 3 shows the average modulus and hardness of the CL, osteon, and interstitial bone. For comparison, Fig. 3(a) also plots the modulus results for the two CL regions of a human femur, which are extracted from the study of Gupta et al. (the hardness data were not available in the study).Reference Gupta, Stachewicz, Wagermaier, Roschger, Wagner and Fratzl6
It is difficult to determine the exact width of the CL, and according to the literature,Reference Skedros, Holmes, Vajda and Bloebaum12 the CL width is less than 5 μm. The spatial resolution of the property maps are limited by the array indentation distance, namely 2.25 μm. On the basis of the property maps, the CL properties are estimated by averaging the measurements in 2–3 rows (4.5–6.75 μm) of indentations around the CL, corresponding to a relatively large standard deviation due to the small sampling and the indentation convolution. Because the calculated CL properties in Fig. 3 may convolute the contributions from the surrounding bone tissues, they provide the upper bounds for the CL properties.
The osteon properties are averaged over the following two length scales, as the mean mechanical properties may vary within an osteonReference Gupta, Stachewicz, Wagermaier, Roschger, Wagner and Fratzl6, Reference Rho, Zioupos, Currey and Pharr8: (i) a 6.75-μm-wide region nearby the CL and (ii) the entire indented osteon region. The interstitial bone results are averaged in the same manner.
Figure 3 indicates that for the bovine sample the CL is about 30% (31%) softer and 27% (27%) more compliant than the nearby osteon (interstitial) bone. For the ovine sample, the CL region is about 23% (17%) softer and 29% (34%) more compliant than the nearby osteon (interstitial) bone after excluding the properties from the lacunae. Figure 3 also indicates that the difference between the results for the nearby and entire regions is not significant for both the osteon and the interstitial bone. The E and H results for the osteon and interstitial bone of the bovine sample match the results of Rho and Pharr.Reference Rho and Pharr35
Moreover, Fig. 3 indicates that H and E correlate well for the bovine sample, in the sense that the interstitial bone is harder and stiffer than the osteon, which is consistent with previous studies.Reference Gupta, Stachewicz, Wagermaier, Roschger, Wagner and Fratzl6, Reference Rho, Zioupos, Currey and Pharr8, Reference Rho and Pharr35 However, for the ovine sample, the interstitial bone is stiffer but slightly softer than the osteon. The fact that H and E do not correlate well for the ovine sample can be attributed to the earlier slaughter age of the lamb compared to the steer. For many species, the secondary osteonal structure is not well-established in cortical bone at an immature age,Reference Skedros, Hunt and Bloebaum32 implying the lack of well-established interstitial bone, namely the remnants of older osteons.Reference An and Draughn1
C. Biomechanics impact of the quantitative characterization of a weak/compliant CL
The hypothesis of a softer and more compliant CL for explaining the crack deflection and arrestment at the CLReference Burr, Schaffler and Frederickson13, Reference O’Brien, Taylor and Lee16 has been experimentally verified in this study.
A weak interface in synthetic and bio-composites has previously been suggested as a toughening mechanism through absorbing and dissipating fracture energy.Reference Smith, Schaffer, Viani, Thompson, Frederick, Kindt, Belcher, Stucky, Morse and Hansma36, Reference Clegg, Kendall, Alford, Button and Birchall37 For example, as a tough biocomposite, nacre consists of ceramic aragonite plates held together by thin compliant/weak organic layers,Reference Ji and Gao18 and the ≈20-nm-thick organic layer between mineral platelets was observed to behave as a barrier to crack propagation.Reference Wang, Suo, Evans, Yao and Aksay38 Based on a theoretical modeling,Reference Okumura and de Gennes39 the fracture energy and the strength of the nacre structure were enhanced compared to homogenous aragonite, and the large deformation in the compliant layers increases the overall displacement while mitigating the deformation in the stiff layers and minimizing the stress concentration. This structure in nacre, namely a thin weak layer between two adjacent harder layers, is analogs to that of the CL between the osteon and interstitial bone.
Although we have not observed any pre-existing or indentation-induced cracks, the crack arresting and deflection at the CL have been observed in numerous previous studies.Reference Skedros, Holmes, Vajda and Bloebaum12–Reference Vashishth17 Based on the foregoing discussions, we propose the following toughening mechanism of bone at the microscale. Basically, cracks originating in stiff interstitial bone will be directed towards the compliant osteon,Reference Burr, Schaffler and Frederickson13, Reference Guo, Liang and Goldstein40 and the CL, as a more compliant interface, further attracts the cracks. Then, the CL, as a softer/weaker interface, would deflect the cracks along its path due to CL debonding.Reference Burr, Schaffler and Frederickson13, Reference Guo, Liang and Goldstein40 Consequently, the bone structure is toughened because of more energy dissipation through a curvy crack-propagation path compared to a straight one in the interstitial bone.
Furthermore, to our best knowledge, this study provides for the first time the quantitative measurements of mechanical properties of the CL, making it possible to theoretically model bone micromechanics involving the CL.
IV. CONCLUSION
The CL between the osteon and interstitial bone has been speculated as a weak interface that toughens bone by arresting and deflecting cracks at the microscale. To verify this speculation, nanoindentation arrays are performed on bovine and ovine femur samples to characterize the mechanical properties of the CL. The distributions of modulus E and hardness H are obtained based on the nanoindentation tests. These distributions indicate that an ≈30% softer and ≈30% more compliant region correlates well with the optical location of the CL for both samples. The results presented here confirm that the CL is a weak interface in the bone microstructure of the two species. Moreover, the quantitative mechanical characterization of the CL, for the first time, provides the constitutive basis for theoretical modeling of bone micromechanics involving the CL.
APPENDIX: THE EFFECT OF THE TOPOGRAPHICAL VALLEY ON THE INDENTATION DATA ANALYSIS
It should be pointed out that the conventional Oliver–Pharr method assumes a flat sample, whereas the CL in the ovine sample lies in a valley. Thus, it is necessary to justify the results of the nanoindentations in the valley. Qualitatively speaking, compared to indenting a flat surface at the same h, indenting the valley bottom (positive curvature) requires the indenter to push more material, corresponding to a larger resistance, that is, an apparently higher H and E. This intuition is consistent with the experimental study of Saitoh et al.Reference Saitoh, Miyake and Matsunuma41 and the theoretical study of Li et al.Reference Li, Chen, Cheng and Cheng42 Thus, the lower H and E in the valley (CL) bottom are not artifacts in the indentation data analysis due to the curvature effect, and the “true” hardness and modulus in the valley (CL) bottom would be even slightly lower.
On the other hand, different from the valley bottom, the valley side is similar to a slope. According to the topography in Fig. 2(b), the maximum slope angle on the valley sides is about 16°, which is much less than the cube-corner centerline-to-face angle (35.3°) and the centerline-to-edge angle (54.7°). Moreover, according to the observation of Saber-Samandari and Gross,Reference Saber-Samandari and Gross43 the slope of the indented surface affects the indentation result only when the unloading curve (P–h) shows an elbow at the end of unloading—which was not shown in any of our indentations—indicating a negligible surface-slope effect. Furthermore, one indenter edge in our Agilent G200 system is pointing vertical-up as indicated in Fig. 2(a). According to the observation of Saber-Samandari and Gross,Reference Saber-Samandari and Gross43 if the surface-slope affects the indentation results, H and E would be underestimated when the indenter-face contacts the surface-slope [on the lower part of the valley as shown in Fig. 2(b)] and be overestimated when the indenter-edge contacts the surface-slope [on the upper part of the valley as shown in Fig. 2(b)]. However, as H and E in the valley do not show this asymmetry in H and E, the surface-slope does not significantly affect the indentation measurements.
In summary, the valley (surface curvature) around the CL in the ovine sample does not significantly affect the measured H and E. The further discussion on the effect of surface curvature on indentation results will be left for future research.