Introduction
On a daily basis, Emergency Medical Services (EMS) professionals are exposed to stressful and dangerous work environments, including, but not limited to, challenging environmental forces, violent patients, and heightened risk for illness and injury from a number of work hazards.Reference Bentley and Levine 1 - Reference Studnek and Fernandez 7 In 2002, occupational fatality rates of EMS professionals were more than twice the national average for US workers, and previous research indicates that the primary causes of EMS deaths were related to both motor vehicle and aeromedical accidents.Reference Maguire, Hunting, Guidotti and Smith 6 , Reference Suyama, Rittenberger, Patterson and Hostler 8 - Reference Pirrallo and Swor 10 With respect to nonfatal events, in 2002 the Department of Labor (Washington, DC USA) estimated that injury rates for EMS professionals were higher than any other industry.Reference Grange and Corbett 5 , Reference Ray and Kupas 11 In a recent survey, 30% of EMS providers reported occupational injuries within the past 12 months.Reference Studnek and Crawford 12 Furthermore, between 1999 and 2005, it was estimated that 8.1 injuries per 100 Emergency Medical Technician (EMT)-Basics and Paramedics that resulted in lost workdays occurred annually.Reference Heick, Young and Peek-Asa 13 Compared to both fire services and police, EMS professionals also reported higher rates of injuries. However, EMS rates for injuries treated in the emergency department were lower for EMS providers than for firefighters and police personnel.Reference Studnek and Fernandez 7 , Reference Studnek, Ferketich and Crawford 14
The prevalence of back injuries, hearing problems, and ambulance crashes have previously been noted in this cohort and can be attributed to the dynamics of EMS; which may include lifting and moving patients, the use of sirens, and frequent road travel.Reference Maguire, Hunting, Guidotti and Smith 6 , Reference Ray and Kupas 11 , Reference Reichard and Jackson 15 - Reference Fernandez, Crawford, Studnek and Wilkins 19 Specifically, it has been estimated that over one-half of currently practicing, nationally certified EMS professionals reported experiencing one or more days of pain in their back or legs in the past two weeks.Reference Ray and Kupas 11 A previous investigation found that individuals reporting hearing problems within the past year (15%) were 2.74 times more likely to report back problems than individuals who reported no hearing problems.Reference Schwartz, Benson and Jacobs 18 It was also estimated that 8.6% of EMS professionals were involved in an ambulance crash in the last year.Reference Maguire, Hunting, Guidotti and Smith 6 It is important to note that individuals can be injured during a collision or sudden stop due to equipment not being secured in an ambulance; 26% of EMS providers reported defibrillators were “rarely” or “never” secured during transport.Reference Fernandez, Crawford, Studnek and Wilkins 19
The overall health of an EMS professional may directly and indirectly affect the care provided to a patient. The requirements of 24-hour coverage and the physical demands of the profession may be causally related to the prevalence of sleep problems and fatigue. Research indicates that sleep quality and fatigue among EMS professionals are at unhealthy levels.Reference Proudfoot, Moore and Levine 20 , Reference Pirrallo, Loomis, Levine and Woodson 21 Alarmingly, levels of excessive daytime sleepiness were associated with negative impacts on performance; 76% reported difficulty operating an emergency vehicle in the last four weeks and 65% reported having difficulty remembering protocols in the past year due to tiredness.Reference Proudfoot, Moore and Levine 20
While the vast majority of EMS professionals report their overall health as excellent, very good, and good, individual key health indicators indicate a poorer health status.Reference Patterson, Suffoletto, Kupas, Weaver and Hostler 22 A study from 2010 found that 17% of EMS professionals were smokers, 45.4% were overweight, 25.8% were obese, and 75.3% did not meet physical activity recommendations.Reference Patterson, Suffoletto, Kupas, Weaver and Hostler 22
Lastly, training and preparedness to safely respond to and handle both violent patients and mass-casualty events are essential. Past research has indicated that 61% of EMS providers had been assaulted in the field and that one-quarter of those had sustained an injury from violence.Reference Boal, Hales and Ross 2 Equally concerning, in the two years following 9/11, the majority of EMS professionals received <one hour of training in chemical, biological, and explosive hazards.Reference Studnek, Bentley, Crawford and Fernandez 23 By 2008, over 91% of EMS providers reported receiving at least an hour of disaster preparedness training in the past year; however, 40% of providers had not participated in any multi-agency disaster drills in the preceding two years.Reference O’Keefe and Levine 24
Maintaining the health and safety of EMS professionals is of utmost importance to ensure a nationwide EMS system ready to meet the dynamic demands of prehospital patient care. Thus, the overall objective of this study was to summarize the national EMS system with respect to health and safety. Specific objectives were to assess health changes over time, to describe components negatively affected by sleep problems, to evaluate changes in health problems, risk behaviors, and ambulance safety, and to assess patient-initiated violence and preparedness of EMS professionals.
Methods and Data
Study Design
The design and data collection procedures for the Longitudinal EMT Attributes and Demographic Study (LEADS) study are described in detail elsewhere in this special edition. Briefly, data were obtained from a stratified sample of nationally certified EMS professionals via mailed questionnaires, on an annual basis, between 1999 and 2008. Stratification was based upon national certification level (EMT-Basic or EMT-Paramedic), self-reported race (white or other), and experience level (registered for < one year or registered for one year or more). Survey weights, based on each individual’s probability of selection and adjusted for within stratum response rates, were calculated and employed in these analyses. The American Institutes of Research Institutional Review Board (Washington, DC USA) approved this project.
Measures
Health and safety issues were addressed through analyses of LEADS survey items that measured (1) health and physical fitness, (2) health problems, (3) risk behaviors, (4) ambulance safety, (5) patient-initiated violence, and (6) preparedness to deal with mass casualty events. The LEADS health problem items included the Epworth Sleepiness Scale, a validated and widely used set of items to assess sleepiness.Reference Fernandez, Studnek, Margolis, Crawford, Bentley and Marcozzi 25 , Reference Johns 26 This scale consists of eight items that are scored on a scale of 0 (no chance of dozing) to 3 (high chance of dozing); summed scores >10 serve as an indicator of excessive daytime sleepiness.Reference Fernandez, Studnek, Margolis, Crawford, Bentley and Marcozzi 25 , Reference Johns 26
The LEADS risk behavior measures dealing with tobacco smoking, alcohol consumption, seat belt usage, and driving behaviors were based on items from the Behavioral Risk Factor Surveillance System (BRFSS). Lastly, in the 2008 LEADS survey, selected items from each year’s snapshot surveys were administered with the core survey, enabling comparisons of point estimates at two time points. Point estimates for core items that were administered each year were compared.
Data Analysis
Only those individuals who reported currently practicing in EMS were included in these analyses. The proportions of individuals responding to LEADS survey items with non-numeric categorical response options are presented with 95% confidence intervals (CIs) around each point estimate. For the self-assessed health status, self-assessed physical fitness items, and negative outcomes due to sleep items, categories with low response frequencies were combined. Variables with response categories that were numeric ranges were converted to continuous variables through use of midpoints.
Descriptive statistics including weighted percentages, averages for continuous variables, and 95% CIs were calculated using LEADS’ nonresponse adjusted survey weights. Significant differences within cross-sectional changes over time were assessed utilizing 95% CIs. If the CIs did not overlap, changes were considered statistically significant. Data were analyzed in SAS 9.3 (SAS Institute; Cary, North Carolina USA) utilizing PROC SURVEYFREQ and PROC SURVEYMEANS.
Results
Overall Health and Physical Fitness
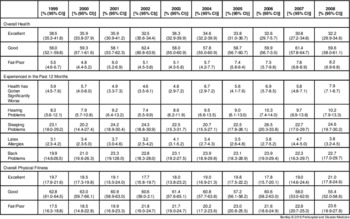
Although the majority of individuals reported their overall health status was “good” in each year, the proportion reporting “excellent” health declined significantly from 1999 (38.5%) to 2008 (32.2%). Similarly, the proportion reporting “fair/poor” overall health significantly increased from 5.5% in 1999 to 8.2% in 2008 (Table 1). Likewise, the most prevalent overall physical fitness level reported over all 10 years was “good,” but the proportion of respondents reporting “good” physical fitness declined significantly from 62.8% in 1999 to 55.4% in 2008. The proportion reporting “fair/poor” overall physical fitness levels increased significantly over this period, from 17.5% in 1999 to 23.6% in 2008 (Table 1).
Health Status, Physical Fitness, and Health Problems: 1999-2008

The majority of respondents reported regular participation in moderate and vigorous non-work-related activities (89.4% and 73.1%, respectively). On average, those individuals who participated in moderate physical activity did so 4.2 days a week, whereas those who participated in vigorous physical activity did so 3.2 days a week.
Health Problems
Respondents were asked if their health had gotten significantly worse or if they suffered hearing problems, sleeping problems, latex allergies, or back problems in the past 12 months. Sleeping and back problems were the most prevalent negative health outcomes reported. Over the 10 years of LEADS, the incidence of these problems did not change significantly: between 20% and 27% of EMS professionals reported sleeping problems in the previous year, 20% and 24% reported back problems, and 7% and 10% reported hearing problems. The least common of the negative health outcomes asked about in the survey was the development of latex allergies in the past year, with a maximum of 4.7% of participants reporting this difficulty in 2007. This was significantly higher than the proportion reporting latex allergies (3.1%) in 1999 (Table 1).
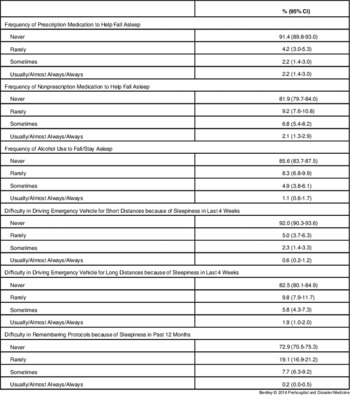
Sleep problems served as the focus for the LEADS 2005 snapshot survey. With respect to sleep problems, 8.6% of the EMS professionals reported using prescription medication and 18.1% reported utilizing nonprescription sleep medication to help fall asleep in the last four weeks. Furthermore, 14.4% of individuals reported using alcohol to fall or stay asleep in the last four weeks (Table 2). In terms of negative outcomes due to sleepiness, 8.0% of nationally certified EMS professionals reported difficulty in driving an emergency vehicle for short distances because of sleepiness in the last four weeks, and 17.5% reported difficulty in driving long distances because of sleepiness in the last four weeks. Over one-quarter (27.1%) of participants reported difficulty remembering protocols because of sleepiness in the past 12 months (Table 2).
Sleep Problems (2005 Snapshot)

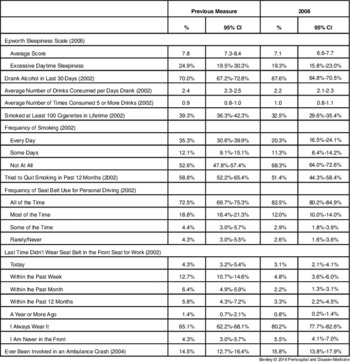
As previously noted, the Epworth Sleepiness Scale provides an indicator of daytime sleepiness. While not statistically significant, EMS professionals’ scores on this scale declined from 2005 (7.8) to 2008 (7.1). However, scores above 10 are an indicator of excessive daytime sleepiness.Reference Fernandez, Studnek, Margolis, Crawford, Bentley and Marcozzi 25 Using this criterion, the proportion of individuals with excessive daytime sleepiness declined slightly, but did not reach statistical significance over this period (24.9% vs. 19.3%) (Table 3).
Cross-sectional Comparison of Health Problems, Risk Behaviors, and Ambulance Safety

Risk Behaviors
The BRFSS items dealing with alcohol consumption were administered in 2002 and 2008; there were no significant changes over this time period. In 2002, 70.0% reported drinking alcohol in the last 30 days; in 2008, 67.6% reported similar drinking. However, of those consuming alcohol, the average number of drinks consumed per days drank decreased marginally from 2.4 in 2002 to 2.2 in 2008. The average number of times drinkers had five or more drinks in a day was 0.9 in 2002 and 1.0 in 2008 (Table 3).
The BRFSS items concerned with tobacco smoking were also administered in 2002 and 2008. The proportion of EMS professionals reporting having smoked at least 100 cigarettes in their lifetime declined significantly over this time period, from 39.3% to 32.5%. Similarly, the proportion of daily tobacco smokers significantly declined from over one-third (35.3%) to about one-fifth (20.3%). Of those 2002 smokers, 58.8% reported that they had tried to quit smoking in the past 12 months. This was not significantly different from the proportion of 2008 smokers reporting quitting efforts in the past 12 months (51.4%) (Table 3).
A statistically significant 15.1% increase in seat belt use when in the front seat, for work-related purposes, was noted when comparing responses from 2002 and 2008 (65.1% vs. 80.2%). Similarly, a statistically significant 10.0% increase in personal, non-work-related seat belt utilization was observed from 2002 to 2008 (72.5% vs. 82.5%) (Table 3).
Ambulance Safety
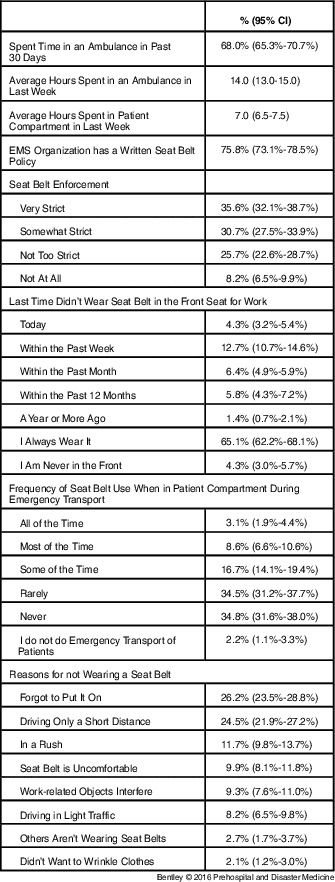
In 2004, over two-thirds (68.0%) of EMS professionals reported spending time in an ambulance within the past 30 days, averaging 14.0 hour in an ambulance during the preceding week. One-half of this time (7.0 hour) was spent in the patient compartment (Table 4). The proportion of providers who had ever been involved in an ambulance crash increased slightly from 2004 (14.5%) to 2008 (15.8%) (Table 3).
Driving Safety

Abbreviation: EMS, Emergency Medical Services.
In spite of the fact that over three-quarters (75.8%) of employed EMS professionals reported that their organization has a written seat belt policy, only about two-thirds (65.1%) reported always wearing their seat belt when in the front seat of the ambulance. Two-thirds (66.3%) reported enforcement of this policy was “very strict” or “somewhat strict.” However, almost no one (3.1%) reported always using seat belts when in the patient compartment, during emergency transport. The most common reasons for not wearing a seat belt were “I’m only driving a short distance” (24.5%) and “I forget to put it on” (26.2%) (Table 4).
Patient-initiated Violence
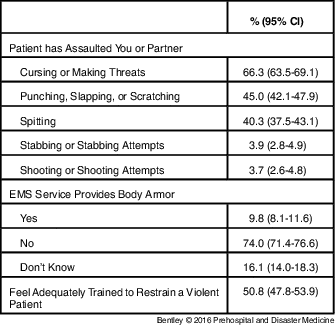
In 2000, the majority of EMS professionals reported that they and/or their partner had been assaulted by a patient. Of the types of assault asked about, being cursed at or threatened was most common, being reported by almost two-thirds (66.3%) of individuals. Nearly one-half (45.0%) reported having been punched, slapped, or scratched and 40.3% reported being spat upon. More serious acts of violence were rarer, with 3.9% being stabbed or involved in a stabbing attempt and 3.7% being shot or involved in a shooting attempt. However, even though the risk of assault was high, only 9.8% of EMS organizations provided body armor to their employees and just over one-half of the cohort felt adequately trained to restrain a violent patient (50.8%) (Table 5).
Patient-initiated Violence

Abbreviation: EMS, Emergency Medical Services.
Preparedness for Mass-Casualty Events
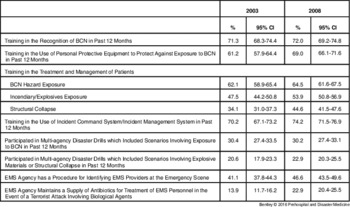
To assess the state of preparedness, individuals were asked to report their training related to biological, chemical, and nuclear (BCN) hazards and mass casualty, as well as their participation in multi-agency disaster drills in the 2003 Post 9/11 survey and again in 2008. Between 2003 and 2008, the proportion of EMS professionals receiving training in the previous year in the use of personal protective equipment (PPE) to protect against exposure to BCN increased significantly (61.2% vs. 69.0%). The proportion of individuals receiving training in the past year in the treatment and management of patients involved in a structural collapse also increased significantly (34.1% to 44.6%); proportions of EMS professionals receiving training in BCN hazard exposure and incendiary/explosives exposure also increased. In 2003, 47.5% received training in treating incendiary/explosive exposure patients and 62.1% received training in managing BCN patients. In 2008, comparable proportions increased to 53.9% and 64.5%, respectively (Table 6). However, there was a significant decrease in the amount of training time devoted to the recognition of BCN, use of PPE, and treatment and management of patients exposed to BCN with an average from 8.4 hour (CI=7.6-9.2) in 2003 to 6.2 hour (CI=5.7-6.7) in 2008. It was further noted that EMS agencies maintaining a supply of antibiotics for treatment of EMS personnel in the event of a terrorist attack involving a biological agent increased significantly from 13.9% in 2003 to 22.9% in 2008 (Table 6).
Preparedness Changes Over Time

Abbreviations: BCN, biological, chemical, and nuclear; EMS, Emergency Medical Services.
Discussion
Among nationally certified EMS professionals, self-reported “excellent” general health significantly declined from 1999 to 2008 with a concomitant statistical increase in “fair/poor” general health. This is discouraging as good health is one aspect of ensuring physical safety of the EMS professional when performing day-to-day work-related activities, especially given the demands of the EMS profession. Unfortunately, a small number of EMS professionals reported that their health had gotten significantly worse in the past year. The LEADS surveys do not enable us to determine whether the health of those individuals has gotten worse due to EMS or personal-related activities.
An important and potentially problematic issue brought to light by this analysis was sleep problems experienced by almost one-quarter of EMS professionals throughout all 10 years. Previous research has indicated that those experiencing sleep problems may be more prone to decision-making errors, and experience a higher rate of motor vehicular and machinery accidents.Reference Johns 27 The prevalence of excess daytime sleepiness found among this population was substantial affecting nearly one-fourth of providers in 2005 and about 20% in 2008. In addition, some EMS professionals are turning to prescription and nonprescription sleep aids, as well as alcohol, to aid in sleeping. Almost 20% of EMS professionals reported having difficulties in driving an emergency vehicle for long distances because of tiredness in the past month and over one-quarter reported having some level of difficulty remembering EMS protocols. Although the present study design does not lend itself to making inferences on the causes of sleep problems among EMS professionals, this study does indicate that future areas of research such as shift length need to be assessed to help ensure that the work environment of the EMS professional is a safe one.
In relation to self-reported overall health, the most commonly reported category of physical fitness was “good.” In order to understand self-reported physical fitness, EMS professionals were asked to report their non-work-related exercise habits. The Centers for Disease Control and Prevention (CDC; Atlanta, Georgia USA) recommends that adults should engage in moderate aerobic activity 150 minutes a week. 28 Additionally, they should engage in muscle strength building activities two days a week. While few EMS organizations offered an on-site fitness facility/health club membership to their employees, an overwhelming majority of individuals reported participating in either moderate or vigorous physical activity for more than three days a week. Coupled with self-reported health status, this suggests that EMS professionals understand the importance of physical fitness.
For the majority of EMS professionals, day-to-day work duties take place in the field, with an emergency vehicle being one’s “office.” Thus, it is concerning that just under one-quarter of LEADS respondents reported that their EMS agency does not have a seat belt policy particularly since EMS workers in organizations with such policies were more likely to report high levels of seat belt use. 29 While an ambulance crash may not be able to be prevented, the safety of the EMS professionals inside an ambulance should be top priority of every EMS agency. In this regard, EMS agencies could focus on educational interventions and tools aimed at increasing the use of seat belts in the ambulance. For example, the most commonly reported reason for an EMS professional not wearing a safety restraint device was simply forgetting to use one. Solutions could include placing a clearly visible reminder inside each compartment of the ambulance and ensuring that the seat belt warning is not disabled inside each vehicle.
Previous research has demonstrated that prehospital providers generally feel unprepared to deal with violence in the field.Reference Donnelly and Siebert 4 In the current study, one-half of nationally certified EMS professionals felt inadequately trained to restrain a violent patient. In this analysis, it became evident that EMS professionals face an array of risks each day on the job ranging from being cursed at and spat upon to being stabbed or shot. While it has become evident that workplace violence may be a reality for EMS professionals, an overwhelming majority of respondents reported never wearing body armor while performing their EMS duties. This again sheds light on important policies that need to be developed and implemented by EMS agencies to protect their employees.
Changes over time were noted for certain health risk behaviors. It was encouraging to note that more EMS professionals reported wearing their seat belt in the front seat when comparing data from 2002 to 2008. This may indicate that the culture of safety with respect to ambulance collision preparedness is increasing. Furthermore, while the prevalence of drinking did not decrease, smoking status decreased with data indicating more individuals reporting not smoking at all and fewer individuals reporting smoking every day. Over time, this may increase the general health status of EMS professionals, and decrease their risk for the development of chronic conditions.
A substantial increase in disaster preparedness was also noted over time. In 2003, items related to training were asked over a 2-year period, since 9/11, whereas items assessed in 2008 were given a time frame of one year. Thus, one would have expected reported preparedness to be higher in 2003 as it covered a 2-year span. When comparing data from 2003 to 2008, more individuals reported receiving training in the use of PPE to protect against exposure to BCN, and on the treatment and management of patients exposed to both incendiary/explosive and structural collapse situations. These data indicate that EMS stakeholders are training and preparing EMS professionals in light of current world threats.
However, while the prevalence of training in multi-agency disaster drills slightly decreased for scenarios involving BCN and increased for scenarios involving explosive materials or structural collapse, these results were not significant. It is assumed that most incidents involving any three of these scenarios will demand the utilization of outside resources; these data identify key areas of needed improvement.
Limitations
The LEADS study was the first, and remains the only, study of its kind to assess longitudinal work-life characteristics and key EMS topic areas on a national level. Because these data were obtained from a cohort of nationally certified EMS professionals, results from this study may not be generalizable to non-nationally certified EMS providers. However, 45 states in the United States currently utilize the National Registry for initial certification, and many individuals in non-registry states also obtain their national certification.
In spite of low response rates, the LEADS nonresponder surveys indicated that there were few differences between responders and nonresponders. As these data were obtained via a mailed questionnaire, self-report bias always remains a possibility. Finally, the use of CIs to detect statistically significant changes is a conservative approach, meaning that some statistically significant changes might not have been noted. This approach was employed due to the small proportion of individuals that responded to the LEADS surveys in more than one year. That is, samples were not 100% independent of each other across years. However, each year’s sample was a representative sample of nationally registered EMT-Basics and Paramedics.
Conclusions
This analysis described the overall health and physical fitness of EMS professionals as well as key characteristics associated with ambulance safety, potential health risks, and abuse in the prehospital emergency setting. This analysis also allowed for insight into changes over time for key health and safety and preparedness variables.