I. INTRODUCTION
White cast iron has long been widely used as a wear-resistant material in many industrial applications. Reference Moustafa, Moustafa and Nofal1–Reference Wiengmoon, Chairuangsri, Brown, Brydson, Edmonds and Pearce3 It is well documented that its abrasion–resistant properties are greatly affected by its cementite content. The mechanical properties, size, volume fraction, composition, morphology, etc. of white cast iron have an important effect on its performance in different industrial contexts. Reference Berns4–Reference Li, Burdett and Wang6 The cementite in white cast iron is usually referred to as Fe3C; however, single-phase Fe3C is thermodynamically unstable, and it does not occur completely in this form. Reference Umemoto, Todaka, Takahashi, Li, Tokumiya and Tsuchiya7 Hence, a small amount of Cr is added to ordinary white cast iron to stabilize Fe3C-type carbides to form (Fe, Cr)3C. Reference Andersson8–Reference Zhou, Xiao, Feng, Xing, Xie, Chen and Zhou11 Since it is a basic phase of white cast iron, an understanding of its mechanical properties and abrasive wear behavior is particularly important. Many studies of the mechanical properties of cementite reported in past decades have aimed at improving the performance of white cast iron for specific uses. Reference Koo, Chang, Hong, Kang, Jeong, Nam and Kim12–Reference Nikolussi, Shang, Gressmann, Leineweber, Mittemeijer, Wang and Liu16 Although it has often been reported that the cementite content plays an important role in abrasive wear resistance of white cast iron, there have been few investigations of the effect in single-phase cementite. The mechanical properties and abrasive behavior of single-phase cementite are far from being well understood, because the material cannot be produced in bulk by traditional metallurgical processes; thus the improvements reported in the literature are based on empirical observation, and the underlying mechanism remains uncertain.
In previous study, Umemoto et al. Reference Umemoto, Todaka, Takahashi, Li, Tokumiya and Tsuchiya7 successfully fabricated bulk single-phase cementite by mechanical alloying (MA) and spark plasma sintering (SPS) in sizes up to ϕ15 mm × 10 mm. Numerous alloying elements (e.g., Cr, Mn, Mo, V, Ti, etc.) have been investigated for their effect on the mechanical, physical, and abrasive properties of cementite. Reference Umemoto, Liu, Masuyama and Tsuchiya17–Reference Umemoto, Todaka, Takahashi, Li, Tokumiya and Tsuchiya19 To date, however, due to the lack of any previous systematic experimental study, no meaningful results have previously been obtained to explain the role played by single-phase cementite in the abrasive properties of Cr-alloyed white cast iron, or by the different physical properties of Cr-doped cementite. This paper describes the preparation of bulk quantities of single-phase cementite, and demonstrates the effect of varying the Cr content on its wear behavior. Finally, the findings of the present study on the abrasive properties and damage mechanisms of these cementites are discussed.
II. EXPERIMENTAL PROCEDURES
A. Preparation of bulk quantities of single-phase cementite
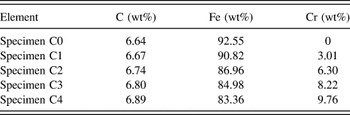
Single-phase bulk cementite specimens with Cr concentrations of 0, 3.01, 6.03, 8.22, and 9.76 wt% were prepared by MA and SPS from pure iron, graphite, and Cr powder (Fe: 99.0 mass% < 30–50 μm; C: 99.0 mass% < 10 μm; Cr: 99.9 mass% < 45 μm) mixed at the metal atomic ratio of 3:1 for Fe:C and Cr:C. The main chemical compositions of the specimens are listed in Table I.
Chemical compositions of mixture powders.

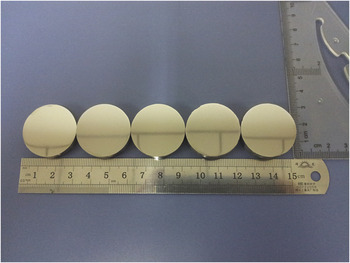
MA was carried out in a planetary ball mill (ball:powder 10:1 by weight) under vacuum for 100 h at room temperature. The milled powder was then compacted in a graphite die under vacuum at a fixed pressure of 30 MPa at 1173 K for 300 s to form cylinders measuring ϕ30 mm × 10 mm (Fig. 1). One end of each cylinder was then polished with 100-grade aluminum oxide paper. Test specimens ϕ5.9 mm × 10 mm were then cut by electric discharge machining. (The specimens acted as the “pins” in the pin-on-disk abrasion tests.)
Bulk sintering specimens with different Cr concentrations.

B. Two-body abrasion wear test
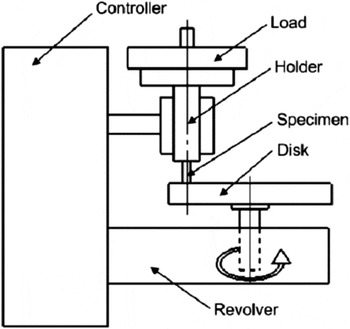
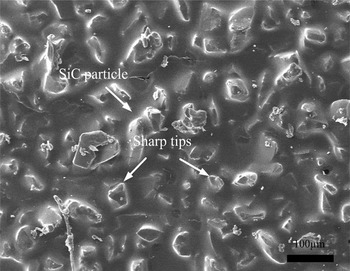
The abrasive wear-resisting performance of the cementite was tested using an ML-100 pin-on-disk abrasion testing device (Jinan Jing Cheng Ce Shi Co. Ltd., Zhejiang, China), which reportedly has data reproducibility within 3%. Reference Dawei, Jndong, Shengqiang, Zhifu, Yefei, Wei and Janjun20 Figure 2 shows a schematic illustration of the test arrangement. Each test specimen was gripped in a holder which moved through a spiral track (total track length of 5.96595 m) on the sandpaper surface of the disk. Testing was carried out in dry conditions at room temperature. The tests were performed with loads of 20, 35, and 50 N on the specimen (pressures 0.73, 1.28, and 1.83 MPa, respectively). The specimens were cleaned with an alcoholic solution before testing and weighed before the first experiment cycle and after each subsequent cycle to determine the mass lost due to abrasive wear. At least three test cycles were carried out for each load level, using a new surface of the sandpaper each time. The average mass loss was then calculated. A scanning electron microscopy (SEM) image of a carborundum (silicon carbide, SiC) sandpaper surface, assumed to be typical of the sandpaper used in the tests (see Fig. 3, which indicates the sharp-tipped grains that are a characteristic of the SiC). The grains, of approximately 2600 HV hardness, Reference Dawei, Jndong, Shengqiang, Zhifu, Yefei, Wei and Janjun20,Reference Qingde21 measured about 50–100 µm (Fig. 3).
Schematic diagram of abrasive wear testing machine.

SEM image of typical SiC grains on sandpaper used in experiments.

C. Abrasive wear specimens: Examination and analysis
The morphologies of the wear debris and worn surfaces were examined by SEM in combination with an energy-dispersive x-ray spectroscope (EDS). The specimens were examined by x-ray diffraction (XRD) and the degree of roughness of the worn surface was determined from 3D laser scanning microscopy images.
Microhardness tests were carried out with a HXD-1000TMC microindentation hardness tester (Jinan Precision Testing Equipment, Jinan, China) in accordance with ASTM E384-08. Reference Shengqiang, Jiandong, Guangzhu, Dawei, Zhifu, Jianjun and Yefei22 A load of 0.98 N was applied for 10 s to all the Cr-content cementite specimens. 30 indentations were made on each specimen to check the reproducibility of the data. The elastic modulus (E), hardness (H), and elastic recovery (H/E) were measured using a Berkovich diamond tip nanoindentation instrument (Hysitron, Minneapolis, Minnesota). The loading and unloading rate was 5 mN/s to a maximum indentation depth of 2000 nm. The drift rate was measured to be <0.020 nm/s. The Poisson's ratio of all samples was assumed to be 0.18.
III. RESULTS AND DISCUSSION
A. Effect of different Cr contents on cementite
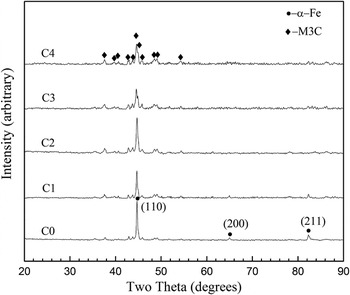
After SPS, the sintered products were examined by XRD. Figure 4 shows the diffraction peaks of cementite with added Cr for specimens C2, C3, and C4, indicating that these were single-phase cementite. However, the diffraction peaks of the alpha iron (α-Fe) phase were detected in addition to the cementite phase in the C0 and C1 samples, indicating that some α-Fe existed in the cementite with only small quantities of added Cr. This is further evidence that increased Cr affects the formation of single-phase cementite, and that it is more readily obtained by SPS when the Cr content is higher.
XRD patterns of sinter product with different Cr contents.

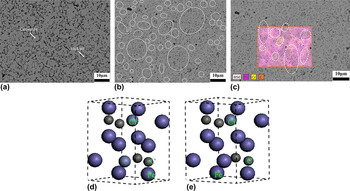
Figures 5(a) and 5(b) shows SEM photographs of specimens C0 and C4 etched with 4 vol% initial after polishing. The arrows in Fig. 5(a) indicate the large number of “islands” of cementite remaining on the surface of the specimen after initial treatment due to the difficulty of removing cementite by etching. The cementite islands accounted for approximately 81.6 vol% of the observed surface, determined as the average of 10 measurements with an optical microscope at 100x magnification using Leica software.
SEM images of microstructure of specimens (a) C0 and (b) C4; (c) EDS image of specimen C4; (d) crystal structure of Fe10Cr2C4; (e) crystal structure of Fe11CrC4.

In Fig. 5(b), the white dotted outlines indicate zones of different structures. The area covered by these zones increased as Cr content increased. In the EDS image in Fig. 5(c), the circled regions contain more Cr atoms and fewer Fe atoms than elsewhere. This is due to the fact that the space group of Fe3C is Pnma62, with each conventional cell having 16 atoms, made up of 12 iron and 4 carbon atoms. The Fe atoms are located at two Wyckoff sites, 8d and 4c. Carbon atoms occupy 4c positions. However, it has been reported that the maximum solubility of Cr in Fe3C is almost 20 wt%, and the corresponding atomic proportion is 16%; thus, a Cr atom can only replace, at the most, one in every six Fe atoms. The crystal structure of a part of an Fe3C-type compound transforms into (Fe, Cr)3C-type compounds. Hence, the reasons for the uneven distribution of Cr atoms in the bulk sample are (i) the 9.76 wt% Cr content of sample C4 (the highest content used in the experiments) was less than the 20 wt% needed for maximum solubility of Cr in Fe3C; and (ii) Cr atoms replaced Fe atoms at different positions in the crystal structure of Fe3C, which were thus transformed into different (Fe, Cr)3C structures—for example, Fe11CrC4, and Fe10Cr2C4, as illustrated in Figs. 5(d) and 5(e). Reference Zhou, Xiao, Feng, Xing, Xie, Chen and Zhou11
B. Relationship between wear resistance and micro-Vickers hardness
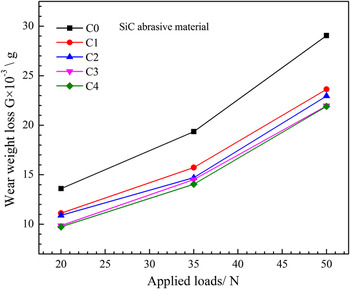
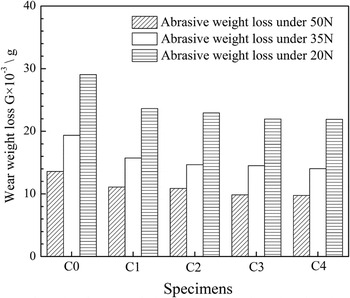
In Fig. 6, the relationship between cementite weight loss and applied load shows that weight loss increased as the testing load increased, with excellent wear resistance being observed at the lower applied loads. Also, specimens containing more Cr showed reduced wear weight loss and enhanced abrasion resistance.
Wear weight losses of cementite for different applied loads.

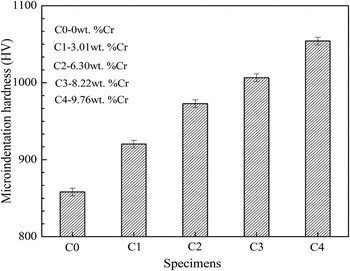
The micro-Vickers hardness for different Cr contents is shown in Fig. 7. The hardness of the bulk cementite increased, showing a marked difference with increasing Cr content at room temperature. According to Richardson's theory, Reference Richardson23 a large wear weight loss of the tested material is predicted when the hardness of the material (H m) is <0.6–0.8 times the hardness of the grinding material (H a). In the present study, H a = 2600 HV (grinding material SiC) and for the cementite, H m lies between 840.60 and 1070.74 HV (Fig. 7), giving H m/H a = 0.32–0.41. Since this is <0.6–0.8, the harder grinding material would be expected to indent the cementite surface and be the main cause of wear weight loss. Deeper indentation by the grinding medium particles was found to result in more weight loss in the cementite specimen.
Micro-Vickers hardness of cementite.

Figure 8 shows the wear weight loss for different levels of Cr content. The figure shows that, for specimens with the same Cr content, more wear weight loss occurred at higher loads. Conversely, less weight loss was observed in the material with a higher Cr content.
Weight loss of cementite versus Cr content.

C. Two-body abrasive wear behavior of cementite
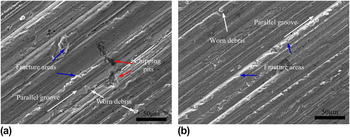
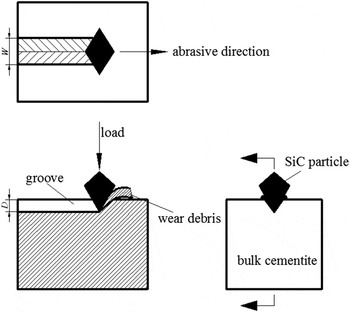
The wear surface was examined by SEM to identify the wear micromechanism and examine the type of wear debris produced. SEM images of the wear surface are shown in Fig. 9 for two specimens subjected to 50 N loading. The images show multiple parallel abrasion grooves, which indicate that the micromechanism of the wear was mainly by microcutting by the sharp tips of the SiC particles. A schematic of the abrasive wear process is shown in Fig. 10, in which the groove depth and width (D and W, respectively) depend on the load applied to the specimen and the hardness of the test material. For a given load, the groove depth and width are smaller for harder specimens.
SEM images of wear surfaces of cementite subjected to a 50 N load: (a) C0 and (b) specimen C4.

Schematic of microcutting by a single SiC particle.

Figure 9(a) shows that the worn surface of specimen C0 (no added Cr) with a 50 N load is characterized by continuous grooves, with no visible plastic deformation at the sides of the grooves. The C0 worn surface shows a considerable amount of broken material, with much of the fractured area occurring on the sides of the wear grooves [blue arrows in Fig. 9(a)], along with small quantities of comparatively large debris particles from spalling (red arrows). The low-Cr content cementite in the C0 material was readily scraped off the surface of this specimen because of its high hardness combined with low toughness. When an external force was applied to the wear surface, the stress concentration at the notch (base of the groove) caused cracking to be initiated in some areas. Several repetitions of this abrasive action would leave a deep pit in the contact area.
Figure 9(b) shows that the wear surface of specimen C4 suffered less damage than C0. Microplowing and spalling are evident, and no plastic deformation is seen on the sides of the wear grooves. The fractured areas of the wear surface specimen C4 are inconspicuous, unlike specimen C0. The increased hardness of the material may be the main reason. Improved fracture toughness and microhardness of cementite with added Cr is associated with the change in its crystal structure when more Cr atoms replace Fe atoms, as discussed above. Reference Zhou, Xiao, Feng, Xing, Xie, Chen and Zhou11
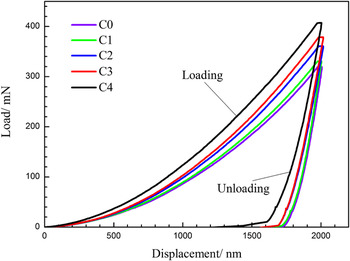
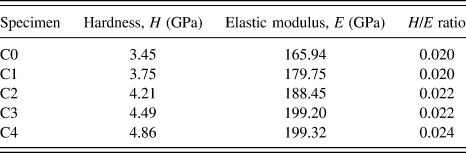
There is little in the literature regarding the mechanical behavior of cementite, mainly due to the problems associated with its measurement. Reference Casellas, Caro, Molas, Prado and Valls24 In the present work a nanoindentation method was used to evaluate those micromechanical properties of different Cr-cementite blends that exhibit complex behavior. The typical load–displacement curves obtained for the specimens using the nanoindentation apparatus are shown in Fig. 11. The parameters obtained from the curves using the Oliver–Pharr nonlinear curve-fit method Reference Oliver and Pharr25 are listed in Table II in which H is hardness, E is the elastic modulus, and H/E is a measure of the elastic recovery of cementite. Table II shows that the experimental values of H, E, and H/E increased with greater Cr content, and indicates that the mechanical performance of specimens was greatly affected. Note that the hardness values obtained by this method are clearly higher than micro-Vickers hardness values. This phenomenon is generally referred to as the indentation size effect. Reference Vočadlo, Brodholt, Dobson, Knight, Marshall, Price and Wood26,Reference Manika and Maniks27 The results for the five specimens are consistent with a previous report Reference Van Steenberge, Sort, Concustell, Das, Scudino, Surinach and BaróDynamic28 that proposes a value for the elastic modulus of cementite between 170 and 200 GPa. The H/E ratio Reference Mukhopadhyay, Belger, Paufler and Kim29 of cementite is >0.02 (Table II) for all five specimens; however, cementite with added Cr exhibited a greater H/E ratio, which may indicate that the added Cr was an important factor in the elastic recovery property. The H and H/E magnitudes for all specimens were in the order C4 > C3 > C2 > C1 > C0. The mechanical properties of (Fe, Cr)3C are better (in the context of the present study) than those of Fe3C. This may be correlated with the presence of fewer fracture chipping pits and parallel grooves in the abraded specimen C4 than in specimen C0.
Load–displacement curves for cementite with different Cr content.

Hardness (H), elastic modulus (E) and elastic response H/E of cementite specimens.

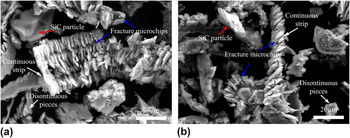
The wear debris also has a significant effect on abrasive wear. The type of debris produced was correlated with different wear micromechanisms. Figure 12 shows SEMs of the wear debris taken from the sandpaper after abrasion testing of specimens C0 and C4 under 50 N applied loading. The debris resembles complex polygons with a surface morphology comprising continuous strips and discontinuous small particles. The two-body wear action mainly consists of microcutting and microplowing. Microcutting produces debris that is continuously peeled off from the wear surface; discontinuous wear debris is formed by the abrasives on the sandpaper plowing the surface of the material being tested. Figure 12 shows that the debris is of a smaller size for the higher Cr content cementite, from wide strips in Fig. 12(a) (specimen C0) to narrow strips in Fig. 12(b) (specimen C4). For the same applied load, penetration by the abrasive particles produced larger debris particles from the low-hardness material in specimen C0 than from the higher-hardness cementite in specimen C4. Wear weight loss was therefore less in specimen C4, coincident with a significant increase in wear resistance. The blue arrows in Fig. 12 indicate fracture microchips in both the C0 and C4 debris resulting from the large number of cracks initiated in the brittle cementite during the wear process, which led to the production of fracture debris as the cracks propagated through the material. The red arrows in the figure indicate small particles from the SiC abrasive on the sandpaper, confirmed as SiC by EDS microchemical analysis.
SEM images of wear debris for cementite subjected to a 50 N load: (a) specimen C0 and (b) specimen C4.

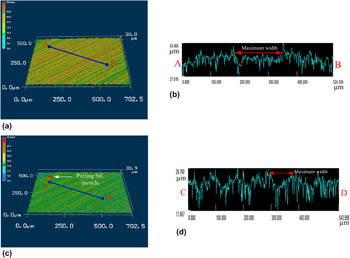
The surface topography of the abraded specimens was examined by 3D laser scanning microscope to investigate the influence of Cr content on the roughness of the worn cementite surfaces. Figures 13(a) and 13(c) shows several differences in the surface roughness of specimens C0 and C4. A significant trend in the influence of added Cr on the nature of the worn cementite surface was observed. The surface roughness profiles in Figs. 13(b) and 13(d) fluctuated with increased Cr content. Figures 13(b) and 13(d) show 2D roughness profiles of the worn surface of specimens C0 and C4 for the lines A–B in Fig. 13(a) and C–D in Fig. 13(c). These show that the widest abraded groove was 135.23 μm in C0 and 85.21 μm in C4, a difference of 50.02 μm. The highest peak in either profile was 16.46 μm, and the deepest trough was 11.09 μm.
2D and 3D profile images of worn of cementite surfaces (50 N loading, 500x magnification) (a) worn surface of specimen C0; (b) roughness curve of line A–B; (c) worn surface of specimen C4; (d) roughness curve of line C–D.

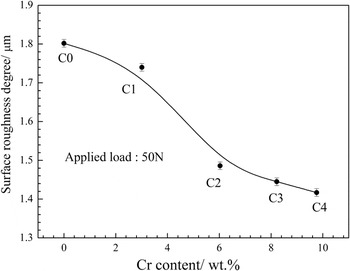
Figure 14 shows that increased Cr content is evidently related to a decline in the degree of surface roughness, with the greatest difference between C0 and C4 being approximately 0.385 μm. Each point on the graph represents the range of values from five measurements on each surface; the degree of roughness of the worn surfaces may therefore be ordered in the sequence C0 > C1 > C2 > C3 > C4. This is attributed to the fact that the cementite was more likely to be sheared through, with resulting debris, when the Cr content was low but, with increasing Cr content, the wear debris consisted mainly of microsize particles scoured off the worn surface and thereby reducing the degree of surface roughness, as discussed in some detail above. The phenomenon is also shown in Fig. 9.
Surface roughness of samples with different Cr contents.

In summary, the cementite with a greater Cr content generally had a greater hardness and, on the worn surface, a shallower groove depth, a smaller degree of roughness, and a smaller wear weight loss. Overall, the bulk cementite with higher Cr content possessed improved wear-resistance properties.
IV. CONCLUSIONS
Bulk cementite materials with different Cr contents were prepared by MA and SPS and aspects of their wear resistance were investigated using a two-body abrasive wear technique. The following conclusions were drawn from this work.
-
(1) When Cr content >6.03 wt%, bulk single-phase cementite was produced by MA and SPS.
-
(2) The increased Cr concentration led to increased hardness, thus improving wear resistance.
-
(3) The H, E, and H/E of the single-phase bulk cementite showed a significant increase with increasing Cr concentrations; wear weight loss and degree of roughness decreased.
-
(4) Parallel grooves and chipping pits, formed by microcutting and microplowing, were observed on the worn surface of the low-Cr cementite. With increased Cr content, the chipping pits were no longer present, and the maximum depth of the worn grooves decreased from 16.46 to.
-
(5) Smaller particles of wear debris were observed in cementite with a higher Cr content. The shape of the particles changed from a wide belt to narrow strips, and brittle microfractures were observed.
ACKNOWLEDGMENTS
The authors are grateful for the financial support of the Natural Science Foundation of China (Grant Nos. 51271142 and 51371138).