Introduction
The opening up of the Chinese economy in the late 1970s, together with major internal reforms initiated by Deng Xiaoping, culminated in remarkable levels of economic growth that led China, in just a few decades, to position itself, alongside the US and the EU, as one of the three largest economic blocs in the world. Despite this apparent success, China’s current economic power was achieved by an authoritarian regime, which poses several challenges to democracies across the world. On the one hand, the country has the world’s largest population and a vibrant economy, which constitute a great opportunity for Western consumers, investors and enterprises. On the other hand, it is not entirely clear to what extent it is possible to safeguard liberal values when doing business with a growing superpower governed by an authoritarian regime.
As such, more than 70 years after the ‘Iron Curtain’ speech delivered by Winston Churchill at the Westminster College in 1946 (Churchill Reference Churchill and Muller1999), the world once again faces a challenging future. If at that time, the Soviet Union was the West’s top concern, now it is China that poses the greatest challenge. In fact, China threatens the deep principles that sustain the liberal order itself, using its increasing power to legitimate and sometimes impose its illiberal ideas. This time, and contrary to what happened in the Cold War, the economies of rival blocs are deeply interconnected. In this connection, the concept of sharp power is useful to understand how China’s growing economic influence may undermine Europe’s liberal democracies. Indeed, as China expands its economic and business interests around the world, Walker and Ludwig (Reference Walker and Ludwig2017: 9) highlight that the Chinese Communist Party (CCP) has been active to supress ‘to the extent possible’ any critical voices, using manipulative techniques ‘applied to targets in the media, academia, and the policy community’, seeking ‘to permeate institutions in democratic states that might draw attention or raise obstacles to CCP interests, creating disincentives for any such resistance’. Australia was perhaps the first country to feel the full weight of China’s resentment. After it called for an independent inquiry into the origins of the Covid-19 outbreak, the country faced an unprecedented wave of trade restrictions imposed by China (Wilson Reference Wilson2021). Another example is the case of Lithuania, which also faces significant trade disruptions and a strong diplomatic pressure from China after Taiwan has opened a de facto embassy in the country (Gotev Reference Gotev2021). Moreover, during the pandemic, besides spreading disinformation about the origins of the virus, the Chinese diplomats also ‘weaponized the production of personal protective equipment (PPE) by threatening to cut off supplies to countries that criticized China’ (Economy Reference Economy2021). All these behaviours are a clear reflection of the so-called Chinese ‘wolf-warrior’ diplomacy led by Xi Jinping, which is breaking up with Deng’s tradition of keeping a low profile in foreign affairs.
In addition, Haciyakupoglu (Reference Haciyakupoglu2021) highlights that China is exporting its ‘technologically-advanced authoritarianism, as a model that other countries, particularly authoritarian-leaning ones, could imitate’. In this respect, China’s global export of its censorship and surveillance technologies, including the prospects of also exporting the social-credit system that these technologies may allow to implement, is a clear representation of this behaviour (Qiang Reference Qiang2019: 62). Indeed, Ecuador is a paradigmatic case of a country that is building an ‘all-seeing’ state totally ‘made in China’ (Rollet Reference Rollet2018). Hoffman (Reference Hoffman2021: III) also emphasizes the export of ‘smart cities’ technologies, which may reveal ‘the character of tech-enhanced sharp power and authoritarianism’. Smart cities allow one to leverage digital technologies to improve urban services’ quality, but they can obscure their ‘invasiveness and advancement of political control’ (Hoffman Reference Hoffman2021: 2). In that regard, Hoffman (Reference Hoffman2021: 3) refers to the Chinese support to the development of smart cities projects in Africa, in countries such as Egypt, Uganda and Nigeria. Within this framework, when making a parallel between ‘soft’ and ‘sharp’ power, Walker and Ludwig (Reference Walker and Ludwig2017: 13) highlight that contrary to the ‘soft’ version of power, in which non-military forms of influence are benign and attractive, the actions taken today by some authoritarian countries ‘capture the malign and aggressive nature of the authoritarian projects’, being better described as ‘sharp’ in the sense that they ‘pierce, penetrate, or perforate the information environments in the targeted countries’.
The concept of sharp power is thus useful to guide our discussion on the mechanics by which China exerts its power abroad. Notwithstanding, it is also necessary to take into consideration some of its limitations. First, the distinction between ‘sharp’ and ‘soft’ is not always clear. Indeed, what the designers of this concept describe as piercing, penetrating, and perforating ‘the information environments in the targeted countries’ is certainly not an exclusive action of authoritarian regimes. In that regard, while using this concept, we may avoid the risk of automatically allocating the ‘non-military forms of influence’ as necessarily ‘malign’ when they come from authoritarian regimes and necessarily ‘benign’ when coming from democracies. Furthermore, as argued by Lascurettes (Reference Lascurettes2020), great powers tend to export their domestic values and institutions as a way of protecting their own domestic regimes. In some way, the liberal international order was also designed (and exported) precisely to protect democracy. In that respect, the growing influence of China abroad is not necessary intended to impose an alternative regime, but essentially to protect its own domestic regime. Yet, to what extent democracies and a growing superpower such as China can peacefully coexist in an international system that does not go against liberal values, remains unclear. When assessing EU–China relations, we are precisely assessing this complex environment in which finding a balance between the protection of democratic values and safeguarding of economic interests is a very challenging task.
Against this background, this article assesses the risks of doing business with China in a context where EU’s unity must be preserved. In order to do so, we explore whether Chinese interests in Europe can be perceived as legitimate, mainly motivated by fair economic gains, or whether they also include a projection of sharp power that undermines European democratic institutions. Certainly, Chinese interests in Europe incorporate both features, making the detection of sharp power a difficult task and, simultaneously, the objective of having a fair and efficient policy to counteract this behaviour also challenging. Actually, as stated by Walker (Reference Walker2018: 20), the ‘challenge of sharp power is multifaceted’, requiring a ‘coherent and durable strategy’ in order to find countermeasures that do not make things worse, as democracies must remain open and ‘cannot sacrifice their own standards and values in order to safeguard against the authoritarians’ censorship schemes’. In fact, a too tough stance on China may end-up blocking well intentioned businesses that are needed for European economic prosperity, whereas turning a blind eye to the potential harmful effects of China’s foreign influence could also have risky effects on maintaining a united and democratic Europe.
From this perspective, this article focuses on what Walker (Reference Walker2018: 21) portrays as the need ‘to detect and highlight the intrusions of sharp power’ to ‘understand how it operates’, helping in this way ‘democracy counteract its distorting effects’. On this basis, the main goal of this article is to understand the mechanics through which the EU’s relations with China may harm its values and institutions, providing specific examples that precisely illustrate CCP’s malign influence in Europe. This article also intends to reflect on the extent to which the two distinct political and economic models are compatible with the preservation of a liberal international order. As such, we aim to assess whether the EU has the capacity to counteract China’s sharp power, highlighting concrete policy actions that help strengthen the EU’s position, while also identifying persisting shortcomings. Accordingly, we conclude that recent reforms, such as the investment screening mechanism and the global sanctions regime, were an important step towards the affirmation of an EU committed to its values. Indeed, such reforms give the EU more capacity to push China into respecting global defined rules and arrangements. However, the requirement for unanimity in the Common Foreign and Security Policy (CFSP) will likely continue to prevent the EU from taking coherent and swift actions on global affairs.
The Threat of Sharp Power in EU–China Economic Relations
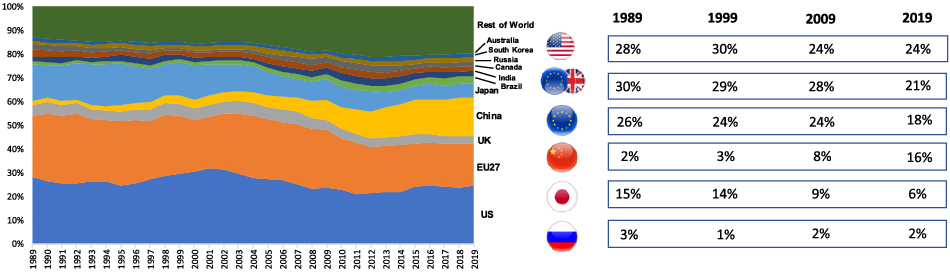
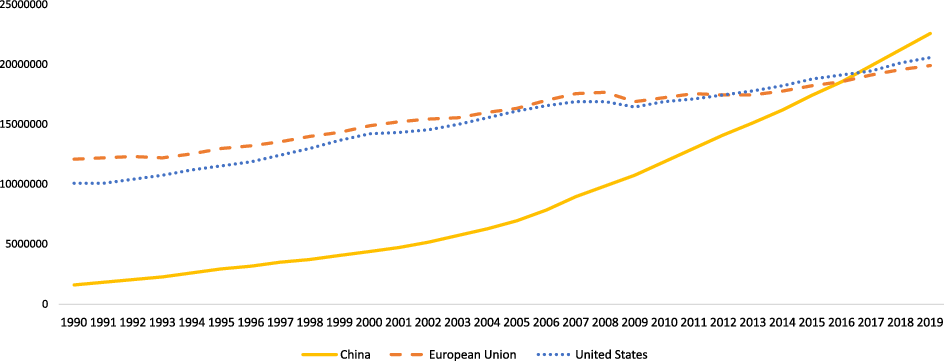
By combining the world’s largest population with an impressive economic growth in the last few decades, China has become the world’s third largest economy in nominal terms, only surpassed by the United States (US) and the European Union (EU) (see Figure 1). By consistently displaying higher growing rates than the US or the EU, China may soon become the biggest economy in the world. Actually, when measured in purchasing power parity (PPP), which adjusts for different prices across countries, China already has the largest economy since 2017 (see Figure 2).
Share of World’s GDP (in current US$). Source: World Bank, World Development Indicators.

GDP, PPP (constant 2017 international $, in millions). Source: World Bank, World Development Indicators.

This impressive economic growth reflects the apparent success of what Deng Xiaoping labelled as ‘socialism with Chinese characteristics’ (Vogel Reference Vogel2011: 465). Indeed, this alternative model has its roots in the profound transformation that took place under Deng’s leadership starting in 1978. According to Vogel (Reference Vogel2011: 696), during this period, not only was it the case that ‘China truly joined the world community, becoming an active part of international organizations and of the global system of trade, finance, and relations among citizens’, but also important reforms have been taken to improve the country’s governance. In fact, Deng acknowledged the need to move away from an excessive centralized economic model, while recognizing the importance of non-interference in individual economic processes, namely the ‘need for real incentives and delegation of authority in order to motivate individual effort’ (Naughton Reference Naughton1993: 492). These features resemble the China system of today, in which an authoritarian communist government paradoxically coexists with a relatively free and open economy. Contrary to democracies, the CCP’s political legitimacy is thus sustained, not by free and fair elections, but essentially by its capacity to consistently deliver growing prosperity to its citizens, something that may be hard to sustain in the long-term. A model that ultimately puts ‘the economy above all else’ (Dan Reference Dan2019: 36).
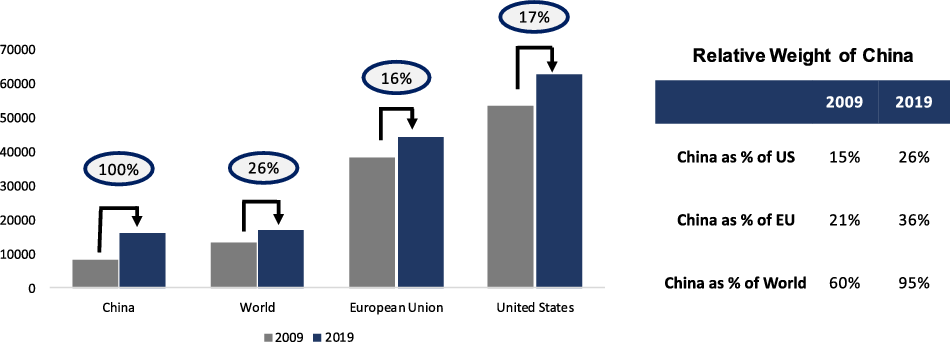
The considerable increase of China’s economy then reflects a country with an increased capacity to use its economic power to pursue its strategic objectives. In that sense, the comparison between the EU’s and China’s economies, including their main links, is important to put the power of both economies into perspective. First, it is important to recall that while China’s alternative model has taken China towards impressive levels of economic growth, the country departed from a very low starting point. For instance, when comparing the GDP per capita in PPP, we see that in just 10 years, the average Chinese citizen has doubled their purchasing power, but that only represents about a third of the GDP per capita in the EU (see Figure 3).
GDP per capita (constant 2017 international $). Source: World Bank, World Development Indicators.

China is therefore still a relatively poor country which, despite having achieved an extraordinary development, is now in transition to a new and slower stage of growth with many challenges ahead. On this matter, Naughton (Reference Naughton2018) underlines that a successful transition to a ‘post-growth-miracle new normal’ will depend on how quickly the country will manage to ‘rebalance’. Otherwise, ‘if it tries too hard to keep growth rate high’, namely by keeping its investment rate too high, there is a real risk of ‘continuous re-creation of numerous asset bubbles, flimsy financial structures, and investment projects of declining quality’ (Naughton Reference Naughton2018: 182). On demography, the author also highlights that the slower growth labour-force and aging population eliminate the demographic advantages China enjoyed in the previous decades (Naughton Reference Naughton2018: 206). Furthermore, from all other challenges that the country faces, the environmental degradation should be highlighted. On this topic, Naughton (Reference Naughton2018: 567) emphasizes that China has maintained an impressive growth ‘at the expense of the environment’ through practices that are unstainable in the future, being ‘hard to determine how quickly they can be changed’. On top of these issues, China presents governance issues that cloud its future. Indeed, if the process of decentralization initiated by Deng was key to promoting growth and a more effective governance, we are currently witnessing the opposite trend. As argued in the afterword of his book, The China Nightmare, Blumenthal (Reference Blumenthal2020) emphasizes that Xi’s increasing centralization of authority, further potentiated by the pandemic, ‘has left China unable to deal with local crises’. Overall, we see that China is still a country with a lot of further growth potential, but also one that faces many structural problems that may prevent it achieving, at least soon, the same level of development of major democracies.
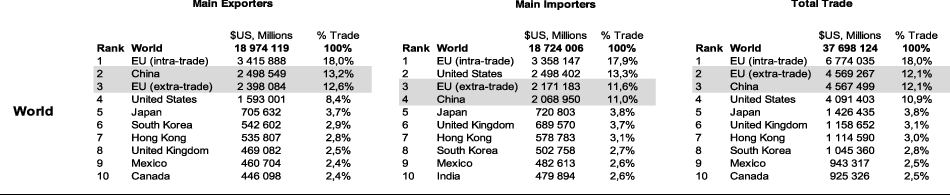
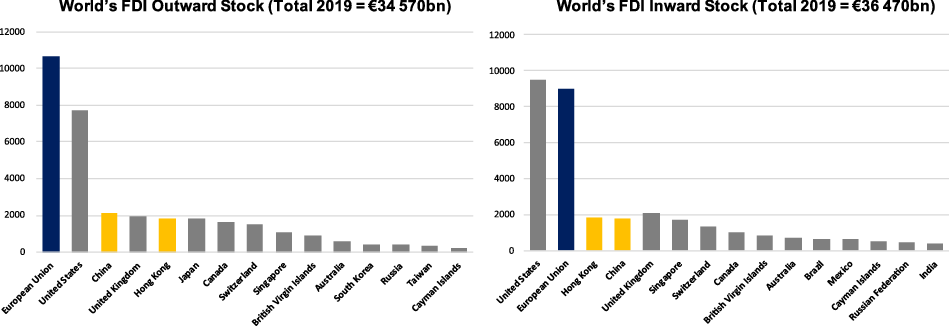
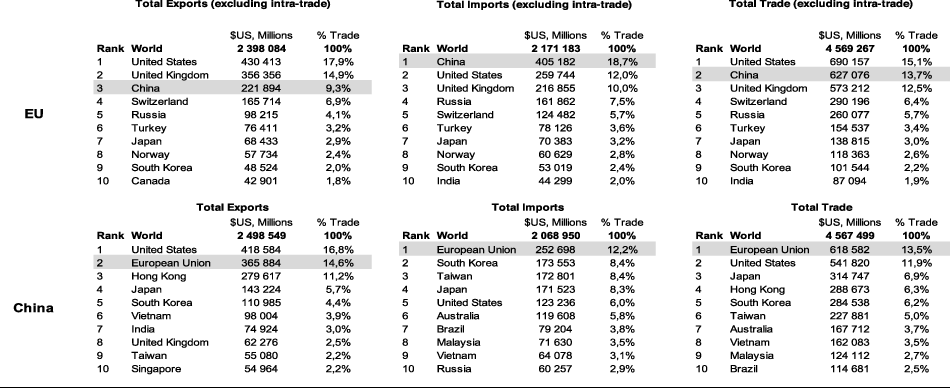
Then, by comparing the economies of EU and China, namely on the components of trade and investment, we find that the EU, even after Brexit, remains the second most important economic power in the world. Besides being the second largest economy after the US, the EU is one of the three biggest trading blocs when just accounting for extra-EU trade (see Figure 4), and clearly outweighs China in both outward and inward foreign direct investment (FDI) (see Figure 5).
World’s Main Traders (Trade of Goods 2019, in $US millions). Source: International Monetary Fund, Direction of Trade Statistics.

World’s Main Outward and Inward Stocks of FDI (FDI 2019, in $US billions). Data for the EU includes both intra and extra-EU stocks, Source: UNCTAD (2020).

When analysing the direct relations between EU and China in these two components, we see that both economies strongly depend on each other, specifically in the trade of goods (see Figure 6). China is the third main destination of EU’s exports (representing 9.3% of EU’s total exports in 2019), being the EU’s main source of imports (18.7%). Conversely, the EU is China’s main importer (12.2%) and the second destination of China’s exports (14.6%).
EU and China top trading partners (trade of goods 2019, in $US millions). Source: International Monetary Fund, Direction of Trade Statistics

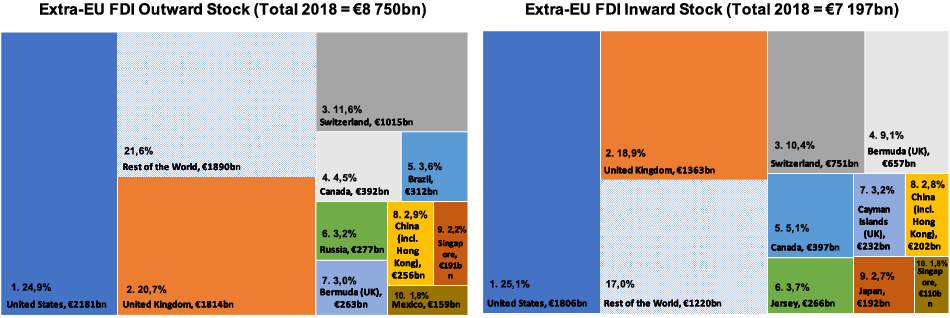
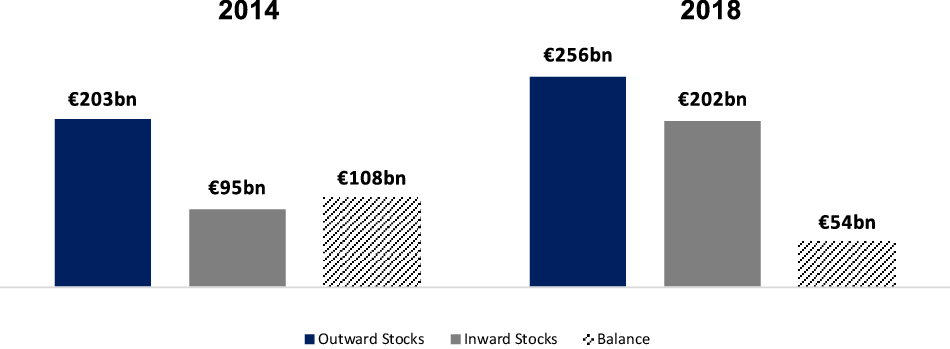
Regarding investment, when accounting for extra-EU FDI stocks (which excludes investments between EU member-states), we see that China does not actually represents a very significant share of the EU’s inward and outward investments, representing in 2018 about 2.9% and 2.8% of stocks respectively (see Figure 7). In addition, the EU shows a positive investment position towards China and Hong Kong (see Figure 8).
Extra-EU top 10 investment partners (FDI Stock 2018, in € billions). Source: Eurostat (2020).

EU outward and inward investments towards China (including Hong Kong) (FDI stock 2014 and 2018, in € billions). Source: Eurostat (2020).

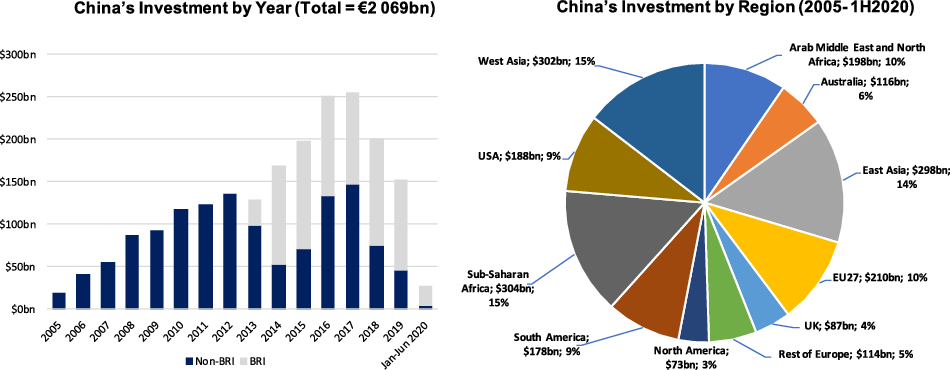
Nonetheless, to carry a proper analysis, it is important to take into account the limits of official databases on FDI, which are usually released with great delay, are distorted by the existence of special purpose vehicles (SPEs) and also lack granular information on the nature of investments. In this sense, in order to have a more detailed overview on China’s FDI, including its real economic presence abroad, it is important to complement the analysis with alternative sources. In this respect, the China Global Investment Tracker (CGIT) provides an important source of information, by tracking, since 2005, China’s global investment and construction projects over $100 million. From 2005 to mid-2020, this dataset accounted for more than 3400 Chinese transactions totalling $2 trillion (from which about 1400 projects amounting to $755 billion relate to the Belt and Road Initiative (BRI) launched in 2013). The EU member-states account for $210 billion (10%) of total Chinese global investments over $100 million in the last 15.5 years (see Figure 9). In the EU, Germany is the largest recipient, but when considering its economic size, it does not show such impressive numbers (see Figure 10).
China’s investment in the world (2005–1H2020) by year and region. Source: AEI and Heritage Foundation, CGIT (2020).

China’s investment in the EU 27 (2005–1H2020) by country and percentage of GDP plus annual evolution. Source: AEI and Heritage Foundation, CGIT (2020) and World Bank, World Development Indicators (for 2019 GDP in current $).

In addition, we observe a visible decrease of China’s investment abroad since 2018. On this subject, Scissors (Reference Scissors2020: 1) highlights as possible explanations the growing suspicions of key host countries towards Chinese firms and the erosion of China’s foreign exchange reserves. The latter is pointed out by the author as the main reason for American decision-makers to focus primarily on protecting the rule of law and ‘stop worrying about another flood’ of Chinese investment, as the ‘foreign exchange squeeze has capped and will continue to cap China’s overseas investments’ (Scissors Reference Scissors2020: 8–9). In addition, the visible effects of the pandemic crisis on the decrease of Chinese investment (as reflected in Figures 9 and 10) further reinforce the author’s arguments that the quantity of investment is not the main problem. In this context, according to Scissors, weak export controls harm the US’s national security more than inbound investment, stressing the protection technology as ‘the most acute challenge for policy’, in which intellectual property coercion and theft constitute the biggest concerns (Scissors Reference Scissors2020: 9–10). Similar arguments can be transposed to the European case. Contrary to most public perception, the quantity of Chinese investments per se should not constitute the EU’s biggest worry, but rather targeted investments or specific cases of partnerships that sometimes do not even need to involve capital participation.
In reality, as Chinese investment is becoming more difficult to find, a report by Rhodium Group (RHG) and the Mercator Institute for China Studies (MERICS) stresses that many Chinese companies entered in R&D collaborations with EU companies, universities, governments, among others (Kratz et al. Reference Kratz, Huotari, Hanemann and Arcesati2020: 7). While these may be essential to solve common problems, the report highlights that, in some cases, the collaboration with Chinese companies that grant access to EU technologies may have a long-term detrimental impact on EU economic competitiveness that is similar to China’s acquisitions of strategic technological assets. On this topic, the report says that ‘European stakeholders still tend to underestimate the Chinese government’s top-down, strategic approach to foreign R&D collaboration’ targeting specific sectors (such as emerging technologies) in which ‘China’s government seeks to create firms that can become global leaders, or to gradually replace foreign technologies with indigenous ones’ (Kratz et al. Reference Kratz, Huotari, Hanemann and Arcesati2020: 16). Additionally, the report also describes some examples that reveal security and military concerns, stressing that some EU–China partnerships could lead to the transfer of dual-use technologies to the Chinese military-industrial complex as both EU’s companies and universities seem to have a lack of awareness about the security issues of some R&D collaborations (Kratz et al. Reference Kratz, Huotari, Hanemann and Arcesati2020: 16–17). Furthermore, within these partnerships, the EU can be indirectly contributing to increasing the CCP’s ability to mass control its population, for instance through several identified joint projects targeting frontier surveillance technologies that are being, or could be, used in the future ‘to increase Beijing’s sway over Uighur and other minorities in Xinjiang’ as well as elsewhere in China (Kratz et al. Reference Kratz, Huotari, Hanemann and Arcesati2020: 17). Similarly, we see that human rights concerns may arise from other types of interactions. For example, a report from the Australian Strategic Policy Institute identifies 83 foreign and Chinese companies, including some European global firms such as Adidas, BMW, Mercedes, Lacoste, Nokia or Zara, that directly or indirectly benefit from the use of Uighur forced labour (Xu et al. Reference Xu, Cave, Leibold, Munro and Ruser2020: 4–5).
On top of all economic, security and human rights concerns, doing business with Chinese companies may run the risk of fragmenting the EU, while subverting its founding values and creating disunity through an evident projection of sharp power. In this regard, Cooper (Reference Cooper2019) describes the growing risk of Chinese economic statecraft, in which the country has used its economic leverage with some EU member-states to secure its political aims. In this sense, Cooper (Reference Cooper2019: 2) highlights that ‘Chinese funding for projects in Greece and Hungary have provided Beijing leverage to disrupt a united European policy on China’, being a clear example of this effect when, for the first time, the EU failed to release a drafted statement criticizing China’s human rights record at the United Nations Human Rights Council in 2017.
The concrete example of Hungary is thus very revealing of the mechanics of China’s sharp power, in which its malign effects are not necessarily proportional to the weight of China’s trade or investment. As portrayed by the International Republican Institute (IRI), ‘China’s growing trade and investment in Hungary have not yet yielded significant economic leverage’, and although Hungary has been the largest Central and Eastern Europe (CEE) recipient of China’s FDI, the ‘Chinese investment nevertheless comprised just 2.4 percent of total FDI stock into Hungary as of 2017’ (Shullman Reference Shullman2019: 43). However, even if quantitatively not very relevant, these economic links open room to other forms of Chinese influence, with IRI’s report emphasizing China’s cultural diplomacy and attempts to influence media coverage with the goal of improving its own image and selling the attractiveness of BRI projects in Hungary. The report also mentions the existence of four Confucius Institutes in the country, in which the host universities may obtain funds ‘in exchange for self-censoring’ criticism to China, with the report also referring the use of ‘funding of academic exchanges and BRI-related travel opportunities for Hungarian scholars’ in order ‘to steer public and elite discourse in favour of China’s goals in Europe and Hungary’ (Shullman Reference Shullman2019: 44). This clearly reflects the risks of corrosive capital from authoritarian countries, in which the majority, as described by Hala (Reference Hala2020: 1), ‘may appear legitimate and can have a financial, political, or cultural character’, but ultimately undermines ‘democratic processes and institutions in the receiving countries’. Moreover, Cooper (Reference Cooper2019: 2) also warns that ‘China could use additional leverage through the emerging “17+1” grouping’ to divide Europe. This group, formed by China plus 17 CEE countries, including 12 EU member-states, such as Greece, Hungary, Czech Republic, but also other EU countries such as Estonia, Poland or Romania, is – according to Hala (Reference Hala2018: 84) – a ‘masterstroke of Chinese diplomacy’, by managing ‘not only to divide Europe once again, but also to herd together countries from Russia’s former backyard and current member-states of the EU without much protest from either’.
Notwithstanding what according to Brînză (Reference Brînză2021) seemed ‘China’s gateway to Europe’, has instead become ‘its biggest headache’ and a ‘zombie mechanism’. In this respect, the author highlights China’s bad approach and lack of a long-term strategy, while ‘China simply failed to deliver on its economic, investment and trade promises, which had made the 17+1 mechanism appealing for the CEE in the first place’. Also, Brînză (Reference Brînză2021) highlights that China did not manage well the ‘EU’s fear of division’, while not keeping a low profile, for instance by not scaling back from annual summits to biennial ones. This only contributed to further increase the EU’s distrust. Furthermore, Lithuanian’s withdrawal from the 17+1 group, while claiming an EU27 united approach towards China, signals an increasingly turbulent relationship between the EU and China (Lau Reference Lau2021).
EU, China and the Preservation of a Liberal International Order
We previously assessed how doing business with China may harm the EU’s democratic values and institutions, as well as the EU’s unity that is so needed to successfully overcome the new challenges posed by China. The next step is to understand whether the EU and China’s divergent political and economic models are really compatible with the preservation of a liberal international order. For that purpose, we first recall its foundation and main components. On this subject, Ikenberry (Reference Ikenberry2011: xii) distinguishes different layers of international order, in which the Westphalia arrangements are the basic pillar of today’s world organization. This system has been (or it can be) the foundation of various types of international order. From this standpoint, the construction of a liberal international order results from the work of leading states (especially the United States) that have pursued a liberal order building. By moving from imperial hegemonic systems, Ikenberry (Reference Ikenberry2011: 26) suggests that a liberal hegemony is ‘built around political bargains, diffuse reciprocity, provision of public goods, and mutually agreeable institutions and working relationships’, operating ‘to a greater or lesser extent’ within established rules and institutions.
With this in view, we conclude that international relations have been following in the last decades what we could define as an American-led liberal hegemony, an order that has been designed after the Second World War and inspired by Wilson’s ambitious vision of a cooperative world in the aftermath of the First World War. This order lasted for about 70 years and is now struggling. In fact, Ikenberry argues that the international system can take various shapes and that the crisis we are experiencing is a crisis of governance, namely a ‘crisis of authority within the old hegemonic organization of liberal order, not a crisis in the deep principles of the order itself’ (Ikenberry Reference Ikenberry2011: 6). Thus, the main challenge is to establish a legitimate authority for a coordinated international action on behalf of the world community in a time where other forms of authority are emerging. Following this reasoning, we see that the subsistence of a stable liberal international order depends on the existence of hegemonic democracies. Notwithstanding, as argued by Deudney and Ikenberry (Reference Deudney and Ikenberry2018), the maintenance of a liberal order does not necessarily imply that all its members are democracies. Underlying the authors’ arguments is the idea that there is no valid alternative to a liberal order. The authors recall that much of international cooperation has nothing to do with liberalism or democracy, but with the Westphalian institutions designed to solve the problems of sovereign states (Deudney and Ikenberry Reference Deudney and Ikenberry2018: 21). Following these ideas, we may claim that cooperation between states of divergent values is possible and even desirable given the growing economic interdependencies. This is precisely the equilibrium EU should aim to achieve towards China.
However, this constitutes a very challenging task. In fact, the mere fact of being the best-known system to solve the problems of sovereign states does not guarantee its perpetuation. In the same way as we argue that a liberal international order results from an imposition by liberal democracies, a world eventually dominated by China would certainly not follow an international order compatible with liberal values. In these conditions, the greater the Chinese economic presence in the world, the greater will be the tendency of CCP to impose its authoritarian values to other countries, particularly the ones already presenting some economic and institutional fragilities. For this reason, the stability of a liberal order depends on the continued existence of healthy democracies with military and economic capacity to actively promote it. In this vein, particularly through economic means, the EU has an important role to play.
In this context, while stopping doing business with China is not the solution, as it is economically irrational, and it is contradictory to EU values of economic openness, any indication of direct or indirect disregard for human rights cannot be tolerated, even if it brings economic costs for EU companies. In addition, security threats, online disinformation campaigns, technology theft or market distortions should immediately trigger a strong (united) response from the EU. As previously seen, the EU has a considerable economic deterrence power and must use it in defence of democratic values. In that regard, the unprecedented EU Commission decision to impose tariffs on Chinese glass fibre manufactures, which were benefiting from unfair subsidies granted by the Chinese government, is a step in the right direction (European Commission 2020a). In the same direction, mainly due to security risks, it would be beneficial if the EU member-states unify their 5G national strategies, even if it brings some economic drawbacks in the short-term.
We have also concluded that major threats come from China’s economic influence over more fragile member-states. As such, the protection of a liberal order starts at home. In that sense, the approval of a massive recovery package to face the pandemic crisis (European Council 2020) helps to mitigate the negative economic effects of the crisis, avoiding economic fragmentation and the likely emergence of further political tensions across member states. Likewise, we have seen, particularly in the case of Hungary, that China usually targets the weakest links. Therefore, strengthening the rule of law is also a way of tackling foreign malign influence. In that vein, the European Parliament (EP) approval of a draft resolution on ‘rule of law conditionality’ to access EU funds is an important step in that direction (European Parliament 2020).
Besides, the investment and trade relations with China have also contributed to accelerating important changes that help strengthen coherence in the EU’s external action. The first worth noting is the EU framework for screening of FDI in the EU. Operational since October 2020, the regulation aims to protect EU strategic interests by creating a mechanism of coordination that allows the Commission to issue opinions on proposed investments that may raise concerns, namely on the grounds of security and public order (European Commission 2020b). Duchâtel (Reference Duchâtel2021) argues that this new mechanism establishes an effective communication system, but a ‘big unknown’ remains, namely regarding what happens when a particular state does not accommodate the Commission or other member states’ comments.
Additionally, it is also worth mentioning the EP’s March 2021 resolution ‘on corporate due diligence and corporate accountability’, proposing the introduction of mandatory rules requiring companies to carry out effective human rights and environmental due diligence (European Parliament 2021a). Moreover, also targeting the protection of human rights, the EU Global Human Rights Sanctions Regime has been adopted in late 2020 (Council of the EU 2020). This new framework had important consequences on EU–China relations, having led the Council, in March 2021, to impose sanctions against four Chinese officials due to human rights violations against Uighur minorities in Xinjiang. These sanctions led the Chinese authorities to take retaliatory measures, having imposed sanctions on several European individuals and entities. Condemning the Chinese sanctions, the EP decided then to ‘freeze’ the discussion on the mandatory ratification of the EU–China Comprehensive Agreement on Investment (CAI), previously agreed in principle in December 2020 (European Parliament 2021b).
The discussion around CAI is the perfect exemplification of EU challenges in terms of balancing economic interests and the protection of democratic values. On the one hand, the existence of an agreement that seeks to ensure a more balanced and reciprocal relationship between the two economies is desirable. At the same time, the timing when the ‘in principle’ agreement has been signed seemed to signal an EU distanced from its values, especially when considering the known events in Xinjiang and Hong Kong. Furthermore, the agreement was signed in open disagreement with the US (Small 2021). If Biden’s presidency opens the door to a normalization of diplomatic relations, the will of a ‘geopolitical Commission’ (von der Leyen Reference Von der Leyen2019) should not represent a smaller commitment to the Atlantic Alliance. In the end, the EU–China sanctions fight, and the consequent ‘frozen’ CAI, paradoxically helped to project an EU committed to the protection of its values (contrary to what the initial agreement seemed to indicate). It also aligns the EU’s position with that of the US, giving room for the much-needed development of a coherent transatlantic policy towards China.
After all, although with some hesitations, the EU seems increasingly aware of the challenges posed by China and is, today, better equipped to deal with authoritarian regimes. Notwithstanding, it is also important to consider that the Chinese efforts to fragment the EU can succeed through a few states, namely – given the unanimity requirement on foreign policy issues – by giving veto power to every member state. Moving towards a qualified majority in areas related to the CFSP would therefore significantly limit Chinese opportunities for disruption. In the words of President von der Leyen (Reference Von der Leyen2020), at her first State of the Union address, member states need to ‘be courageous and finally move to qualified majority voting – at least on human rights and sanctions implementation’ allowing the EU ‘to take clear positions and quick actions on global affairs’.
Conclusion
In the previous sections, we aimed to put China’s growing economic influence into perspective, concluding that even though China’s economy and position in the world has grown significantly, it still lags behind major democratic powers such as the US and EU. Particularly regarding investment, we have seen that China’s FDI in the EU does not represent a big share of its total investment abroad and does not represent a big share of EU’s inward stock of investment (less than 3%). Thus, the quantity of Chinese investments per se should not constitute the EU’s biggest worry, but rather targeted investments or even partnerships that may not even require capital participation. In this context, while acknowledging that doing business with China poses numerous concerns, such as human rights violations, breaches of rule of law, unfair competition, the theft of technology secrets, as well as the very integrity of the European project, we conclude that the EU has considerable economic deterrence power to push China into respecting a rules-based world order.
Moreover, we concluded that the Chinese model may have achieved its limits when its economic influence abroad started to become more visible. Besides highlighting some of China’s current economic challenges, this article mainly focused on describing authoritarian practices that project a global mistrust, which ultimately may limit the country’s ability to do business abroad. While the model of liberal democracies can be the basis of a liberal international order that brings prosperity to the world, the Chinese model cannot, as there is no way of continuing to increase the world’s prosperity without mechanisms of free and fair economic exchanges. In other words, an authoritarian hegemony will not support a liberal order, even if this order would theoretically be more beneficial for all parties.
Within this framework, recalling Lascurettes’ (Reference Lascurettes2020) arguments on domestic regime preservation, we conclude that the fight for protecting a liberal international system goes beyond preserving an international system that provides better economic outcomes for the majority of its members, or even goes beyond promoting a system abroad that we believe is fairer. It is, above all, about safeguarding democracy. In this sense, as the recent events on CAI have shown, it is virtually impossible to disassociate economic interests from the protection of domestic values. When the two clash, values must always prevail, as they ultimately did in this particular case, albeit with some hesitations. Given the distinct nature of their political models, such tension will inevitably always be present in EU–China relations. Recent reforms, such as the investment screening mechanism and the global sanctions regime, were an important step towards the affirmation of an EU committed to its values, whereas the unanimity requirement in CFSP’s decision-making will likely remain a relevant obstacle for a coherent and efficient EU external action.
About the Author
Luís Leal de Faria is a PhD Candidate at the Institute for Political Studies at the Universidade Católica Portuguesa (IEP-UCP), Researcher at the Research Centre of IEP-UCP (CIEP) and Teaching Assistant at the Nova School of Business and Economics (NovaSBE). Before starting his PhD in 2018, Luís worked at the Banco de Portugal and the European Central Bank. He holds an MSc in Finance and a BSc in Economics from NovaSBE.