1. Introduction
Large tsunamis have been recorded following relatively (and unexpectedly) small earthquakes along convergent margins, and seismologists refer to these events as tsunami earthquakes or slow earthquakes (e.g. Kanamori, Reference Kanamori1972). However, most were probably the result of submarine landslides (Kanamori & Kikuchi, Reference Kanamori and Kikuchi1993; Tappin et al. Reference Tappin, Watts, McMurtry, Lafoy and Matsumoto2001; Kawamura et al. Reference Kawamura, Sasaki, Kanamatsu, Sakaguchi and Ogawa2012).
On 15 June 1896 the Meiji Sanriku earthquake generated a devastating tsunami (maximum run-up of 37 m) that caused the worst tsunami disaster in Japanese history, despite having an Ms of only 7.2 and low seismic intensity (Tanioka & Satake, Reference Tanioka and Satake1996). Abe (Reference Abe1979) showed that in spite of the low Ms, the Mt of this event was up to 8.6. To explain the discrepancy between Ms and Mt, the 1896 Sanriku earthquake has been variously attributed to slow rupture along the fault (Kanamori, Reference Kanamori1972), submarine landslides (Kanamori & Kikuchi, Reference Kanamori and Kikuchi1993), and additional rapid uplift of a sediment wedge (Tanioka & Seno, Reference Tanioka and Seno2001). Kawamura et al. (Reference Kawamura, Sasaki, Kanamatsu, Sakaguchi and Ogawa2012) argued in support of the submarine landslide scenario on the basis of topographic analysis and geological architecture, as described in previous studies of tectonic erosion (e.g. Huene & Lallemand, Reference Huene and Lallemand1990).
The Meiji Sanriku submarine slides are characterized by an amphitheatre-shaped depression that represents the submarine slide scar. It is possible that submarine slides move repeatedly on the slope in and around the depression (Kawamura et al. Reference Kawamura, Laberg and Kanamatsu2014). In the active region of submarine slides, there are normal faults on the upper slope and pressure ridges on the lower slope, as shown by Masson et al. (Reference Masson, Harbitz, Wynn, Pedersen and Lovholt2006). Thus, the topographic characteristics are one of the keys to improving our understanding of the activity of such slopes.
In this study, we propose that an active surface sediment creep deformation is generated by continuous gravitational slope instability based on detailed bathymetric data and sub-bottom profiling data from the deep-sea terrace of the Japan Trench between 37°30′ N and 38° N. We also present our hypothesis that the active creep is caused by a retrogressive slope instability with the large-scale submarine slides along the Japan Trench. Our model explains how a unique wavy topography by active folds and normal faults can be generated on a landward slope in the Japan Trench. In addition, our results are important for mitigating the potential tsunami hazard affecting the Japan Trench region.
2. General topography and tectonic setting of the Japan Trench
An Mw 9.0 earthquake occurred on 11 March 2011 off the Pacific coast of NE Japan (hereafter the 2011 Tohoku-oki earthquake) and generated a series of large tsunami waves. These tsunami waves had run-up heights of >40 m and caused widespread inundation along the coast of NE Japan (Tsuji et al. Reference Tsuji, Satake, Ishibe, Kusumoto, Harada, Nishiyama, Kim, Ueno, Murotani, oki, Sugimoto, Tomari, Heidarzadh, Watada, Imai, Choi, Yoon, Bae, Kim and Kim2011). Following the event, we conducted geological surveys to determine the cause of this large tsunami that was generated in the Japan Trench.
Using seismic wave inversion analysis, previous studies have revealed a c. 20 m slip at the hypocentre at a depth of 24 km (e.g. Ide et al. Reference Ide, Baltay and Beroza2011). This slip developed into an 80 m slip at the seafloor (Ito et al. Reference Ito, Tsuji, Osada, Kido, Inazu, Hayashi, Tsushima, Hino and Fujimoto2011). By comparing seismic images collected before and after the 2011 Tohoku-oki earthquake, Kodaira et al. (Reference Kodaira, No, Nakamura, Fujiwara, Kaiho, Miura, Takahashi, Kaneda and Taira2012) revealed that thrust faults associated with the earthquake showed a large slip on the trench floor. Such a large slip at this shallow depth would almost certainly excite a large tsunami, as shown by numerous tsunami simulation studies (e.g. Maeda et al. Reference Maeda, Furumura, Sakai and Shinohara2011; Satake et al. Reference Satake, Fujii, Harada and Namegaya2013), but there are several scenarios that might explain the focal mechanism of a large shallow slip, such as dynamic overshoot (Ide et al. Reference Ide, Baltay and Beroza2011), wedge extension (Tsuji et al. Reference Tsuji, Kawamura, Kanamatsu, Kasaya, Fujikura, Ito, Tsuru and Kinoshita2013) or a submarine slide (Kawamura et al. Reference Kawamura, Sasaki, Kanamatsu, Sakaguchi and Ogawa2012, Reference Kawamura, Laberg and Kanamatsu2014; Strasser et al. Reference Strasser, Kolling, Ferreira, Fink, Fujiwara, Henkel, Ikehara, Kanamatsu, Kawamura, Kodaira, Romer and Wefer2013; Tappin et al. Reference Tappin, Grilli, Harris, Geller, Masterlark, Kirby, Shi, Ma, Thingbaijam and Mai2014). To determine which of these potential mechanisms was the most likely cause of the Meiji Sanriku slide, we must first elucidate the distribution of active deformation structures (e.g. active folds and faults) in this area, as the distribution of active structures is the key to ascertaining the focal processes and mechanisms of the 2011 Tohoku-oki earthquake and tsunami.
The Pacific plate is being subducted to the west beneath NE Japan at a rate of 9 cm a−1 (Seno et al. Reference Seno, Ogawa, Tokuyama, Nishiyama and Taira1989; Fig. 1a). Based on topography, the Japan Trench slope can be divided into a deep-sea terrace (the upper slope), a mid-slope terrace and a lower slope (Fig. 1b). The average slope angle of the upper and lower slopes is 5°, whereas that of the mid-slope terrace is only 2° (Huene & Lallemand, Reference Huene and Lallemand1990). Some upward convex parts of the upper and lower slopes have a slope of >10°, particularly in the region from 39°10′ N to 40°30′ N, with the Sanriku Escarpment as a fault cliff (Fig. 1b). The upper slope includes many large, upward convex, horizontally arcuate topographic features that suggest submarine sliding of Neogene forearc basin sediments and sedimentary rock masses with widths and lengths of several kilometres (Kawamura et al. Reference Kawamura, Sasaki, Kanamatsu, Sakaguchi and Ogawa2012). These submarine slides have been interpreted to have been caused by tectonic erosion (Huene & Culotta, Reference Huene and Culotta1989). Because of the tectonic erosion, the lower slope is composed of Cretaceous sedimentary rocks, but there is a small active accretionary prism body at the base of the lower slope (Huene & Culotta, Reference Huene and Culotta1989).
Study area and survey lines. (a) Location of the study area. Plate convergence directions are indicated by black arrows. The trenches are the Kuril Trench (Kuril T.), Japan Trench (Japan T.) and Nankai Trough (Nankai T.). At the Japan Trench, the Pacific plate is subducting to the west at 9 cm a−1 (Seno et al. Reference Seno, Ogawa, Tokuyama, Nishiyama and Taira1989). A black square indicates the location of (b). (b) Topography of the study area. Dotted lines indicate arcuate-shaped depressions that were probably caused by tectonic erosion. The grey star indicates the epicentre of the 2011 Tohoku-oki earthquake. Solid lines with numbers are SBP survey lines corresponding to the SBP images in Figures 3 and 4. A black rectangle shows the location of Figure 2a, b.

3. Methods
No detailed topographic data were available for the research area from the periods immediately before and after the 2011 Tohoku-oki earthquake. Therefore, to investigate seafloor conditions in the Tohoku area, in March 2012 we embarked on survey cruise MR12-E02 to obtain detailed topographic data from depths of 300 to 1200 m on a deep-sea terrace and make visual observations along 71 survey lines. The survey area was the region bounded by 37°40′ N, 141°45′ E, and 39°40′ N, 142°35′ E, which contains an upper slope at water depths of 400–1200 m, off Sendai in NE Japan (Fig. 1b).
During the cruise, the shipboard multi-beam echo sounder (MBES) topographic data and sub-bottom profiling (SBP) data were obtained using a standard hull-mounted Sea Beam 2112.004 system on board R/V Mirai. This system transmits a 12 kHz sonar beam with a 120° swath range and 2° beam width for bathymetry and a 4 kHz FM chirp signal for sub-bottom profiling. Data acquisition was always carried out at night. Most topographic survey lines were set to run north–south to follow the topographic strike. In addition, we recorded the temperature profile using an expandable bathy-thermograph (XBT) or an expandable conductivity temperature–depth profiler (XCTD) at many sites for acoustic wave velocity calibration because variations in the seawater temperature profile can cause serious problems for acoustic velocity calibration. Errors were removed from the MBES data and were corrected for the sound velocity and tide using the HIPS and SIPS (Caris Inc.) processing software. After processing and editing, all data were exported to an ASCII dataset together with the latitude, longitude and depth of the sampling points. This dataset was converted to grid data with a 50 m horizontal interval using the Generic Mapping Tools (GMT) software (Wessel & Smith, Reference Wessel and Smith1998).
In addition, 15 lines were surveyed using the parametric-type SBP system (TOPAS PS 18 system, Kongsberg) to obtain the east–west (SBPs 77, 78, 85 and 86) and north–south (SBPs 54, 55 and 57–65) transects (Fig. 1b).
4. Results
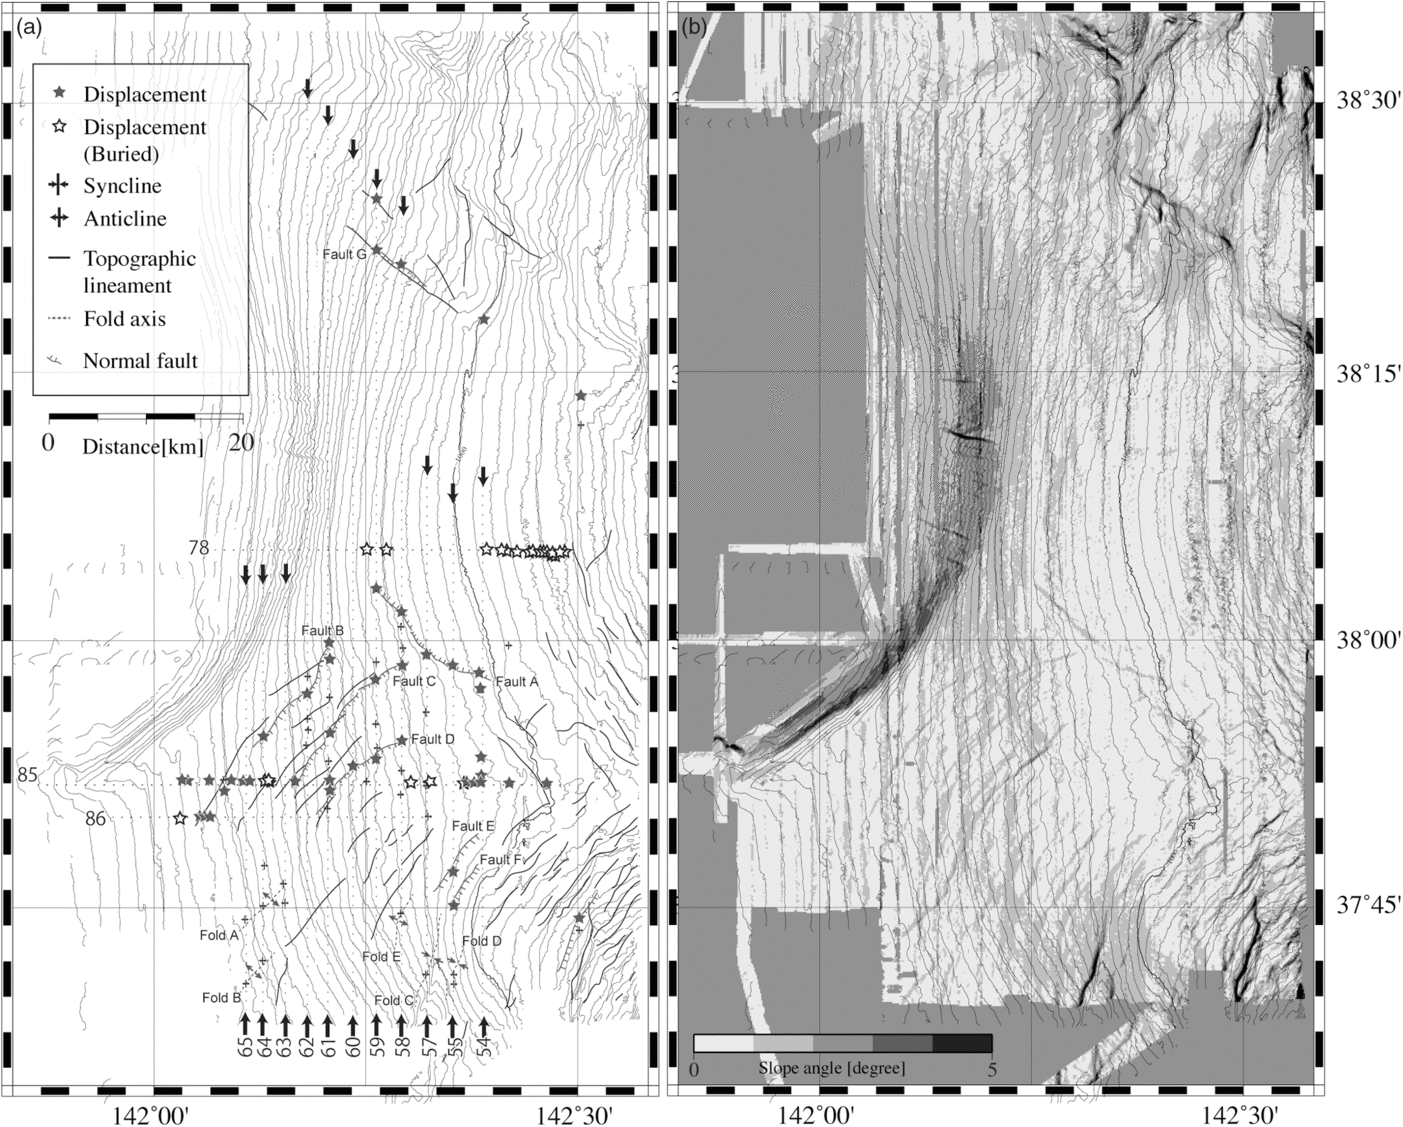
The MBES and SBP data from 86 survey lines (Fig. 1b) were collated and analysed to assess seafloor deformation in the southern part of the study region (south of 38° N), as shown in Figure 2a. The topographic gradient map (Fig. 2b) shows arcuate-shaped lineaments concentrated south of 38° N (Fig. 2a). These lineaments are oblique to the contour lines, indicating large horseshoe-shaped depressions, c. 50 km wide, along the Japan Trench (Fig. 1b).
Detailed bathymetric maps. (a) Distribution of deformation structures. Solid lines show lineaments identified from the breaks in slope evident in the MBES data (see (b)). Solid and open stars denote faults, which were confirmed by analysis of the SBP data in Figures 3 and 4. Synclines and anticlines were also confirmed from the SBP data. Deformation structures identified in the SBP data overlap spatially with the lineaments identified from the MBES data. Lines labelled 54–65 and 78–86 show the SBP survey line locations for Figures 3 and 4, respectively. (b) Distribution of slope gradient. Contour interval is 20 m.

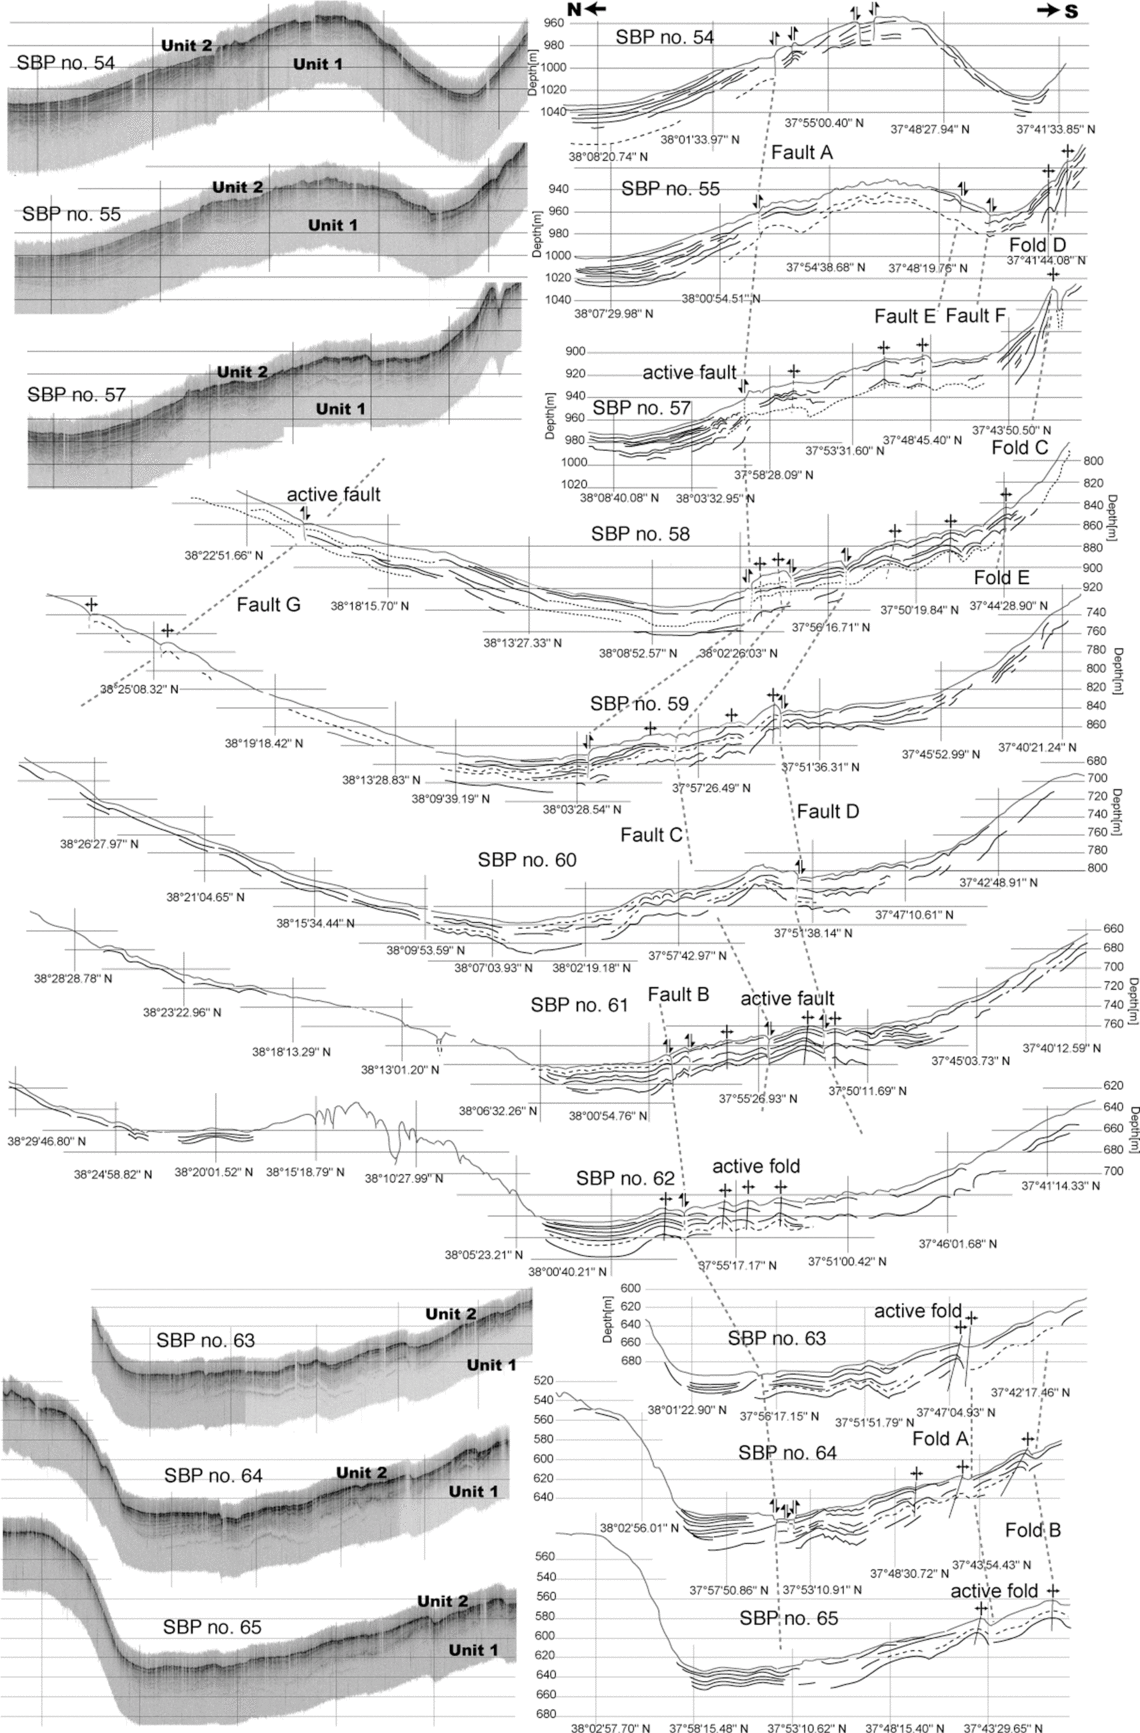
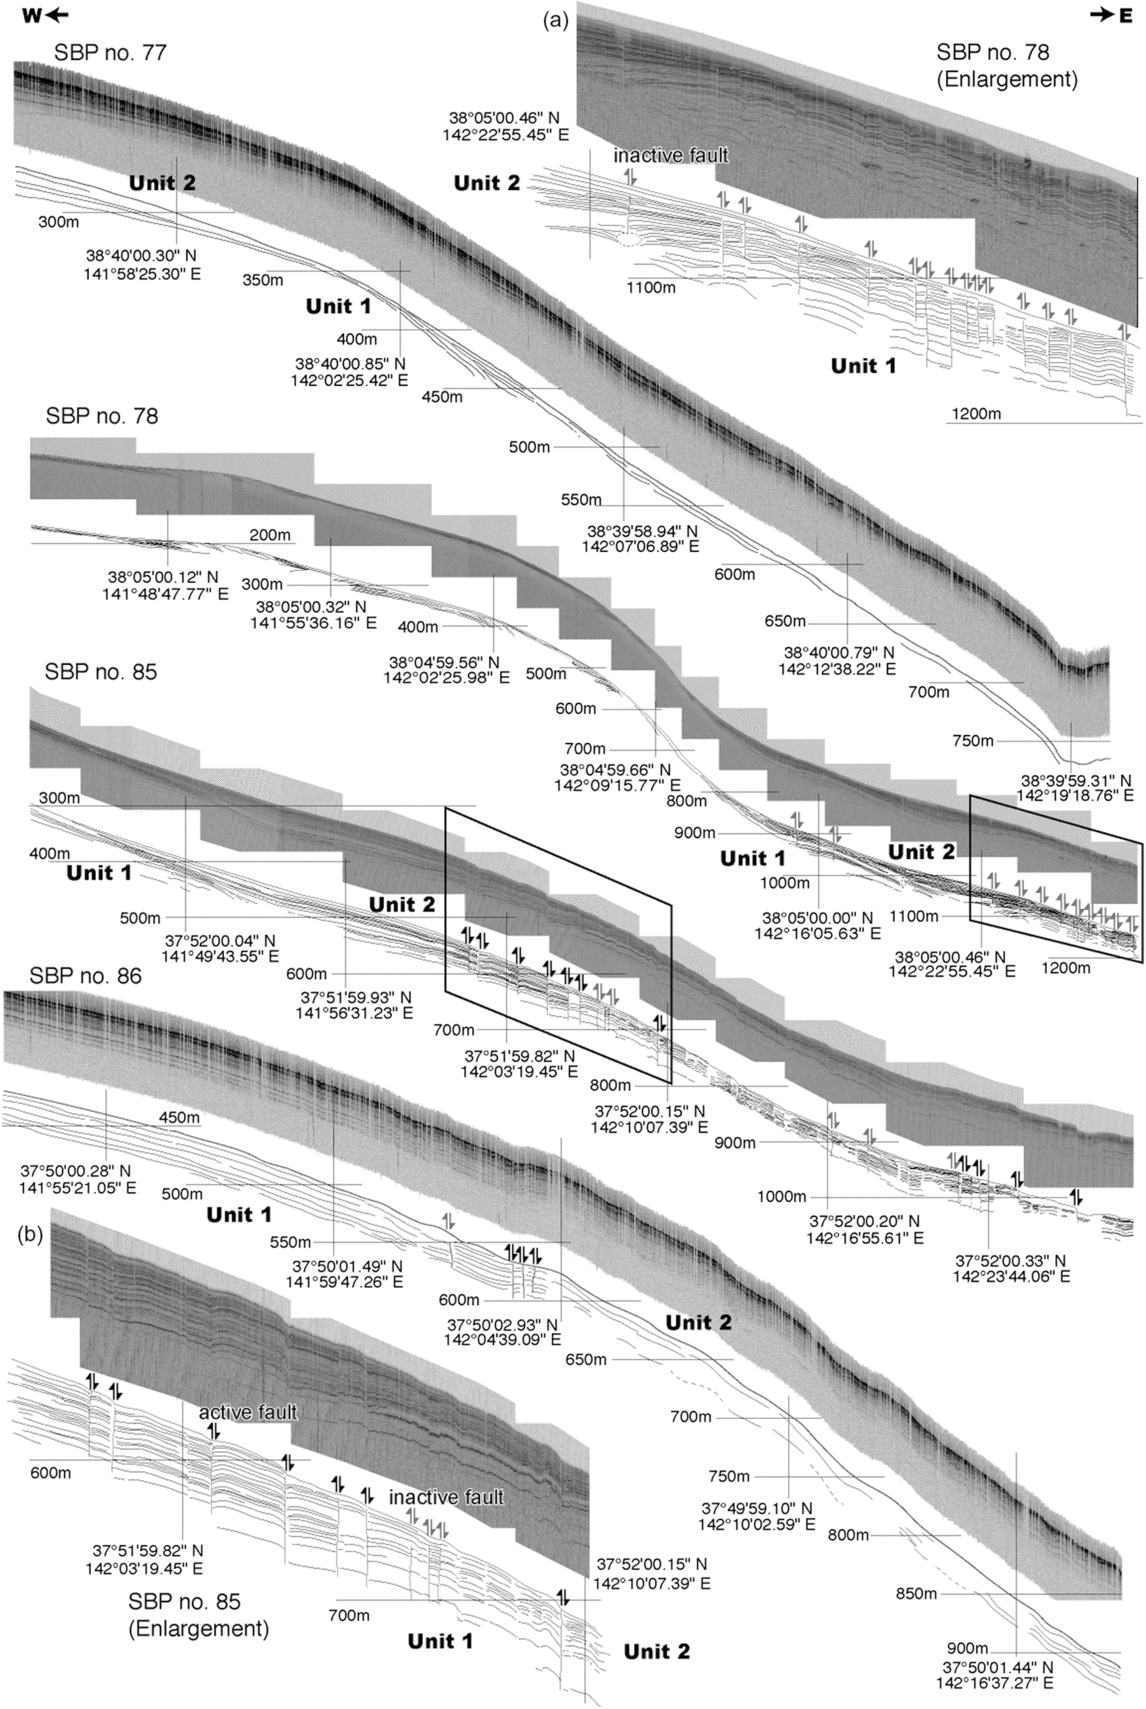
The upper and lower units are well defined in the SBP sequences (Figs 3 and 4). The upper unit (Unit 2) is characterized by continuous onlapping acoustic reflectors with a smooth erosional base. The lower unit (Unit 1) is transparent, with weak continuous reflectors that are interpreted as the base of the unit. These characteristics correspond to deposits that accumulated during a rise and subsequent fall in sea level, as discussed below.
Interpretation of N–S SBP data from lines 54–65. The original data from SBPs 54, 55, 57, 63, 64 and 65 are shown on the right. The locations of these survey lines are shown in Figure 1b. A layered unit (Unit 2) and a transparent unit (Unit 1) were identified. Several folds were inferred from the dataset of the N–S SBP lines, as presented in Figure 1b. Most of the folds were buried at shallow depths (grey arrows), but typically crop out on the seafloor (black arrows), indicating active deformation.

Original E–W SBP data (upper image in each image–sketch pair) and interpretation (lower sketch) from lines 77, 78, 85 and 86. The locations of the survey lines are shown in Figure 1b. A layered unit (Unit 2) and a transparent unit (Unit 1) are identified. On SBP line 77, there is no deformation in the sediment layers. On SBP line 78, most of the displacements cut the seafloor (black arrows indicating displacement sense), although normal faults at 38°50′ N are buried (grey arrows indicating displacement sense). On SBP line 85, normal faulting is evident at 37°52′ N. The displacements step down eastwards, which is downwards along the slope. This indicates that surface sediments are actively deforming in the south of the region, but not in the north. SBP line 86 show normal faulting. The SBP images indicated by the black squares on SBP lines 78 and 86 are enlarged in A and B, respectively.

We identified anticlines and normal faults in the sediment layers of the N–S SBP lines (Fig. 3). Most of the faults are partially buried, but they typically crop out on the seafloor (Figs 2a and 3), which indicates the ongoing nature of deformation. Faults B–F are sub-parallel to the topographic lineaments. The fault displacements step down to the east (trenchward; Figs 2a and 3). Folds A–D are sub-parallel to the topographic lineaments and are not covered by sediment, indicating that these folds remain active. Faults A and G are located on the north and south margins of the arcuate-shaped topography north of 38° N. In this region, the surface sediments are not deformed (Fig. 3), but there are many buried faults in the E–W SBP line (Fig. 4).
Normal-sense fault displacements are evident on two of the E–W SBP lines (Fig. 4). Of note, the normal-sense fault displacements step down to the east (trenchward), which is downwards along the slope on SBP lines 85 and 86. These step-down structures correspond to the topographic lineaments defined by the steepening of the slope identified in the slope gradient distribution (Fig. 2b). On E–W SBP lines 77 and 78, there are active faults, which are indicated by displacements in the seafloor and also inactive faults, which are buried. The displacements stop within the upper unit. This observation indicates that surface sediments are actively deforming in the south of the region, but not in the north (Fig. 2a).
5. Discussion
Sediment waves and submarine slides produce similar sedimentary structures. Lee et al. (Reference Lee, Syviski, Parker, Orange, Locat, Hutton and Imran2002) showed that the Humboldt slides were not formed by a submarine slide but by a sediment wave, as no faults are evident within this structure. However, based on the above results, the arcuate-shaped lineaments are inferred to have formed as a result of active folds and active normal faults in the surface sediments. In general, folds result from the contraction of sediments, indicating that the sediments are under compression. However, normal faults usually form under extension. The arcuate-shaped lineaments are similar to the seafloor topography caused by sediment creep deformation at a scar in the BIG’95 Slide in the Valencia Channel and at the Central Adriatic Deformation Belt (CADEB) creep area in the Adriatic Sea (Canals et al. Reference Canals, Lastras, Urgeles, Casamor, Mienert, Cataneo, De Batist, Haflidason, Imbo, Laberg, Locat, Long, Longva, Masson, Sultan, Trincardi and Bryn2004). We propose that such complex stress fields in the surface layer are the result of active creep deformation of the seafloor sediment.
Subaqueous creep deformation generally occurs on steep, coarse-grained shorefaces or deltas where the slope is up to 35° (Martinsen, Reference Martinsen and Maltman1993). Recently, however, Morita et al. (Reference Morita, Nakajima, Hanamura, Yamada, Kawamura, Ikehara, Ogawa, Urgeles, Mosher, Chaytor and Strasser2012) described gravity-driven slumps on a shallow slope with a gradient of only a few degrees. Such slumps occur with sub-horizontal slip planes and are related to excess fluid pressure. According to Masson et al. (Reference Masson, Harbitz, Wynn, Pedersen and Lovholt2006), continental margin slopes that are subjected to large-scale failures are typically of low gradient (<1° to 5°) with gentle topography. We consider that creep deformation occurs on the seafloor surface because of the unstable condition of the slope sediment.
Saito (Reference Saito1994) described sedimentary units in part of the present study region using acoustic images and core samples from water depths of 100 to 600 m. Saito’s (Reference Saito1994) upper unit corresponds to our Unit 2: a 0.5–1.5 m thick layer of very poorly sorted, muddy coarse sand containing pebbles, mixed-habitat mollusc shells, glauconite, volcanic rock fragments, and mixed-habitat diatom and ostracod assemblages with well-preserved primary sedimentary structures. This unit spans the period of rising sea level from the latest Pleistocene to the early Holocene; i.e. 14–6 ka (Saito, Reference Saito1994). The characteristics and stratigraphy of Saito’s (Reference Saito1994) lower unit, which was deposited at 20–14 ka and indicates a fall and subsequent lowstand in sea level during the latest Pleistocene, indicate that it corresponds to our Unit 1.
The faults in the south of the study area cut the seafloor, whereas those further north stop within Unit 2. This indicates that the area of active faulting moved from north to south during 14–6 ka (Fig. 5).
Schematic illustration of active creep deformation and active normal faults in the surface sediments on the deep-sea terrace in the Japan Trench. The Pacific plate is subducting beneath NE Japan and is tectonically eroding the landward slope, forming normal faults by retrogressive sliding. It is possible that many folds are being formed on the landward slope as submarine slides on the upper slope push surface sediments onto the lower slope.

There are three mechanisms that can produce creep deformation of sediment layers. The first is sporadic subsidence on a deep-sea terrace, as described by Arai et al. (Reference Arai, Inoue, Ikehara and Sasaki2014), who reported two lenticular units indicating buried isolated basin deposits located just below active isolated basins. They concluded that the isolated basins resulted from periodic subsidence at locations that were probably subjected to tectonic erosion beneath the accretionary wedge. Similar subsidence close to the present study area, caused by slope instability, might have induced the observed creep deformation.
The second possibility is slope instability caused by sporadic uplift along the foot of the continental shelf. Normal and reverse faults occur along the foot of the continental shelf (Miyauchi, Reference Miyauchi2012). Ikeda et al. (Reference Ikeda, Okada and Tajikara2014) proposed a relationship between long-term tectonic deformation and geodetic variations; however, there is a contradiction between the geodetic and geological data from our study site. The geodetic data indicate slow and rapid subsidence during interseismic and coseismic periods, respectively, whereas geological data from a marine terrace record long-term uplift in the Tohoku region. Ikeda et al. (Reference Ikeda, Okada and Tajikara2014) assumed that the uplift occurs during the post-seismic period. In this case, the faults along the foot of the continental shelf may move as a reverse fault (Miyauchi, Reference Miyauchi2012).
The third potential mechanism involves retrogressive submarine slides (Fig. 5). Our results show active creep deformation of the surface sediments at the top of an arcuate-shaped depression (Fig. 1b). Along the landward slopes of the Japan Trench off Tohoku, we observed horseshoe-shaped depressions that are ~50 km wide (Fig. 1b). These indicate tectonic erosion as described by Huene & Culotta (Reference Huene and Culotta1989), and some of them are active (Kawamura et al. Reference Kawamura, Sasaki, Kanamatsu, Sakaguchi and Ogawa2012).
The active creep deformation recorded in this study occurs on the upper slopes of submarine slides on a deep-sea terrace (Fig. 1b). The creep deformation structures have developed in depressions, implying that the tectonic erosion at the foot of the accretionary wedge is ongoing. Such depressions are the sites of retrogressive slides (Taira & Ogawa, Reference Taira and Ogawa1991), and repeated small slides of this type could result in the formation of horseshoe-shaped depressions over time (Fig. 1b).
In summary, the three possible mechanisms of creep deformation are associated with the tectonics of the region. We propose that the creep deformation is caused by retrogressive sliding, as the area affected by creep is located near the top of a submarine slide (Fig. 5). However, further investigation is required to clarify the cause of the creep deformation.
6. Concluding remarks
The active creep deformation documented in this study would result in a slow rate of deformation, even though a Mw 9 earthquake occurred in 2011. However, several unresolved earthquake-related tsunami events remain problematic in this region (e.g. the 1896 Meiji Sanriku earthquake and tsunami), and some of the large tsunamis that originated in the Japan Trench are thought to have been generated by submarine slides (Kanamori & Kikuchi, Reference Kanamori and Kikuchi1993; Kawamura et al. Reference Kawamura, Sasaki, Kanamatsu, Sakaguchi and Ogawa2012, Reference Kawamura, Laberg and Kanamatsu2014; Tappin et al. Reference Tappin, Grilli, Harris, Geller, Masterlark, Kirby, Shi, Ma, Thingbaijam and Mai2014). If this creep deformation were to occur rapidly, it would cause a large tsunami along the Pacific coast of the Tohoku area. Therefore, we recommend precautionary monitoring of this creep movement to mitigate the potential tsunami hazard.
Author ORCIDs
Takafumi Kasaya 0000-0003-0881-4167, Kiichiro Kawamura 0000-0003-0501-4033
Acknowledgements
We thank Drs K. Fujikura, H. Nomaki, H. Kitazato and Y. Fujiwara (Japan Agency for Marine–Earth Science and Technology (JAMSTEC)) for data acquisition on the R/V Mirai cruises. Drs S. Miura (JAMSTEC), Y. Yamada (JAMSTEC) and S. Morita (National Institute of Advanced Industrial Science and Technology (AIST), Geological Survey of Japan (GSJ)) provided constructive suggestions regarding the interpretation of SBP data. We also thank the captain, crew and marine technicians of R/V Mirai for their assistance during cruise MR12–E02. We thank Professor Yildirim Dilek (Miami University) and anonymous reviewers for constructive suggestions. This study was partly supported by the Tohoku Ecosystem-Association of Marine Sciences and a Grant-in-Aid from the Ministry of Education, Culture, Sports, Science and Technology of Japan to the second author (20340139).