1. Introduction
When a liquid drop is placed in contact with a material at a temperature lower than the drop melting temperature, crystals grow at the interface until an ice layer is formed, and then a solidification front propagates away from the interface (Schremb et al. Reference Schremb, Campbell, Christenson and Tropea2017a ; Thiévenaz et al. Reference Thiévenaz, Séon and Josserand2019). On solids, the apparition of crystals has been found to have a key role on drop-spreading dynamics. When crystal growth is faster than the contact-line velocity, Herbaut et al. (Reference Herbaut, Brunet, Limat and Royon2019) reported a stick-slip behaviour of the contact line when its velocity is imposed and de Ruiter et al. (Reference de Ruiter, Colinet, Brunet, Snoeijer and Gelderblom2017) even observed the arrest of the spreading. To predict contact-line arrest, understanding the development of crystals appears to be crucial. To this end, recent efforts have been made to visualise the fast crystal growth with techniques involving total internal reflection imaging (Kant et al. Reference Kant, Koldeweij, Harth, van Limbeek and Lohse2020; Koldeweij et al. Reference Koldeweij, Kant, Harth, de Ruiter, Gelderblom, Snoeijer, Lohse and van Limbeek2021) and polarised light imaging (Grivet et al. Reference Grivet, Monier, Huerre, Josserand and Séon2022). Their observations are supported by models based on classic nucleation theory.
Crystals can also appear at a liquid–liquid interface, which provides a soft, defect-free and stress-free interface (Elsen et al. Reference Elsen, Festersen, Runge, Koops, Ocko, Deutsch, Seeck, Murphy and Magnussen2013), in contrast with solid surfaces where surface defects and nanobubbles can be sites for crystal nucleation (Schremb et al. Reference Schremb, Roisman and Tropea2017b ). The liquid–liquid configuration is scarcely studied although it is present in applications such as the synthesis of nanocrystals (Rao & Kalyanikutty Reference Rao and Kalyanikutty2008), the solidification of emulsion droplets (Denkov et al. Reference Denkov, Tcholakova, Lesov, Cholakova and Smoukov2015; Guttman et al. Reference Guttman, Sapir, Schultz, Butenko, Ocko, Deutsch and Sloutskin2016) the production of particles (Chan et al. Reference Chan, Lee, Ravindra and Poncelet2009; Lee, Beesabathuni & Shen Reference Lee, Beesabathuni and Shen2015).
In the present study, we consider thus a drop impacting a thin liquid film on which the crystals forming at the liquid–liquid interface can be visualised. We have shown in a former work that the growth velocity of these crystals is responsible for the final morphology of impacted drops on the liquid bath (Berry et al. Reference Berry, Josserand, Salonen and Boulogne2024). Here, we choose to focus on thin liquid films, where the drop spreads radially rather than as a hemispherical cavity formed upon impact on thicker baths.
The article is organised as follows. In § 2, we describe the experimental set-up and the observations. Then, we present a model to predict the dynamics of the number of crystals and their surface area in § 3. Finally, we discuss the results in § 4 and we conclude.
2. Experimental procedure and observations
2.1. Materials and methods
The experiment consists of releasing a drop at room temperature,
 $T_{ {d}}$
, onto a liquid film at a temperature
 $T_{\! {f}}$
lower than the melting temperature
 $T_{ {m}}$
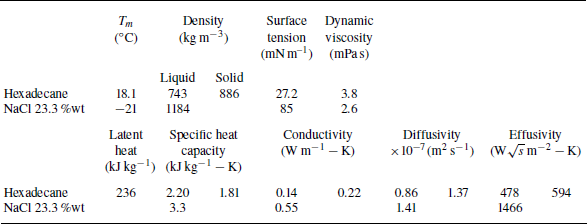
of the drop. We choose two non-miscible liquids. The drop is hexadecane with a molar mass
 $M_{ {d}}=$
226.45 g mol–1, a melting temperature
 $T_{ {m}}=18.1\,^\circ {\textrm{C}}$
, a liquid density
 $ho _{ {d}}$
= 743 kg m
 $^{-3}$
, a viscosity
 ${\mu} _{ {d}}$
= 3.8 mPa s, a surface tension
 $\gamma _{ {d}}$
= 27 mN m–1, a specific heat capacity
 $C_{p, {d}} = 2.20$
kJ (kg K–1), a thermal conductivity
 $\lambda _{ {d}} $
= 0.14 W mK–1 and an enthalpy of solidification
 ${\mathcal{L}}=$
236 kJ kg–1. We also introduce the surface tension between the liquid phase and solid phase of hexadecane,
 $\sigma _{ls} = 0.0068$
J m
 $^{-2}$
(Oliver & Calvert Reference Oliver and Calvert1975). The liquid and thermal properties of hexadecane are taken at room temperature,
 $T_{ {d}} = 20\,^\circ {\textrm{C}}$
(Berry et al. Reference Berry, Josserand, Salonen and Boulogne2024). The liquid film is a brine constituted of 23.3 wt % NaCl in pure water. The film temperature
 $T_{\! {f}}$
is measured with a K-type thermocouple (Radiospare) and ranges from room temperature,
 $20\,^\circ {\textrm{C}}$
, to
 $-21\,^\circ {\textrm{C}}$
. The liquid and thermal properties of the brine are taken at a mean temperature of
 $0\,^\circ {\textrm{C}}$
, giving a density
 $ho _{\! {f}}=$
1184 kg m–
 $^3$
, a viscosity
 ${\mu} _{\! {f}}=$
2.6 mPa s, a specific heat capacity
 $C_{p, {f}} = 3.3$
kJ (kg K–1) and a thermal conductivity
 $\lambda _{\! {f}} =$
0.55 W mK–1. All the liquid properties are summarised in the Appendix and the variation of the properties with temperature is discussed in the supplementary materials of Berry et al. (Reference Berry, Josserand, Salonen and Boulogne2024).
The drops are produced with a syringe pump, out of an 18G needle, which provides a drop diameter of
 $2r_0 = 2.70 \pm 0.04$
mm, measured by image analysis. A drop is released at an initial height
 $h_0$
ranging from 5 cm to 50 cm, and the impact velocity is calculated as
 $v_0 = \sqrt {2g h_0}$
where
 $g$
is standard gravity.
The solid surface below the liquid film is a 4 mm thick glass slide on top of a silicon wafer. The glass slide has similar thermal properties as the salt solution and is therefore used to ensure some thermal continuity. The optical reflectivity of the wafer enhances the visualisation. The wafer and the glass slide are placed in an aluminium Petri dish and covered with the salt solution. We measured the film thickness with an optical device (Chromapoint, STIL). We choose to work with a film thickness of
 $h_{\! {f}} = 0.27 \pm 0.02$
mm, which gives a dimensionless liquid thickness
 $H = h_{\! {f}} /( 2 r_0) = 0.1$
. For such dimensionless thickness, the bath is defined as a liquid film in the literature (Cossali, Coghe & Marengo Reference Cossali, Coghe and Marengo1997; Tropea & Marengo Reference Tropea and Marengo1999; Vander Wal et al. Reference Vander Wal, Berger and Mozes2006a
; Motzkus, Gensdarmes & Géhin Reference Motzkus, Gensdarmes and Géhin2009).
The cooling system is composed of a Peltier module (Adaptive, RS) rated at 340 W. The heat exchange between the Peltier module and the Petri dish is ensured by a homemade receptacle of copper covering the bottom and the perimeter of the Petri dish. On the other side of the Peltier module, heat is extracted by a heat sink (Laird Technologies) in which a refrigerant liquid circulates at a temperature of
 $1\,^\circ {\textrm{C}}$
by a refrigerated bath (VWR, AP15R-40).
The scene is illuminated with an LED panel (HSC Backlight, Phlox) positioned at
 $45^\circ$
pointing toward the liquid film in front of a high-speed camera. The high-speed camera (FASTCAM Nova S9 1024
 $\times$
1024 px, Photron) records at 6000 f.p.s. from a 3/4 point of view to measure the projected radius over time
 $r(t)$
, to count the number of crystals
 $N_{ {c}}$
and to estimate the time
 $t_{ \textit{layer}}$
to form a frozen layer. We obtain a resolution of 48 pixels mm–1, which is the limiting factor in our experiments. Nevertheless, as we will show in the next section, this resolution is sufficient to identify the crystals, typically 1 or 2 ms after the impact.
The temperature at the interface
 $T_{ {c}}$
is constant in the case of two semi-infinite media and is given by Boeker & Grondelle (Reference Boeker and Grondelle2011):
 \begin{equation} T_{ {c}} = \frac {T_{ {d}} + T_{\! {f}} (e_{\! {f}}/e_{ {d}})}{1+(e_{\! {f}}/e_{ {d}})}, \end{equation}
where we used the effusivity
 $e_i = \sqrt {\lambda _i ho _i C_{p,i}} = \lambda _i/\sqrt {D_i}$
with
 $i = {d}, {f}$
. The hypothesis of a semi-infinite phase for the drop is correct for time scales smaller than the heat diffusion time scale, which is of the order of magnitude of a second for our typical length scale, whereas the time scale of impact is tens of milliseconds. Therefore, we will characterise the thermal shock by
 $\Delta T_{ \textit{mc}} = T_{ {m}} - T_{ {c}}$
(Berry et al. Reference Berry, Josserand, Salonen and Boulogne2024).
2.2. Observations
(a) Time series showing a hexadecane drop impinging a liquid bath at a velocity
 $v_0$
= 2.8 m s–1 for two different thermal shocks
 $\Delta T_{ \textit{mc}} =\{8, 12.5\}\,^\circ {\textrm{C}}$
. Time evolution of the experimental measurements of (b) the area covered by crystals and (c) the number of crystals, associated with the time series presented in (a) with light blue for
 $\Delta T_{ \textit{mc}} =8\,^\circ {\textrm{C}}$
and dark blue for
 $\Delta T_{ \textit{mc}} =12.5\,^\circ {\textrm{C}}$
. The associated movies are provided in the supplementary material available at https://doi.org/10.1017/jfm.2025.10508, with an overlay of the crystals’ outlines used for measurements. The inset of (c) shows the final number of crystals for different thermal shocks at
 $v_0$
= 2.8 m s–1.

Figure 1(a) shows typical experiments at a fixed impact velocity
 $v_0$
= 2.8 m s–1 for two different thermal shocks. Upon impact, the drop forms a liquid crown analogous to Edgerton’s observations (Edgerton Reference Edgerton1954). Additionally, we notice grey clusters that we attribute to crystals appearing at the drop–film interface (Berry et al. Reference Berry, Josserand, Salonen and Boulogne2024). In time, these crystals grow and additional crystals appear as the drop expands radially. The time series also show that for a cooler film, i.e. a larger thermal shock
 $\Delta T_{ \textit{mc}}$
, fewer crystals are observed, which is counterintuitive since lower temperatures should enhance crystal nucleation!
To verify this observation, we repeated these experiments at different thermal shocks
 $\Delta T_{ \textit{mc}} = \{8, 11.2, 12.5, 14.5\}\,^\circ {\textrm{C}}$
, for which we measured the surface area of the crystals and counted the number of crystals. The number of crystals and their area are measured by manually drawing their outline on the images with the software ImageJ. We cannot obtain measurements before 0.5 ms due to the limited resolution of the camera, and curvature of the drop that causes shadows and optically enlarges the surfaces. Additionally, near the end of the coverage, it becomes difficult to identify individual crystals because they are very close to one another. Therefore, as the boundary between crystals is not clear enough, we stop measuring the covered surface before the number of crystals.
These measurements are reported in figures 1(b) and 1(c), where we plot, for two different thermal shocks, the time evolution of the surface area covered by the crystals
 $S_c$
and the number of crystals
 $N_c$
, respectively. For the sake of clarity, error bars are not plotted on these curves but we note that uncertainty for
 $S_{ {c}}$
and
 $N_{ {c}}$
would be of 10 % on each data point. We observe that increasing the thermal shock (dark blue points) leads to faster dynamics. In the inset of figure 1(c), more measurements of the final number of crystals are given, highlighting a decrease with thermal shock. For larger thermal shocks, crystals would appear earlier and grow faster, leading to the observation of fewer crystals. The purpose of the next section is to establish a model able to render these experimental findings and particularly to explain more quantitatively why the cooler the liquid, the fewer the number of crystals nucleated.
3. Model
3.1. Dynamics of contact opening
In this section, we describe the impact of a drop on the liquid film in terms of contact surface area and time scale to reach maximum opening. Classically, drop impact on thin films can be characterised by a combination of Reynolds and Weber numbers (Cossali et al. Reference Cossali, Coghe and Marengo1997; Weiss & Yarin Reference Weiss and Yarin1999; Vander Wal et al. Reference Vander Wal, Berger and Mozes2006b
; Roisman, van Hinsberg & Tropea Reference Roisman, van Hinsberg and Tropea2008; Chen, Chen & Amirfazli Reference Chen, Chen and Amirfazli2017). The Reynolds number is defined as
 ${\textit{Re}} = 2{ho _{ {d}} v_0 r_0}/{{\mu} _{ {d}}}$
, with
 ${\mu} _{ {d}}$
the viscosity of the drop, and varies between 936 and 1872 in this study. The Weber number is defined as
 ${\textit{We}} = 2 ho _{ {d}} v_0^2 r_0 / \gamma _{ {d}}$
, with
 $\gamma _{ {d}}$
the surface tension of the drop, and varies between 145 and 578 in this study.
(a) Time evolution of the drop contact area
 $S_{ {d}}(t) = \unicode{x03C0} r(t)^2$
upon impact on a liquid film, for different substrate temperatures and impact velocities. Each scatter curve represents one experiment and the black line represents (3.1). (b) Maximum contact area between the drop and the film and (c) time to reach the maximum surface as a function of the impact velocity, with each point representing an experiment. The different markers correspond to impact velocity. The descriptions of Roisman et al. (Reference Roisman, van Hinsberg and Tropea2008) adapted for thin films are plotted by solid black lines.

We measured through image analysis the dynamics of the surface area
 $S_{ {d}}(t)$
that corresponds to the contact between the drop and the liquid film as illustrated in figure 2(a). During the opening phase of contact,
 $S_{ {d}}(t)$
grows linearly at short times, which agrees with the literature (Weiss & Yarin Reference Weiss and Yarin1999; Roisman et al. Reference Roisman, van Hinsberg and Tropea2008) and quadratically to saturation, as shown in figure 2(a). For a more accurate description of the whole dynamic until the extension reaches the maximum surface area
 $ S_{ {m}}$
at a corresponding impact time of
 $\tau _{ {m}}$
, we choose to write the surface area of contact as

which is valid for
 $t \lt \tau _{ {m}}$
.
Roisman et al. (Reference Roisman, van Hinsberg and Tropea2008) proposed a description for the crown radius on miscible liquid films
 $H \in$
[0.5, 2], which is also used on immiscible liquid films
 $H \in$
[0.1, 0.5] by Bernard et al. (Reference Bernard, Baumgartner, Brenn, Planchette, Weigand and Lamanna2021). For simplicity, we choose to adapt their expressions for
 $H ightarrow$
0, which gives dimensionless expressions as
 \begin{align} {S_{ {m}}} / \big(\unicode{x03C0} r_0^2\big) &\sim \, \big(\beta \sqrt {H}/2\big)^2 {\textit{We}}, \end{align}
 \begin{align} \tau _{ {m}} \frac {v_0}{2 r_0} &\sim \, (\beta {H}/6) {\textit{We}}, \end{align}
where
 $\beta \sim H^{-1/3}$
. Since we only vary the impact velocity, we have
 ${S_{ {m}}} \propto v_0^2$
and
 ${\tau _{ {m}}}\propto v_0$
, which is compared with our data in figure 2(b,c). This description is acceptable although the slope against velocity is slightly overestimated, which is not caused by the approximation
 $Hightarrow 0$
.
3.2. Crystal growth velocity
Crystal growth can be assumed to be limited by the reaction at the crystal–melt interface (Kirkpatrick Reference Kirkpatrick1975). To pass from the melt to the crystal, a molecule must go through an activated state before releasing energy. The free-energy difference between the melt and the activated state is denoted
 $\Delta G'$
and between the melt and the crystal
 $\Delta G_{ {c}}$
. We define a constant rate
 $\alpha$
, equivalent to a diffusion coefficient for transport across the melt–crystal interface, which is defined with the Stokes–Einstein relation as
 $\alpha = RT_{ {c}} / (3\unicode{x03C0} \mathcal{N}_a a_0 {\mu} _{ {d}})$
with
 $a_0$
the intermolecular distance,
 $R$
the gas constant and
 $ \mathcal{N}_a$
the Avogadro number (Kirkpatrick Reference Kirkpatrick1975). Based on the reaction-rate theory, the crystal growth velocity writes

By assuming that entropy and enthalpy differences are independent of temperature,
 $\Delta G_{ {c}}$
can be approximated as
 $M_{ {d}} {\mathcal{L}} \Delta T_{ \textit{mc}} /T_{ {m}}$
(Wagstaff Reference Wagstaff1968) with
 $M_{ {d}}$
the molar mass of the liquid. The small undercooling approximation (
 $\Delta G_{ {c}} \ll RT_{ {c}}$
) is often used to linearise the crystal growth velocity as
 \begin{equation} v_{ {c}} \simeq \kappa \Delta T_{ \textit{mc}}, \end{equation}
in which we introduce the kinetic undercooling coefficient
 $\kappa = M_{ {d}} {\mathcal{L}} / (3\unicode{x03C0} a_0^2 {\mu} _{ {d}} \mathcal{N}_a T_{ {m}})$
. We note that both expressions of crystal growth do not depend on the problem geometry and are valid for two- and three-dimensional growth (Kant et al. Reference Kant, Koldeweij, Harth, van Limbeek and Lohse2020). The mean free path in a liquid is assumed to be of the same order of magnitude as the intermolecular distance. Therefore,
 $a_0 \sim (M_{ {d}} /( ho _{ {d}} \mathcal{N}_a))^{1/3} \simeq 8 \times 10^{-10}$
m. The theoretical value of
 $\kappa$
from (3.4) gives
 $ 1.3 \times 10^{-2}$
(m s–1) K–1.
Additionally, de Ruiter et al. (Reference de Ruiter, Colinet, Brunet, Snoeijer and Gelderblom2017) and Koldeweij et al. (Reference Koldeweij, Kant, Harth, de Ruiter, Gelderblom, Snoeijer, Lohse and van Limbeek2021) studied crystal growth in hexadecane on solid substrates and they measured experimental values for
 $\kappa$
of
 $1.1 \times 10^{-2}$
and
 $ 0.45 \times 10^{-2}$
(m s–1) K–1, respectively. In a previous study on alkanes solidifying on a liquid substrate (Berry et al. Reference Berry, Josserand, Salonen and Boulogne2024), the value was measured at
 $0.6 \times 10^{-2}$
(m s–1) K–1. In the present study, the coefficient can be determined experimentally from the images as shown in figure 3(a) by measuring directly the growth velocity of individual crystals. In figure 3(b), we plot these measurements, each point representing a mean value of multiple crystals growing in one experiment, and a linear fit provides
 $\kappa = (0.65 \pm 0.20) \times 10^{-2}$
(m s–1) K–1.
While this small undercooling approximation operates at the boundary of its conventional validity range, it still provides meaningful insights. The expression of
 $v_{ {c}}$
will not be replaced in the rest of the model and the approximation will mainly be used to study the relation between the thermal shock and the number of crystals during the discussion, keeping in mind that the order of magnitude of
 $\kappa$
is
 $10^{-2}$
(m s–1) K–1 and that the crystal growth rate
 $v_{ {c}}$
is proportional to thermal shock
 $\Delta T_{ \textit{mc}}$
.
(a) Time series illustrating the evolution and measurements of the crystals for
 $\Delta T_{ \textit{mc}}=11\,^\circ {\textrm{C}}$
. The edges of the crystals are indicated by a thin white line and some crystals are coloured for clarity. (b) Crystal growth velocity as a function of
 $\Delta T_{ \textit{mc}}$
. Each point represents the mean number of individual crystals growing in one experiment, as highlighted on (a). The black dashed line is a fit, giving
 $\kappa = (0.65 \pm 0.20) \times 10^{-2}$
(m s–1) K–1. The grey area indicates the effect of the uncertainty on
 $\kappa$
.

3.3. Number and surface area covered by crystals
The increase of the number of crystals over a duration
 ${\textrm {d}}t$
is assumed to be proportional to a nucleation rate
 $\dot n$
, which has the dimension of number of molecules per unit area per time, and to the available surface area
 $S_{ {d}}(t) - S_{ {c}}(t)$
, such that

The nucleation rate
 $\dot {n}$
is related to the number of crystals that develop beyond a critical size to become stable and is written as

with
 $A$
the attempt frequency per unit area and the nucleation activation energy
 $E_{{n}} = (16\unicode{x03C0} /3) \sigma _{ls}^3f(\theta ) \mathcal{N}_a / \Delta G_{ {c}}^2$
(Mullin Reference Mullin2001; Koldeweij et al. Reference Koldeweij, Kant, Harth, de Ruiter, Gelderblom, Snoeijer, Lohse and van Limbeek2021). We note that
 $f(\theta )$
is a function of the contact angle between the solid crystal and the substrate, and is accounting for heterogeneous nucleation in homogeneous activation energy
 $E_{hom}$
as
 $E_{n} = f(\theta) E_{hom}$
, i.e. a value of
 $f(\theta )$
close to one in an undercooled liquid is equivalent to homogeneous nucleation whereas a small value of
 $f(\theta )$
is associated with heterogeneous nucleation near the substrate (Mullin Reference Mullin2001). In our approach, we consider heterogeneous nucleation in the drop because the crystals appear on the interface due to the temperature gradient growing as a diffusive process in the drop. The temperature gradient perpendicular to the interface, induced by the cold substrate, dominates over the much more localised in-plane gradient near growing crystals. Consequently, we model nucleation as spatially uniform over the available surface, treating crystals as independent entities. This simplification may lead to an overestimation of the nucleation rate, particularly during the final stages of surface coverage.
We introduce the surface area
 $\sigma (t,t_0)$
of a single crystal, at a time
 $t$
, that appeared at
 $t_0\leqslant t$
:
 \begin{equation} \sigma (t,t_0) = \unicode{x03C0} v_{ {c}}^2 (t-t_0)^2, \end{equation}
where the crystal growth velocity is given by (3.4). The surface area
 $S_{ {c}}(t)$
covered by crystals is the result of the time evolution of each germ, described by (3.7), which appeared at a rate
 ${\textrm {d}}N_{ {c}}(t')$
:
 \begin{equation} S_{ {c}}(t) = \int ^{N_{ {c}}(t)}_{N_{ {c}}(t'=0)} \sigma (t,t') \, {\textrm {d}}N_{ {c}}(t'). \end{equation}
This covered surface area grows until it reaches the surface area of the drop at a time
 $t_{ \textit{end}}$
, i.e.
 $S_{ {c}}(t_{ \textit{end}}) = S_{ {d}}(t_{ \textit{end}})$
.
3.4. Dimensionless equations
To obtain dimensionless equations, we introduce the dimensionless time
 $\overline {t} = t/\tau _{ {m}}$
, the dimensionless surface
 $\overline {S_i} = S_i / S_{ {m}}$
, where
 $i=\{{ {c}}, {{d}}\}$
. Thus, (3.1) becomes
 $\overline {S_{ {d}}}(\overline {t}) = 1 - ( \overline {t} - 1 )^2$
for
 $\overline {t}\lt 1$
. We then obtain the dimensionless form of (3.5) on the number of crystals:
 \begin{equation} {\textrm {d}}\overline {N_{ {c}}}(\overline {t}) = \big(1 - \big( \overline {t} - 1 \big)^2 - \overline {S_{ {c}}}(\overline {t})\big) {\textrm {d}}\overline {t}, \end{equation}
with the dimensionless number of crystals written as
 $\overline {N_{ {c}}} = N_{ {c}} / N_{ {m}}$
, with
 $N_{ {m}} = \dot {n} \tau _{ {m}} S_{ {m}}$
.
With (3.8) on the surface area covered by crystals, we have
 \begin{equation} \overline {S_{ {c}}}(\overline {t}) = \chi ^3 \int ^{\overline {t}}_{0} (\overline {t}-\overline {t}')^2 \big( 1 - \big( \overline {t}' - 1 \big)^2 - \overline {S_{ {c}}}(\overline {t}')\big) {\textrm {d}}\overline {t}', \end{equation}
with
 $\chi ^3 = \dot {n} \tau _{ {m}} \unicode{x03C0} v_c^2 \tau _{ {m}}^2$
. The parameter
 $\chi ^3$
is the nucleation rate multiplied by impact time and by
 $\unicode{x03C0} v_c^2 \tau _{ {m}}^2$
, which is the surface covered by one crystal that grew between
 $t=0$
and
 $\tau _{ {m}}$
.
To obtain (3.9) and (3.10) in a form more appropriate for a numerical resolution, we use the Leibniz integral rule, which gives
 \begin{align} \frac {{\textrm {d}}\overline {S_{ {c}}}}{{\textrm {d}}\overline {t}} &= 2 \chi ^3 \int ^{\overline {t}}_{0} (\overline {t}-\overline {t}') \big( 1 - \big( \overline {t}' - 1 \big)^2 - \overline {S_{ {c}}}(\overline {t}')\big) {\textrm {d}}\overline {t}', \end{align}
 \begin{align} \frac {{\textrm {d}}\overline {N_{ {c}}}}{{\textrm {d}}\overline {t}} &= 1 - \big( \overline {t} - 1 \big)^2 - \overline {S_{ {c}}}(\overline {t}) . \end{align}
These equations are complemented by the initial condition
 $\overline {S_{ {c}}}(0) = \overline {N_{ {c}}}(0) = 0$
. With (3.1), the end condition
 $S_{ {c}}(t_{ \textit{end}}) = S_{ {d}}(t_{ \textit{end}})$
reads
 \begin{equation} \overline {S_{ {c}}}(\overline {t}_{ \textit{end}}) = 1 - \big(\overline {t}_{ \textit{end}} - 1\big)^2 \qquad {\textrm {with}}\quad \overline {t}_{ \textit{end}}\lt 1. \end{equation}
If
 $\overline {t}_{ \textit{end}} \gt 1$
, crystals have not covered the drop during the opening phase of the impact and the model ceased to be valid due to the description adopted for the hydrodynamics.
In the next section, we solve these equations, discuss the results of the model, and compare the predictions with the experimental measurements.
Variation of the solutions of (3.11) with
 $\chi$
. (a) Dynamics of the surface area covered by the crystals. The black line represents the dimensionless evolution of the contact area. (b) Time evolution of the number of crystals.

4. Discussion
4.1. Numerical solution and effect of the physical parameters
Now, we solve numerically the differential equations (3.11) with the library scipy in Python until the condition (3.12) is satisfied. In figure 4, we plot the dimensionless surface covered by crystals and the dimensionless number of crystals as a function of time.
Both
 $S_{ {c}}$
and
 $N_{ {c}}$
increase, which is expected as the only mechanism taken into account is the apparition of crystals. The black line represents the surface area of the drop. The surface covered increases slowly in the beginning, as there are only a few crystals at first, but with more and more crystals appearing, the surface covered increases faster until it reaches the contact area. The curve for the number of crystals makes an S-shape. At first, the production rate of crystals increases as more surface becomes available with the impact deformation, then the growing crystals start to cover a significant part of the surface, which limits the production rate. The inflection point corresponds to the maximum of
 $S_{ {d}}(t) - S_{ {c}}(t)$
in (3.5).
We note that the dimensionless number of crystals is defined as
 $\overline {N_{ {c}}} = N_{ {c}} / N_{ {m}}$
, with
 $N_{ {m}} = \dot {n} \tau _{ {m}} S_{ {m}}$
(3.9). The number
 $N_{ {m}}$
is the number of crystals that could be created at a nucleation rate
 $\dot {n}$
during the impact time
 $\tau _{ {m}}$
if the entire maximum surface
 $S_{ {m}}$
was available during that time. It is an overestimation of the number of crystals which explains why the final dimensionless number of crystals
 $\overline {N_{ {c}}}(\overline {t}_{ \textit{end}})$
, in the inset of figure 4(b), does not reach 1.
The parameter
 $\chi$
is introduced in (3.10) as
 $\chi ^3 = \dot {n}\tau _{ {m}} \unicode{x03C0} v_{ {c}}^2 \tau _{ {m}}^2$
. Considering the expression of
 $\tau _{ {m}}$
(3.2b
),
 $\chi$
varies linearly with
 $v_0$
. The growth rate
 $v_{ {c}}$
is assumed to be linear with
 $\Delta T_{ \textit{mc}}$
(3.4) and the nucleation rate
 $\dot {n}$
also increases with the thermal shock (3.6). A larger thermal shock leads to faster crystal growth, meaning that the area covered by crystals reaches the drop area much faster and fewer crystals have time and space to appear. This is consistent with the trend observed in experiments, where large thermal shock leads to fewer crystals.
Qualitatively, this model describes well the behaviour observed experimentally and presented in figure 1. In the next section, we compare more precisely the data and the model.
4.2. Comparison with the experiments
We are now in a position to compare the predictions of the model with the experimental results. The different parameters in the model are
 $S_{ {m}}$
,
 $\tau _{ {m}}$
and
 $N_{ {m}}$
. The first two parameters are solely linked to hydrodynamics. Their values are taken directly from each experiment to compute each data point in a dimensionless form in figure 5. The third parameter
 $N_{ {m}}$
depends on the kinetic coefficient
 $\kappa$
and the nucleation rate
 $\dot {n}$
.
Dimensionless curves for (a) the surface area and (b) the number of crystals with experimental measurements as symbols and numerical solutions as lines. The inset in (a) shows the dimensionless time to get full coverage as a function of
 $\chi$
and the inset in (b) is for the final number of crystals. Black curves represent the model. The markers indicate impact velocity of
 $v_0 = 2.8$
m s–1 (circle),
 $v_0 = 2.0$
m s–1 (square) and
 $v_0 ={} 1.4$
m s–1 (downward triangle).

We adjust these two parameters to minimise the difference between experiments and numerical solution for the final number of crystals
 $\overline {N_{ {c}}} (\overline {t}_{ \textit{end}})$
. Even if we do not measure the number of crystals right to the end,
 $\overline {N_{ {c}}}$
plateaus (figure 5
b), which means that the measured value is close to the final number of crystals. The dimensionless dynamics of both the model and the data are given in figure 5. The quality of the fit is given in the inset of figure 5(b), as a function of
 $\chi$
. This inset also shows how the final number of crystals varies with
 $\chi$
, therefore with thermal shock and impact velocity. We first discuss how the experimental dynamics compare to the model, and we then address the values obtained through the fit.
The dynamics of both
 $\overline {S_{ {c}}}$
and
 $\overline {N_{ {c}}}$
are captured reasonably well by the model. Regarding the covered surface, the model underestimates the first measurements of the bright green points, which correspond to the largest thermal shock. On the corresponding videos, we observe generally one or two crystals appearing almost immediately near the centre of the drop, which might have been created due to a defect or a singularity point when the contact between the drop and the substrate is made and is therefore not captured by the model. The number of crystals seems to be better described by the model than the covered surface is, with the S-shape behaviour reasonably well captured.
The nucleation rate
 $\dot {n}$
is adjusted with
 $f(\theta )$
in the energy activation and
 $A$
the exponential prefactor. The value of
 $f(\theta ) = 0.01$
seems to indicate that the nucleation is on the interface rather than in the bulk, which agrees with our assumptions Mullin (Reference Mullin2001). The prefactor
 $A = 3 \times 10^9$
m
 $^{-2}$
s
 $^{-1}$
is reasonable given the typical rate of crystal appearance. In our range of thermal shock, the exponential value in the nucleation rate expression is in [0.65–0.85] and increases almost linearly with the thermal shock, which suggests
 $\chi ^3 \sim \dot {n}v_{ {c}}^2 \tau _{ {m}}^3 \propto \Delta T_{ \textit{mc}}^3$
.
The value of
 $\kappa$
obtained through the fit,
 $1.2 \times 10^{-2}$
(m s–1) K–1, is of the same order of magnitude as the values previously obtained in the literature, which means that our model is consistent. However, this value is different by a factor of two from the value measured through direct measurements (figure 3). The assumption of the absence of crystals overlapping or mutual interaction in the model is not explaining this difference. A possible explanation would be that the equations for
 $v_{ {c}}$
and
 $\dot {n}$
are not perfectly describing the system. Since the solution comes from an integro-differential equation, errors tend to accumulate. This explanation would be supported by the disagreement observed on
 $\overline {S_{ {c}}}$
at short times. However, the lack of measurements at that moment prevents us to precisely identify the origin and to refine the model.
Nevertheless, the temperature dependence of the number of crystals is confirmed both qualitatively and quantitatively with the model, which is already satisfactory.
5. Conclusion
We investigated the nucleation of crystals at an interface, more specifically in the case of an alkane drop impacting a cold thin liquid substrate. Through high-speed imagery and direct measurements, we observed the crystals and their evolution, noticing a dependence with the thermal shock
 $\Delta T_{ \textit{mc}}$
defined with the contact temperature. We developed a model based on crystal growth appearing on the available surface area. This area evolves in time by the competing effects of the drop spreading upon impact and the surface coverage of crystals growing at a velocity
 $v_{ {c}} = \kappa \Delta T_{ \textit{mc}}$
. The numerical solution captures well the observed behaviour over time for both the covered area and the number of crystals. Furthermore, we were able to quantitatively compare the model with measurements with two fitting parameters
 $\kappa$
and
 $\dot {n}$
. We note that in this study
 $\kappa$
, the kinetic coefficient of crystal growth rate, is comparable to previous studies. We can thus successfully describe crystal formation on liquid interfaces following a drop impact and we can explain the variation of the number of crystals with the thermal shock.
These results rationalise the formation of the solid layer between the drop and the bath, which is responsible for the final morphology of the drop (Berry et al. Reference Berry, Josserand, Salonen and Boulogne2024). In future work, it will be interesting to consider more complex systems, such as the crystallisation of surfactant by salt where the two liquids are miscible, prone to Marangoni effects, and with a solidification process driven by a solubility threshold (Kharlamova et al. Reference Kharlamova, Boulogne, Fontaine, Rouzière, Hemmerle, Goldmann and Salonen2024).
Supplementary movies
Supplementary movies are available at https://doi.org/10.1017/jfm.2025.10508.
Acknowledgements
We thank V. Thiévenaz for suggesting the apparatus for the film-thickness measurement.
Funding
This work received a financial support by Investissements d’Avenir, LabEx PALM (ANR-10-LABX-0039-PALM).
Declaration of interests
The authors report no conflict of interest.
Appendix. Properties
Physical properties used in the present study for hexadecane taken from Yaws (Reference Yaws1999), Kulkarni et al. (Reference Kulkarni, Tamvada, Shirdade, Saneie, Lolla, Batheyrameshbapu and Anand2024), Berry et al. (Reference Berry, Josserand, Salonen and Boulogne2024), and NaCl 23.3 %wt. brine taken from Chen (Reference Chen1982), Abdulagatov & Magomedov (Reference Abdulagatov and Magomedov1994), Ramalingam & Arumugam (Reference Ramalingam and Arumugam2012), Aleksandrov, Dzhuraeva & Utenkov (Reference Aleksandrov, Dzhuraeva and Utenkov2013). The alkane properties are taken at
 $T_{ {d}} = 20\,^{\circ }$
C, except the solid properties taken at their respective melting temperatures
 $T_{ {m}}$
. The NaCl brine properties are taken at a mean temperature of approximately
 $0^{\;\circ }$
C.