Introduction
With the rapid development of the Internet of things and health monitoring technologies, wearable devices have found increasing applications in medical health [Reference Messatfa, Berhab and Chebbara1]. By integrating sensors and wireless communication, wearable devices enable real-time monitoring and transmission of human health parameters such as heart rate, blood oxygen, and blood pressure [Reference Jiang, Gregory and Werner2]. As a key component for data transmission, the antenna directly affects system reliability and functionality. However, traditional rigid antennas lack flexibility, cannot conform to the human body, and experience severe performance degradation when bent [Reference Psychoudakis and Volakis3]. Flexible antennas, due to their light weight, softness, and bendability [Reference Song and Rahmat-Samii4], can closely fit the body and maintain stable signal transmission, showing clear advantages for health monitoring. Common flexible materials include denim [Reference Ashyap, Abidin, Dahlan, Majid, Shah, Kamarudin and Alomainy5, Reference Singh and Verma6], felt [Reference Mersani, Osman and Ribero7], and polymers [Reference Saeed, Ejaz, Shahid, Amin and Tenhunen8], which offer good flexibility and comfort. Wearable communication mainly involves body-surface, in-body, and off-body types [Reference Kavitha and Swaminathan9], among which off-body communication is most common, such as between wearable devices and smartphones or cloud platforms.
To enhance signal quality and reduce electromagnetic interaction with the body, electromagnetic bandgap (EBG) structures are widely introduced into antenna designs. The EBG structure suppresses surface waves and back radiation [Reference Abdulhameed, Isa, Zakaria, Ibrahim, Mohsen, Attiah and Dinar10], improving radiation efficiency and reducing the specific absorption rate (SAR). Integrating the EBG structure into the antenna not only enhances gain and reduces SAR but also maintains stable electromagnetic properties on flexible substrates, making it particularly suitable for wearable antenna applications [Reference Messatfa, Berhab and Chebbara1]. Ahmad et al. [Reference Ahmad, Faisal, Ullah and Choi11] designed three dual-band wearable patch antennas, where mushroom-type and cross-slot EBGs increased gain and bandwidth while maintaining SAR below 2 W/kg. Lago et al. [Reference Lago, Soh, Jamlos, Shohaimi, Yan and Vandenbosch12] proposed a full-fabric Artificial Magnetic Conductor (AMC)-integrated antenna for Wireless Local Area Network (WLAN)/Wireless Body Area Network (WBAN), achieving effective back radiation suppression and strong body conformability. Nie et al. [Reference Nie, Xuan, Shi, Guo, Li, Li and Ren13] demonstrated that introducing an EBG array increased antenna gain from 2.46 to 6.75 dBi and reduced SAR by 90%.
Multiband antennas allow operation across multiple frequencies while maintaining compactness. Le and Yun [Reference Le and Yun14] presented a dual-band folded ring antenna (2.45/3.45 GHz) with directional radiation and low SAR. Le et al. [Reference Le, Kim and Yun15] designed a tri-band open-loop antenna (2.45/3.0/3.45 GHz) with high gain and efficiency but used rigid substrates. Yang et al. [Reference Yang, Yu, Yang and Zhao16] introduced a Coplanar Waveguide (CPW)-fed tri-band wearable antenna that improved gain and reduced SAR, showing good robustness. Beyond discrete multiband designs, wearable Ultra-Wideband (UWB) antennas provide broadband coverage with band-notched and EBG techniques for interference suppression. Textile-based fractal UWB monopoles achieve multi-band notches via split-ring resonators, parasitic elements, and slits [Reference Bhattacharya, De, Roy and Bhattacharjee17], while filter-backed UWB monopoles with EBG and microstrip bandpass sections enhance frequency selectivity and out-of-band suppression [Reference Bhattacharya, De, Roy and Bhattacharjee18]. These strategies improve impedance matching, reduce body-coupling effects, and enable robust, reliable wearable UWB operation.
In this work, a novel tri-band flexible wearable monopole antenna integrated with an EBG structure is proposed. Using polydimethylsiloxane (PDMS) as the substrate, the antenna operates at 2.45, 3.5, and 5.8 GHz, corresponding to Industrial, Scientific, and Medical (ISM) and Worldwide Interoperability for Microwave Access (WiMAX) bands. By incorporating a 4 × 4 EBG array, the antenna achieves enhanced gain and bandwidth while significantly reducing SAR, maintaining stable performance under bending and demonstrating strong potential for medical health monitoring applications.
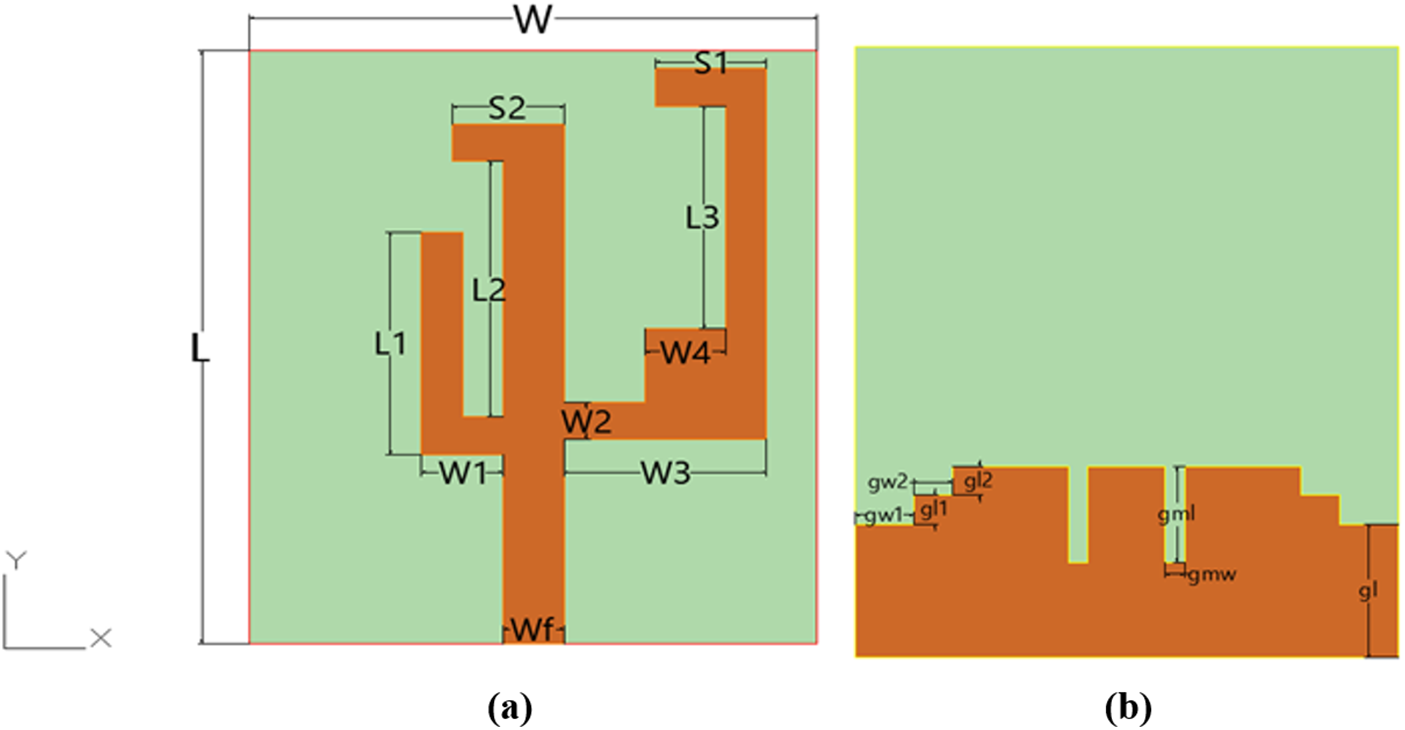
Antenna structure. (a) Front view. (b) Rear view.

Figure 1 Long description
The image consists of two parts labeled as (a) and (b). In part (a), the front view of a tri-band monopole antenna is depicted. The antenna features a microstrip-fed configuration with three asymmetrically arranged vertical branches. These branches are labeled L1, L2 and L3, each with distinct lengths and widths, contributing to the generation of three resonant modes. The branches are connected to a narrow feedline labeled Wf, which excites them. A short horizontal tuning strip labeled S1 is attached to the right branch, allowing for precise adjustment of its effective electrical length. Additional labels include W1, W2, W3, W4, S2 and S3, indicating various dimensions and positions of the branches and strips. In part (b), the rear view of the antenna is shown, highlighting the ground plane. This plane includes irregular slits and grooves, labeled g1, g2, g3 and g4, which modify the equivalent electrical length and tailor surface current distribution. These features enhance matching, boost radiation efficiency and suppress higher-order modes, thereby increasing gain. The ground plane’s innovative design is crucial for the antenna’s performance.
Design of a tri-band monopole antenna
The proposed novel tri-band monopole antenna, shown in Fig. 1, introduces a compact microstrip-fed configuration optimized for flexibility and multi-band operation. A narrow feedline excites three asymmetrically arranged vertical branches whose distinct lengths and widths generate three well-separated resonant modes. A short horizontal tuning strip attached to the right branch precisely adjusts its effective electrical length, improving resonance control and impedance matching – distinguishing this design from conventional monopoles. The ground plane employs an innovative combination of irregular slits and grooves: the central slit modifies the equivalent electrical length for enhanced matching, while the side slots tailor surface current distribution to boost radiation efficiency and suppress higher-order modes, thereby increasing gain.
The antenna is fabricated on a 2 mm thick flexible PDMS (εᵣ = 2.7, tan δ = 0.001) substrate with compact dimensions of 32 × 28 × 2 mm3. The PDMS offers excellent mechanical flexibility for conformal applications while maintaining structural integrity, and its low dielectric loss minimizes electromagnetic absorption [Reference Sharma and Sharma19]. The antenna operates at 2.45, 3.5, and 5.8 GHz, corresponding to free-space wavelengths of 122, 85.7, and 51.7 mm, which are reduced to 74.25, 52.2, and 31.5 mm within the PDMS medium. Since electromagnetic waves propagate through both air and dielectric, the guided wavelengths fall between these values, confirming the rationality of the antenna dimensions and providing a theoretical basis for further optimization. In comparison with existing designs, this study presents an integrated design approach that combines asymmetric multi-branch excitation, irregular slit-loaded ground optimization, and flexible PDMS material implementation, achieving a compact structure, stable tri-band performance, and high radiation efficiency.
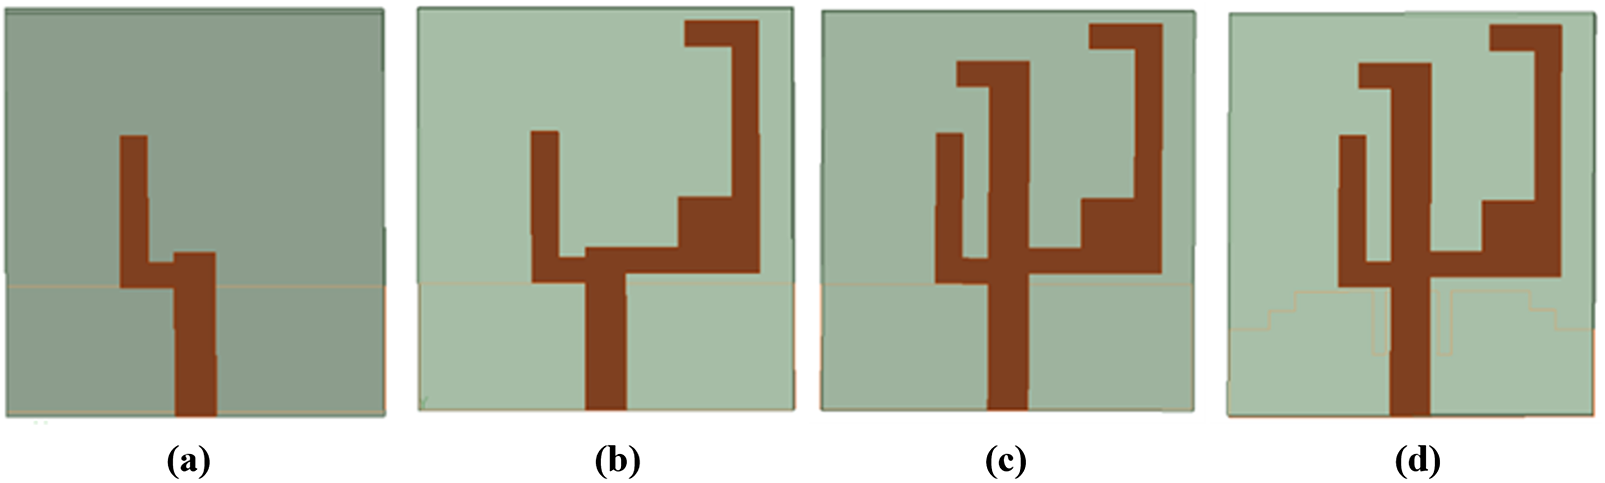
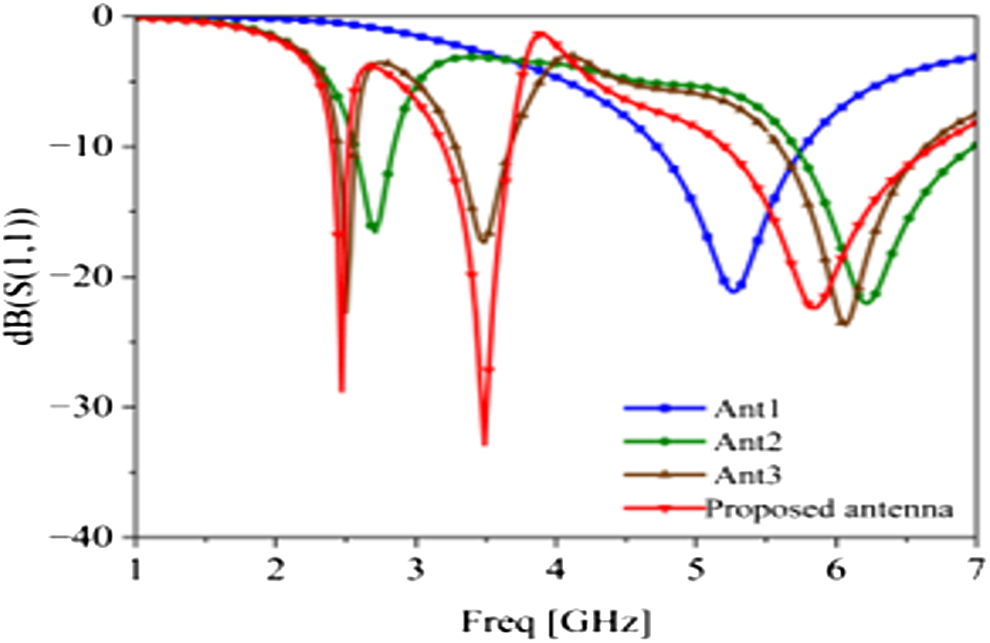
The evolution of the antenna is illustrated in Fig. 2. Antenna 1, the initial design, consists of a feedline and a short branch, resonating at 5.2 GHz as shown in Fig. 3. By introducing a longer right branch, Antenna 2 achieves dual bands at 2.56–2.84 GHz and 5.71–6.99 GHz. Antenna 3 further adds a middle branch, and the coupling among the three branches produces three resonances at 2.50, 3.50, and 6.07 GHz. Finally, the proposed antenna incorporates a defected ground structure (DGS) to fine-tune resonances and enhance impedance matching, covering 2.40–2.52 GHz, 3.20–3.67 GHz, and 5.20–6.70 GHz, with return losses of −28, −32, and −22 dB at 2.45, 3.5, and 5.8 GHz, respectively.
Evolution of the antenna. (a) Ant1. (b) Ant2. (c) Ant3. (d) Proposed antenna.

Reflection coefficients of the four antennas in the evolution process.

The surface current distributions are shown in Fig. 4. At 2.45 GHz (Fig. 4a), the current mainly flows along the middle and right vertical branches and the horizontal strip, indicating their contribution to low-frequency resonance. At 3.5 GHz (Fig. 4b), the current is concentrated on the middle and left branches, whose coupling produces the mid-frequency resonance. At 5.8 GHz (Fig. 4c), the left branch and horizontal strip dominate the high-frequency mode.
Surface current distribution of the antenna. (a) 2.45 GHz. (b) 3.5 GHz. (c) 5.8 GHz.

Figure 4 Long description
The image A showing a heatmap plot of surface current density magnitude on an antenna shape, labeled (a) with text 2.45 GHz below the plot. A vertical color scale is labeled Jsurf with unit A per m. The scale shows values from 0.069 at the bottom to 60.000 at the top, with intermediate labeled ticks 6.062, 12.055, 18.048, 24.041, 30.026, 36.026, 42.019, 48.012, 54.005. The antenna outline is a U shaped conductor with two outer vertical branches connected by a top horizontal strip, plus an inner vertical branch. A stepped base region is shown below the conductor. The highest intensity region is concentrated on the inner vertical branch and at the lower junction where the inner branch meets the lower part of the structure. Lower intensity regions extend along parts of the outer branches and into the stepped base region. The image B showing a heatmap plot of surface current density magnitude on the same antenna shape, labeled (b) with text 3.5 GHz below the plot. The same Jsurf color mapping is used. The strongest intensity forms a continuous band along the inner vertical branch, extending from the lower junction toward the top horizontal strip. Additional moderate intensity appears on one outer branch and around the lower junction. Lower intensity occupies the remaining conductor and the stepped base region. The image C showing a heatmap plot of surface current density magnitude on the same antenna shape, labeled (c) with text 5.8 GHz below the plot. The same Jsurf color mapping is used. The strongest intensity is concentrated at the lower junction region near the inner branch, forming a compact hotspot. Moderate intensity continues along the inner branch and appears on parts of an outer branch. Lower intensity fills the rest of the conductor and the stepped base region. Across (a), (b) and (c), the highest intensity region is present on the inner branch and lower junction area, with the most extended high intensity band in (b) and a more compact hotspot in (c).
The structural parameters of the antenna have a significant effect on its performance. To achieve better impedance matching, the key parameters were analyzed and optimized, as shown in Fig. 5. In Fig. 5(a), as the length L₁ increases, the resonant frequencies of the mid- and high-frequency bands shift downward, while the low-frequency resonance remains nearly unchanged. This behavior is consistent with the surface current distribution, as increasing L₁ extends the current path and increases the electrical length, thereby lowering the resonant frequency. Similarly, as L₂ increases, the resonant frequencies of the low- and mid-frequency bands decrease, with a more pronounced effect at the lower frequencies, as shown in Fig. 5(b). Variations in L₁ and L₂ cause only minor frequency shifts because the main resonances are primarily determined by the overall monopole and EBG structure, while L₁ and L₂ mainly fine-tune impedance matching without significantly altering the resonance positions. For optimal performance, L₁ and L₂ were set to 12 mm and 13 mm, respectively, to achieve the desired resonant frequencies.
Antenna reflection coefficient for different lengths of L 1 and L 2. (a) Reflection coefficient of L 1. (b) Reflection coefficient of L 2.

Figure 5 Long description
The image A showing a line graph with three curves and a legend listing three length settings. The x-axis label is Freq (gigahertz), ranging from 1 to 7 with tick marks at 1, 2, 3, 4, 5, 6 and 7. The y-axis label is abs of S subscript 11 (decibel), ranging from 0 to minus 50 with tick marks at 0, minus 10, minus 20, minus 30, minus 40 and minus 50. Each curve shows a deep dip near about 3 gigahertz, a peak near about 4 gigahertz close to 0 decibel and another dip near about 6 gigahertz. The curve labeled L1 equals 11.5 millimeter has a narrow dip near about 2 gigahertz reaching about minus 30 decibel. The image B showing a line graph with three curves and a legend listing three length settings. The x-axis label is Freq (gigahertz), ranging from 1 to 7 with tick marks at 1, 2, 3, 4, 5, 6 and 7. The y-axis label is abs of S subscript 11 (decibel), ranging from 0 to minus 50 with tick marks at 0, minus 10, minus 20, minus 30, minus 40 and minus 50. Each curve shows a deep dip near about 3 gigahertz, a peak near about 4 gigahertz close to 0 decibel and another dip near about 6 gigahertz.
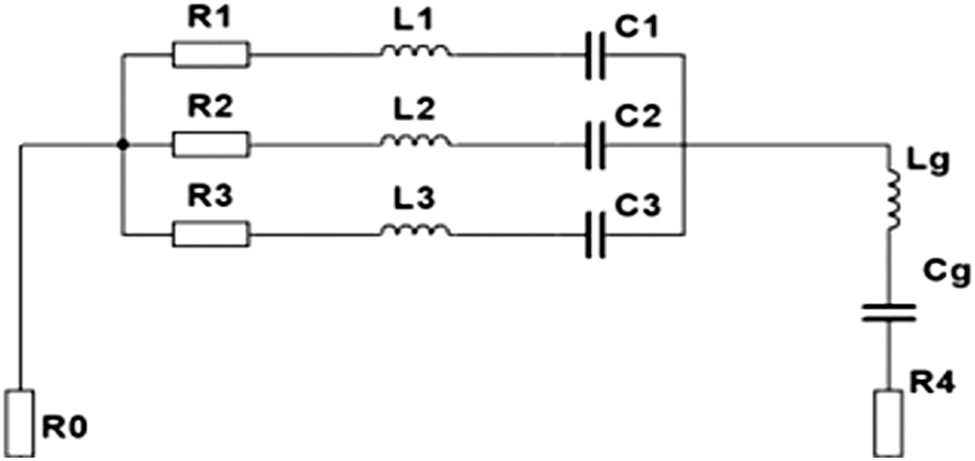
As shown in Fig. 6, according to transmission line theory, the three resonant branches at 2.45, 3.5, and 5.8 GHz can be modeled as series RLC circuits connected to the feed line. The DGS behaves as a high-impedance network represented by a series Lg–Cg circuit. As L₁ and L₂ increase, the reactive part of the input impedance becomes more inductive, resulting in a downward shift in resonant frequency, which is consistent with the parametric analysis and confirms the influence of current path length on resonance behavior.
Equivalent circuit of the monopole antenna.

Tri-band integrated antenna design
Tri-band EBG unit
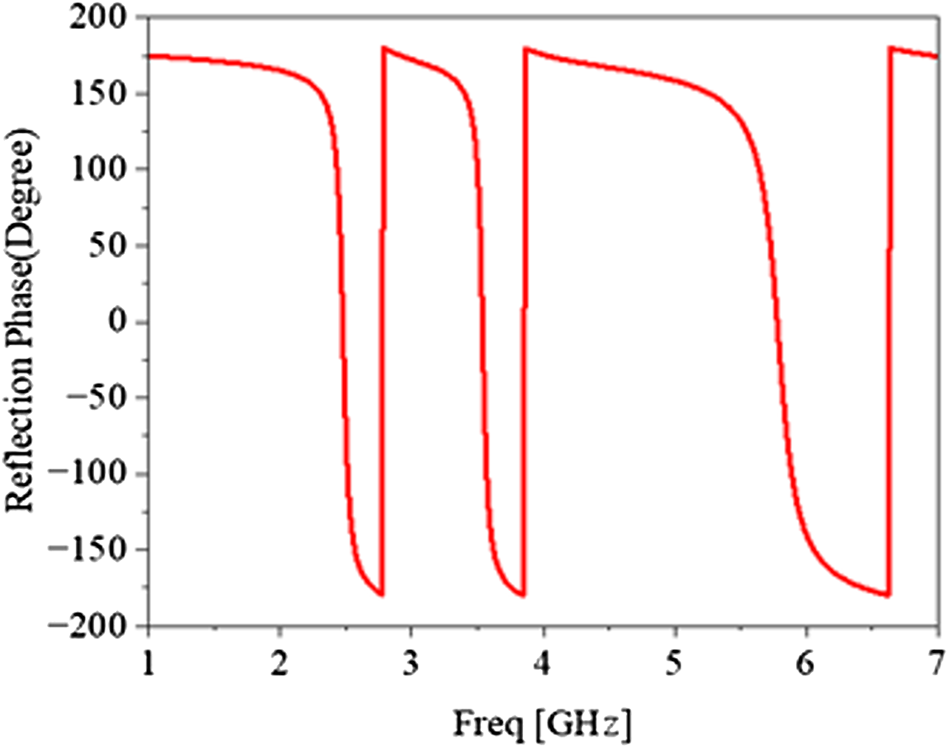
The EBG structure plays a crucial role in wearable antennas, significantly enhancing their performance [Reference Singh, Mishra, Kapoor and Singh20]. In this work, a novel tri-band EBG is implemented on a flexible PDMS substrate (thickness = 2 mm), combining 2 concentric rings with a 12-sided polygonal ring. This design achieves in-phase reflection at 2.45, 3.5, and 5.8 GHz, making it well-suited for flexible tri-band wearable antenna applications. The EBG improves impedance matching and suppresses surface wave propagation, reducing near-field interference and enhancing radiation efficiency. When the antenna is close to the human body, the EBG isolates it from tissue coupling, minimizing energy absorption. Sharing the PDMS substrate with the antenna, the EBG maintains flexibility and structural integrity under bending, ensuring stable electromagnetic performance. As shown in Fig. 7, each EBG unit has an upper layer with concentric rings and a polygonal ring, and a lower full ground plane, with overall dimensions of 24 mm × 24 mm × 2 mm. Figure 8 shows that the EBG unit achieves zero reflection phase at 2.45, 3.5, and 5.8 GHz, confirming in-phase reflection. Compared to conventional single- or dual-band EBGs, this tri-band design enables compact, high-gain wearable antennas with reduced body absorption, highlighting its novelty and suitability for flexible medical and health-monitoring applications.
EBG unit structure. (a) Front view. (b) Side view.

Reflection phase of the EBG unit.

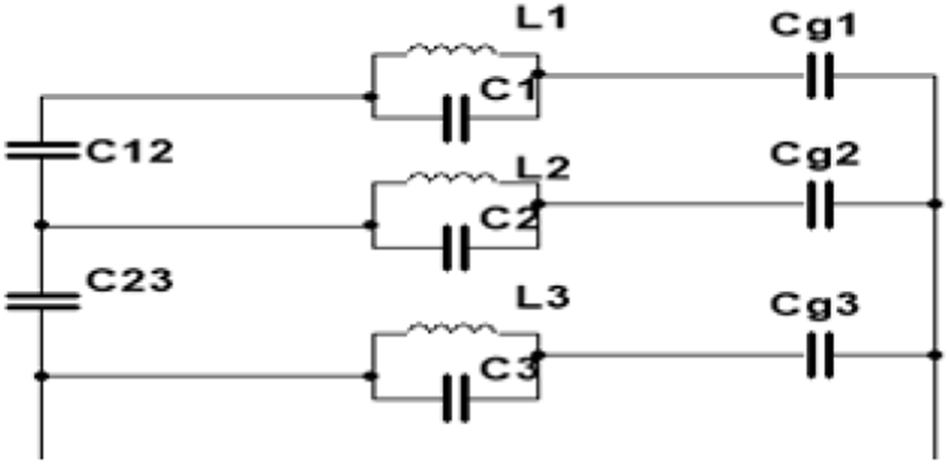
To further investigate the performance of the EBG unit, its current distribution at 2.45, 3.5, and 5.8 GHz was simulated, as shown in Fig. 9. At 2.45 GHz (Fig. 9a), the current is mainly concentrated on the outermost ring, indicating that this ring dominates the low-frequency response. At 3.5 GHz (Fig. 9b), the middle 12-sided polygonal ring plays a key role in shaping the reflection phase. The high-frequency response at 5.8 GHz is primarily governed by the innermost ring, as shown in Fig. 9c. As shown in Fig. 10, the equivalent circuit of the EBG unit is typically based on its resonant characteristics. Each ring is represented by a parallel LC circuit, where the resonant characteristics of the ring are modeled, and each resonant ring is coupled to the ground through parasitic capacitance. There is also coupling between the rings. The resonant frequency of each ring can be calculated using the following formula [Reference Balanis21], based on its LC characteristics.
Surface current distribution of the EBG unit.(a) 2.45 GHz. b) 3.5 GHz. (c) 5.8 GHz.

Equivalent circuit of the EBG unit.

 \begin{equation}f{\text{ = }}\frac{1}{{2\pi \sqrt {{L_{ti}}{C_{ti}}} }}\end{equation}
 \begin{equation}{Z_1} = \frac{{j\omega {L_1}}}{{1 + j\omega {L_1}{C_1}}} + \frac{1}{{j\omega {C_{g1}}}}\end{equation}
 \begin{equation}{Z_2} = \frac{{j\omega {L_2}}}{{1 + j\omega {L_2}{C_2}}} + \frac{{j\omega {C_{12}}{C_{g2}}}}{{{C_{12}} + {C_{g2}}}}\end{equation}
 \begin{equation}{Z_3} = \frac{{j\omega {L_3}}}{{1 + j\omega {L_3}{C_3}}} + \frac{{j\omega {C_{23}}{C_{g3}}}}{{{C_{23}} + {C_{g3}}}}\end{equation}
where  ${L_{ti}}$ is the equivalent inductance of the ith resonant ring and
 ${C_{ti}}$ is the equivalent capacitance of the ith resonant ring. The reflection phase characteristics of each resonant ring at specific frequencies, as well as the coupling between the rings, can be analyzed to determine the bandwidth of the reflection phase. By adjusting the equivalent inductance and capacitance parameters, the reflection bandwidth and frequency performance of the EBG unit can be optimized. In the circuit,
 ${L_1}$,
 ${L_2}$, and
 ${L_3}$ are the inductances of the resonant rings, and
 ${C_1}$,
 ${C_2}$, and
 ${C_3}$ are the capacitances of the resonant rings. The coupling capacitances between each resonant ring and the ground are
 ${C_{g1}}$,
 ${C_{g2}}$, and
 ${C_{g3}}$, respectively, while the mutual coupling between the rings is represented by the capacitances
 ${C_{12}}$ and
 ${C_{23}}$. By combining these elements, the equivalent impedance of the resonant rings can be obtained. The influence of the EBG unit’s structural parameters on the reflection phase is shown in Fig. 11. When R2, P2, and R4 increase, the resonant rings become narrower, concentrating the current path and increasing the current density on the conductor surface. This leads to an increase in the magnetic field strength of the equivalent loop, and the narrower width effectively increases the inductance of the current path in the resonant ring. The narrowing of the resonant rings also reduces the coupling capacitance between two adjacent rings. Since the change in equivalent inductance is typically more significant, the resonant frequency f decreases, and the zero-reflection phase shifts toward lower frequencies. The optimized antenna and EBG unit structural parameters are shown in Table 1.
Reflection phase of the EBG unit for different lengths of R2, P2, and R4. (a) Reflection phase of R2. (b) Reflection phase of P2. (c) Reflection phase of R4.

Monopole antenna and EBG unit structural parameters

Table 1 Long description
The table lists geometric parameters for a monopole antenna and an EBG unit, with all values given in millimeters. The largest dimension is L at 32 mm, followed by W at 28 mm and Wg at 24 mm. Mid-size values include L2 at 13 mm, L1 and L3 at 12 mm, and radii R1 and R2 at 11.7 mm and 11.1 mm. Several widths and spacings are smaller, such as W1 at 4 mm, W2 at 2 mm, Wf at 3 mm, and S1 and S2 both at 5.5 mm. The smallest features are gmw at 1 mm, g1 at 1.1 mm, and gl1, gl2, and gl2 at 1.5 mm, indicating fine gaps compared with the overall antenna size. Additional parameters include P1 at 10 mm, P2 at 9 mm, R3 at 7 mm, R4 at 4.5 mm, gml at 5 mm, and h at 2 mm. No performance metrics are provided, so the table supports dimensional reference only and does not indicate how these sizes affect antenna behavior.
Integrated antenna loaded with EBG array structure
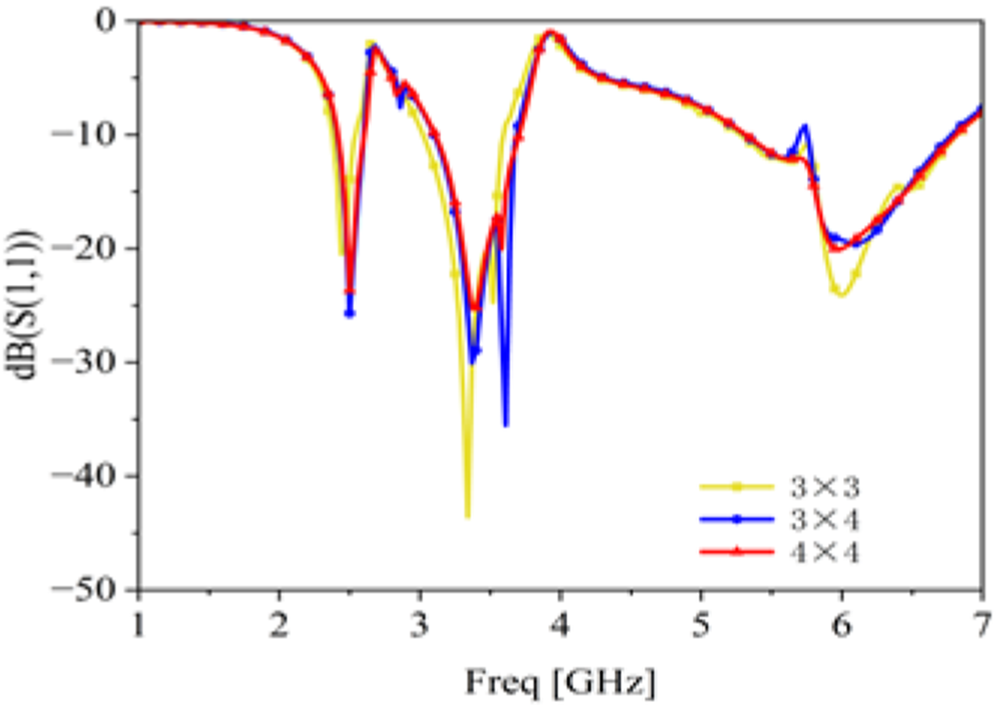
The antenna designed in this paper integrates an EBG array structure, using the EBG array as the reflector for the antenna. The performance of the antenna was analyzed by loading different numbers of EBG arrays (as shown in Fig. 12). The results indicate that when a 3 × 3 array is loaded, the resonant frequency in the mid-band shifts significantly; when a 3 × 4 array is loaded, fluctuations appear in the high-frequency band; however, after loading a 4 × 4 array, the antenna performance meets the design requirements. Therefore, a 4 × 4 EBG array is ultimately selected as the reflector for the antenna, covering the frequency bands of 2.42–2.60 GHz, 3.11–3.70 GHz, and 5.32–6.81 GHz. The overall antenna structure is shown in Fig. 13. Since the EBG array is positioned beneath the antenna, foam polystyrene, which has a dielectric constant close to that of air, is used to connect the antenna to the EBG array.
Reflection coefficient of the antenna loaded with different arrays.

Antenna structure loaded with 4 × 4 EBG array.

When the wearable antenna is attached to the human body, it may experience bending. This bending alters the effective electrical length of the antenna, leading to shifts in its operating frequency. The deformation also modifies the surface current distribution, affecting performance across different frequencies. This effect is particularly pronounced for antennas with multiple branches or coupling structures, as bending changes the current distribution and inter-branch coupling, thereby influencing resonant frequencies and bandwidth. Therefore, the antenna was analyzed under various bending conditions, as shown in Fig. 14. Results indicate that at bending radii of 60, 80, and 100 mm, the antenna maintains good impedance matching. Although the resonant frequencies shift, the operating bands still cover 2.45, 3.5, and 5.8 GHz, demonstrating robust performance under bending. Moreover, both the antenna and the integrated EBG array are fabricated on a flexible PDMS substrate. The EBG unit cells are designed to be thin and conformal, without any rigid metallic backing. Therefore, the overall structure remains lightweight and mechanically flexible, making it well-suited for wearable and body-conformal applications.
Reflection coefficient of the antenna at different bending scales.

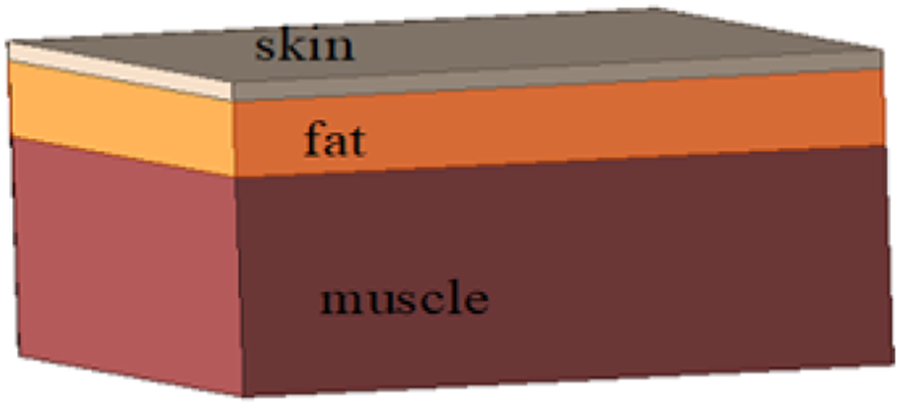
Under the influence of the antenna’s radiated electromagnetic field, an induced field is generated within the human body. As human tissues are lossy media, this field drives currents, resulting in electromagnetic energy absorption. In antenna design, the SAR is a key metric, representing the electromagnetic energy absorbed per unit mass of tissue, typically expressed in W/kg or mW/g. In HFSS simulations, a three-layer human tissue model – comprising skin (2 mm), fat (8 mm), and muscle (23 mm) – was employed (Fig. 15). Due to the frequency-dependent electromagnetic properties of tissues, each layer affects different operating frequencies differently [Reference El Atrash, Abdalla and Elhennawy22, Reference Jiang, Brocker, Sieber and Werner23]. With an input power of 0.1 W, the SAR distributions for antennas without and with the EBG structure are shown in Figs. 16 and 17. The antenna without the EBG exhibits SAR values of 6.84, 12.824, and 11.906 W/kg at 2.45, 3.5, and 5.8 GHz, respectively, whereas the antenna with the EBG shows dramatically reduced SARs of 0.037, 0.031, and 0.027 W/kg. All values are well below the FCC safety limit of 1.6 W/kg, confirming that the EBG-integrated antenna is safe for wearable medical monitoring applications.
Simulated human tissue model.

SAR distribution of the antenna without EBG structure. (a) 2.45 GHz. (b) 3.5 GHz. (c) 5.8 GHz.

Figure 16 Long description
The image A showing a heatmap-style SAR Field distribution map for an antenna without EBG structure at 2.45 GHz. A vertical color scale is labeled SAR Field, with numeric labels starting at 0.002 and ending at 6.842. No x-axis label, y-axis label, or axis units are shown. The plotted area contains a rounded outer region and an inner rectangular region with a block-like shape inside it. The highest-intensity region appears concentrated within the inner area. The image B showing a heatmap-style SAR Field distribution map for an antenna without EBG structure at 3.5 GHz. No x-axis label, y-axis label, or axis units are shown. The same SAR Field color scale applies, ranging from 0.002 to 6.842. The plotted area shows a rounded outer region with a central oval hotspot region. The image C showing a heatmap-style SAR Field distribution map for an antenna without EBG structure at 5.8 GHz. No x-axis label, y-axis label, or axis units are shown. The same SAR Field color scale applies, ranging from 0.002 to 6.842. The plotted area shows a rounded outer region with a smaller hotspot region that is offset from the center and includes a tapered extension. Across the three images, the hotspot location and shape change from a concentrated region within the inner structure in image A, to a centered oval region in image B, to an offset region with an extended tail in image C.
SAR distribution of the antenna with EBG structure. (a) 2.45 GHz. (b) 3.5 GHz. (c) 5.8 GHz.

Figure 17 Long description
Three 2D spatial SAR field maps are shown side by side, labeled (a), (b) and (c), each representing the SAR distribution over a mapped area near the antenna with EBG structure. SAR stands for specific absorption rate, measured in W kg superscript -1. The EBG refers to an electromagnetic bandgap structure integrated with the antenna. These are heatmap-style field plots with no conventional x or y axes shown; the spatial distribution is displayed across the antenna and surrounding phantom cross-section area. A shared color legend is visible on the left side of the composite image. The legend is labeled SAR Field in W kg superscript -1. The scale runs from a minimum of 0.005 W kg superscript -1 up to a maximum of 0.06 W kg superscript -1, with intermediate labeled values of 0.007, 0.009, 0.011, 0.013, 0.015, 0.017, 0.019, 0.021, 0.023, 0.027 and 0.031 W kg superscript -1. In image A, corresponding to 2.45 GHz, the SAR distribution shows the highest concentration, with a visible hotspot near one corner of the mapped area adjacent to the antenna edge. The peak value in this panel approaches the maximum of 0.06 W kg superscript -1, as indicated by the legend correspondence. In image B, corresponding to 3.5 GHz, the SAR distribution is more spread across the mapped area. The peak SAR level in this panel is visibly below the 0.06 W kg superscript -1 maximum shown on the legend scale, with the hotspot region appearing near the antenna boundary but at a reduced intensity compared to image A. In image C, corresponding to 5.8 GHz, the SAR distribution appears more uniform across the mapped area. The peak SAR level in this panel is also visibly below the 0.06 W kg superscript -1 maximum and the concentrated hotspot region is further reduced in magnitude compared to both image A and image B. Across the three panels, the visible hotspot intensity in the mapped area is lower in images B and C than in image A.
Far-field radiation characteristic analysis
Figure 18(a) shows the fabricated antenna prototype, and Fig. 18(b) presents its simulated and measured results with the EBG structure. The measured reflection coefficient S₁₁ indicates operating bands of 2.43–2.58 GHz, 3.42–3.74 GHz, and 5.19–6.48 GHz. Minor resonant frequency shifts are attributed to fabrication tolerances, but overall performance meets the design requirements. Fig. 19(a) illustrates the measurement setup in a microwave anechoic chamber, and Fig. 19(b) shows the frequency-dependent gain. In the lower band (2.45 GHz), radiation is mainly from the central and right branches; in the middle band (3.5 GHz), it arises from coupling between the central and left branches; in the higher band (5.8 GHz), it is dominated by the left and horizontal branches. Integration of the EBG structure significantly enhances gain across all bands by suppressing surface waves and improving radiation efficiency. As shown in Fig. 20, the monopole antenna without EBG exhibits omnidirectional radiation in both E- and H-planes, with peak gains of 1.58, 1.68, and 3.74 dBi at 2.45, 3.5, and 5.8 GHz. The low gains are attributed to surface waves and backward radiation, which reduce effective forward power. Integrating the EBG structure suppresses back radiation and minimizes surface waves, increasing peak gains to 8.1, 6.64, and 8.21 dBi and focusing radiation along the Z-axis. This demonstrates that the EBG effectively channels energy forward, enhancing radiation efficiency and suitability for wearable applications. Measured and simulated patterns agree well, validating the design and practical benefits of EBG integration. Fabrication and measurement challenges, such as slight spacing deviations between the PDMS antenna and EBG array, bending-induced structural changes, and environmental interference, caused minor discrepancies. Table 2 compares this design with other antennas, showing superior gain, wider bandwidth, and extremely low SAR, confirming its suitability for wearable devices.
The simulated and measured reflection coefficient. (a) Photograph. (b) Measurement diagram.

(a) Microwave anechoic chamber and (b) frequency gain diagram.

E-plane and H-plane antenna radiation patterns. (a) E-plane radiation pattern at 2.45GHz. (b) H-plane radiation pattern at 2.45GHz. (c) E-plane radiation pattern at 3.5GHz. (d) H-plane radiation pattern at 3.5GHz. (e) E-plane radiation pattern at 5.8GHz. (f) H-plane radiation pattern at 5.8GHz.

Figure 20 Long description
The image contains six polar plots arranged in three rows and two columns, labeled a through f. Each plot displays antenna radiation patterns. The angular axis represents the pattern cut angle in degrees, ranging from 0 to 360 degrees in increments of 30 degrees. The radial axis represents gain in decibels. Each plot contains three traces: simulated without electromagnetic bandgap, simulated with electromagnetic bandgap and measured with electromagnetic bandgap. The legend is visible in each plot and lists these three traces exactly as: Sim without EBG, Sim with EBG and Mea with EBG. Plot a shows the E-plane radiation pattern at 2.45 gigahertz. The radial axis ranges from minus 15 to plus 15 decibels. The simulated without electromagnetic bandgap trace shows a broad, nearly omnidirectional pattern. The simulated with electromagnetic bandgap trace shows a concentrated main lobe directed toward 0 degrees with reduced back radiation toward 180 degrees. The measured with electromagnetic bandgap trace closely follows the simulated with electromagnetic bandgap trace. Plot b shows the H-plane radiation pattern at 2.45 gigahertz. The radial axis ranges from minus 15 to plus 15 decibels. The simulated without electromagnetic bandgap trace shows a broad pattern. The simulated with electromagnetic bandgap trace shows a main lobe near 0 degrees with reduced back radiation. The measured with electromagnetic bandgap trace aligns closely with the simulated with electromagnetic bandgap trace. Plot c shows the E-plane radiation pattern at 3.5 gigahertz. The radial axis ranges from minus 15 to plus 15 decibels. The simulated without electromagnetic bandgap trace shows a broad pattern with notable side lobes. The simulated with electromagnetic bandgap trace shows a directed main lobe near 0 degrees with reduced back radiation toward 180 degrees. The measured with electromagnetic bandgap trace follows the simulated with electromagnetic bandgap trace closely, with minor deviations. Plot d shows the H-plane radiation pattern at 3.5 gigahertz. The radial axis ranges from minus 15 to plus 15 decibels. The simulated without electromagnetic bandgap trace shows a broad, wide pattern. The simulated with electromagnetic bandgap trace shows a concentrated lobe near 0 degrees. The measured with electromagnetic bandgap trace matches the simulated with electromagnetic bandgap trace with minor deviations. Plot e shows the E-plane radiation pattern at 5.8 gigahertz. The radial axis ranges from minus 20 to plus 10 decibels. The simulated without electromagnetic bandgap trace shows a broad pattern with multiple lobes. The simulated with electromagnetic bandgap trace shows a directed main lobe near 0 degrees with reduced back radiation. The measured with electromagnetic bandgap trace closely follows the simulated with electromagnetic bandgap trace, with slight deviations at certain angles. Plot f shows the H-plane radiation pattern at 5.8 gigahertz. The radial axis ranges from minus 20 to plus 10 decibels. The simulated without electromagnetic bandgap trace shows a broad pattern. The simulated with electromagnetic bandgap trace shows a concentrated main lobe near 0 degrees with reduced back radiation toward 180 degrees. The measured with electromagnetic bandgap trace aligns closely with the simulated with electromagnetic bandgap trace. Across all six plots, the addition of the electromagnetic bandgap structure reduces back radiation and narrows the main lobe toward 0 degrees and the measured with electromagnetic bandgap traces show close agreement with the simulated with electromagnetic bandgap traces.
Comparison of wearable antennas with presented design

Table 2 Long description
The table compares wearable antenna designs by substrate, operating frequency, gain, specific absorption rate (SAR), and fractional bandwidth (FBW). The presented PDMS design operates at 2.45, 3.5, and 5.8 GHz with gains of 9.68, 8.32, and 11.95 dBi, SAR of 0.037, 0.031, and 0.027 W per Kg, and FBW of 7.3, 16.9, and 25.7 percent. Across the listed studies, gains range from 3.28 dBi on a textile design at 2.4 to 2.5 GHz to 14.68 dBi on a flexible substrate at 6.0 GHz, though that high gain entry does not report SAR or bandwidth. SAR values vary widely, from about 0.027 to 0.86 W per Kg, with the PDMS design being the lowest and several multi band textile or felt based designs reporting higher SAR at some bands, such as 0.86 W per Kg at 2.45 GHz for felt. Bandwidth also varies substantially, with some designs reporting very wide FBW around 27 percent at 2.4 to 2.5 GHz, while others are narrow, such as 2.6 percent at 5.8 GHz on RT duroid 5880 and about 1.3 to 1.5 percent on polyethylene foam at 2.5 and 5.2 GHz. Several entries include multiple frequencies with paired gain, SAR, and bandwidth values, and some fields are marked not available, so direct comparisons are limited by missing metrics and differing test conditions.
Conclusion
This paper presents the design of a three-band flexible wearable antenna integrated with an EBG structure, covering three operating frequency bands: 2.42–2.60 GHz, 3.11–3.70 GHz, and 5.32–6.81 GHz. The use of PDMS as the substrate ensures excellent robustness for the antenna. The antenna achieves higher gain at 2.45, 3.5, and 5.8 GHz and integrates a novel 4 × 4 EBG array with a DGS structure. This combined design not only ensures stable operation of the antenna across multiple frequency bands but also significantly enhances gain while reducing SAR.
Author contributions
(1) Shuai Wang, mainly responsible for the language modification in the thesis. (2) Yong Chen, mainly responsible for the experimental simulation and thesis writing in the thesis. (3) Ziyan Zhai, mainly responsible for the actual testing of the antenna prototype.
Funding statement
This work was supported by the Open Project Fund of the Research Center on Levee Safety and Disaster Prevention, MWR (Grant No. LSDP202502).
Competing interests
The authors declare that they have no known competing financial interests or personal relationships that could have appeared to influence the work reported in this paper.

Yong Chen received his B.Eng. degree in Automation from Anyang Institute of Technology in 2023. He is currently interning at the Research Center on Levee Safety and Disaster Prevention and also pursuing a master’s degree at Henan Polytechnic University. His research interests include radio frequency engineering and antenna design.

Shuai Wang received his Ph.D. degree in Communication and Information Systems from Beijing University of Posts and Telecommunications in 2014. He is currently an Associate Professor at the School of Electrical Engineering and Automation, Henan Polytechnic University. His research interests include RF circuit and antenna design, as well as wireless sensing technology.

Xianfeng He received his Ph.D. degree in Hydraulic Structure Engineering from Hohai University in 2013. He is currently a Professor-level Senior Engineer and Chief Engineer at the Research Center on Levee Safety and Disaster Prevention. His research interests focus on wearable sensing technology and structural deformation detection.